


The roles of macronutrients and GH in the regulation of food intake in pediatric obesity and Prader-Willi Syndrome (PWS) are poorly understood.
We compared effects of high-carbohydrate (HC) and high-fat (HF) meals and GH therapy on ghrelin, insulin, peptide YY (PYY), and insulin sensitivity in children with PWS and body mass index (BMI) –matched obese controls (OCs).
In a randomized, crossover study, 14 PWS (median, 11.35 y; BMI z score [BMI-z], 2.15) and 14 OCs (median, 11.97 y; BMI-z, 2.35) received isocaloric breakfast meals (HC or HF) on separate days. Blood samples were drawn at baseline and every 30 minutes for 4 hours. Mixed linear models were adjusted for age, sex, and BMI-z.
Relative to OCs, children with PWS had lower fasting insulin and higher fasting ghrelin and ghrelin/PYY. Ghrelin levels were higher in PWS across all postprandial time points (P < .0001). Carbohydrate was more potent than fat in suppressing ghrelin levels in PWS (P = .028); HC and HF were equipotent in OCs but less potent than in PWS (P = .011). The increase in PYY following HF was attenuated in PWS (P = .037); thus, postprandial ghrelin/PYY remained higher throughout. A lesser increase in insulin and lesser decrease in ghrelin were observed in GH-treated PWS patients than in untreated patients; PYY responses were comparable.
Children with PWS have fasting and postprandial hyperghrelinemia and an attenuated PYY response to fat, yielding a high ghrelin/PYY ratio. GH therapy in PWS is associated with increased insulin sensitivity and lesser postprandial suppression of ghrelin. The ratio Ghrelin/PYY may be a novel marker of orexigenic drive.
Food intake is controlled by, and regulates the expression of, orexigenic (ghrelin) and anorexigenic (leptin, insulin, glucagon-like peptide 1 [GLP-1], and peptide YY [PYY]) hormones produced by white adipose tissue, pancreas, and the gastrointestinal tract. However, the roles of specific macronutrients in the regulation of orexigens and anorexigens are poorly understood. In previous studies we showed that fasting ghrelin and PYY levels are increased and fasting insulin levels are reduced in obese children with Prader-Willi syndrome (PWS), a genetic disorder characterized by failure to thrive in infancy and progressive hyperphagia and weight gain in childhood and adolescence (1). This makes PWS a unique model to study the macronutrient regulation of ghrelin, PYY, and insulin. Children with PWS also have GH deficiency and many (but not all) are treated with GH (2). Comparison of GH-treated and untreated patients with PWS provides the opportunity to assess the effects of GH on appetite-regulating hormones and insulin secretion and action.
In this study, we compared the effects of high-carbohydrate (HC) and high-fat (HF) meals on circulating ghrelin, PYY, and indices of insulin sensitivity in children with PWS and a control group of otherwise-normal children matched for body mass index (BMI) z score (BMI-z). We examined the relationship between ghrelin levels and plasma glucose, insulin, and PYY to explore potential influences of macronutrients on food intake and satiety. We also assessed effects of long-term GH therapy in PWS on ghrelin, PYY, and insulin responses to meal challenge.
Subjects and Methods
Subjects
Fourteen children with PWS (nine males, five females; median age, 11.35 y; BMI-z, 2.15) and 14 BMI-matched controls (six males, eight females; median age, 11.97 y; BMI-z, 2.35) were studied. Subjects with chronic illnesses including diabetes mellitus; liver or kidney disease or malignancy; or those taking appetite suppressants, antipsychotics, stimulants, or investigational drugs were excluded. One teenage boy was being treated with T at the time of the study. No other patients were treated with sex steroids. Pubertal status ranged from Tanner stage I–V; because many of the subjects were self referred we did not have complete data on rates of pubertal progression prior to the study. Nine PWS subjects were taking stable doses of GH (mean, 0.02 mg/kg/d) for at least 1 year at time of study. Of the other five patients with PWS, one had been previously treated with GH for 2 years but at the time of the study had not been taking GH for 7 years. A second patient had been off GH for 1 year at the time of study. The remaining three patients were never treated with GH. Referring physicians made the initial decisions to treat with GH.
All PWS subjects had free T4 and TSH levels in the normal range. Four patients with PWS had uniparental disomy; all others had deletions in chromosome 15. Table 1 shows baseline clinical characteristics. The study was approved by the Duke Institutional Review Board. A parent or legal guardian gave consent; children of at least 12 years of age gave assent for participation.
Baseline Characteristics of PWS and BMI-matched OC Subjects
| Characteristic | PWS | BMI-Matched OCs | P Value |
|---|---|---|---|
| Age, y | 11.35 (5.30–17.38) | 11.97 (8.20–16.60) | .51 |
| Males/females | 9/5 | 6/8 | .26 |
| BMI-Z | 2.15 (1.465, 2.60) | 2.35 (1.78, 2.65) | .70 |
| Glucose, mg/dL | 87.75 (81.75, 101.50) | 94.88 (89.00, 99.50) | .45 |
| Leptin, ng/mL | 31.45 (12.92, 42.67) | 32.24 (15.62, 54.51) | .80 |
| Insulin, μU/mL | 13.49 (10.17, 29.38) | 23.20 (17.17, 34.70) | .03 |
| HOMA-IR | 3.23 (2.50, 5.68) | 5.10 (4.13, 8.66) | .03 |
| Total adiponectin, ng/mL | 8769.00 (6363.50, 15 045.50) | 5798.00 (3216.50, 7352.50) | .01 |
| Adiponectin HMW: total ratio | 0.706 (0.480, 0.840) | 0.403 (0.273, 0.505) | .03 |
| Adiponectin HMW, ng/mL | 5370.50 (2763.00, 11 867.50) | 2523.25 (819.00, 3147.00) | .01 |
| Ghrelin, pg/mL | 1468.45 (1145.71, 1619.32) | 839.69 (719.77, 889.67) | < .001 |
| PYY, pg/mL | 136.71 (126.39, 150.99) | 113.05 (104.00, 127.17) | .02 |
| Ghrelin/PYY | 10.05 (8.06,13.31) | 7.45 (6.04, 9.74) | .02 |
| GLP-I, pg/mL | 9.96 (6.87, 15.48) | 11.56 (10.85, 14.05) | .63 |
| NPY, pg/mL | 213.49 (154.02, 265.18) | 212.94 (183.68, 224.09) | .91 |
| Pancreatic polypeptide, pg/mL | 20.558 (13.851, 26.8535) | 20.907 (18.723, 25.183) | .87 |
Abbreviation: NPY, neuropeptide Y.
All data reported as Median (interquartile range). Age is reported as Median (Range). P values for statistically significant differences are shown in bold.
Experimental design
This was a randomized crossover study. After a 10-hour overnight fast, each subject had a fasting blood sample and was given one of two isocaloric breakfast meals; they were instructed to consume the meals within 25 minutes. The second test meal was administered on a separate day. The two test meals differed in macronutrient content but contained equivalent calories. The HC meal (cereal, low-fat [1%] milk, bagel, cream cheese, and fruit juice) contained 476 kcal with 77 g (65%) carbohydrate, 21 g (17%) protein, and 9 g (18%) fat. The HF meal (scrambled egg, bacon, toast, margarine, jelly, and whole milk) contained 485 kcal with 31 g (58%) fat, 21 g (17%) protein, and 30 g (25%) carbohydrate. Blood samples were drawn every 30 minutes thereafter for 4 hours. Samples were assayed for glucose, insulin, ghrelin, and PYY. No physical exercise was allowed until completion of testing. Length of washout period between test meals was median, 35 (range, 17–90) days.
Preparation of samples
Blood samples were supplemented with aprotinin (500 KIU/mL). Following centrifugation, serum or plasma was stored at −70°C until assay. All analytes were measured in duplicate.
Hormone and adipocytokine assays
Serum samples were assayed for total ghrelin using an RIA (Linco), intra- and interassay coefficients of variation were <10 and <18%, respectively. The assay measures both acyl and des-acyl ghrelin. Total adiponectin was measured by RIA (Linco) with coefficients of variation (CVs) <10%. The leptin and insulin RIAs (Linco) had CVs <10%. Homeostatic model assessment–insulin resistance (HOMA-IR) was calculated as fasting glucose (mg/dL) × fasting insulin (μIU/mL) ÷ 405. The total PYY RIA (Linco) had intra- and interassay CVs <9%.
Statistical analysis
All baseline characteristics were summarized using median and interquartile range. Between-group comparisons at baseline were performed using Wilcoxon Rank-Sum test (3).
Repeated measures were observed for the same subjects (within PWS and OC groups) for two types of diets and multiple time points after meal intake. A linear mixed model was used to study outcomes over time and test between group differences and dietary effects (4). Separate models were estimated for ghrelin, PYY, insulin, glucose, and ghrelin/PYY ratio. Relative changes of values after meal intake with respect to baseline values were modeled separately given that baseline values differed between groups. Relative change was calculated as logarithm (base 2) of the fold change of values respect to baseline; results were reported as percentage change. Meal types and times and GH therapy were included as fixed effects in linear mixed models. Several covariance structures were considered to account for dependence of observations due to repeated measures across multiple time points and two meal types per subject, and the serial correlations across time. For each model, an appropriate covariance structure was selected to fit the data while keeping models parsimonious. All models were corrected for age, sex, and BMI-z.
The Matsuda index (5) was used to estimate whole-body insulin sensitivity; HOMA-IR (6) was considered a measure of hepatic insulin resistance. We also calculated the insulinogenic index (change in ratio of insulin/glucose from 0–30 min) and disposition index (Matsuda index × insulinogenic index). The Matsuda index and HOMA-IR were log transformed given that they were not normally distributed. Two-way ANOVA was used to compare insulin sensitivity indices between PWS and OC and meal types; effects of GH therapy were analyzed by including GH indicator variable into the models.
For between-group contrasts, P < .05 was considered statistically significant. Analysis was performed using SAS version 9.4 (SAS Institute).
Results
Baseline anthropometric and metabolic characteristics
Baseline characteristics of study subjects are shown in Table 1. PWS and BMI-matched obese controls (OCs) were of similar age, sex, and BMI-z and had comparable fasting plasma glucose and leptin. Despite comparable BMI-z score and leptin levels, fasting insulin levels and HOMA-IR were 42 and 36% lower, respectively, in PWS (P = .03) than in BMI-matched OCs. Moreover, total (+51%) and high molecular weight (HMW) (+113%) adiponectin levels were higher in PWS subjects than in BMI-matched OCs (P = .01 and 0.01, respectively), and HMW/total adiponectin ratio was significantly higher (P = .03); no significant differences were seen in the low molecular weight plus medium molecular weight molecular isoforms of adiponectin. These findings, some of which were reported previously (3), suggest that hepatic insulin sensitivity is higher in PWS subjects than in BMI-matched OCs.
Consistent with previous findings, fasting serum ghrelin was 74.8% higher in PWS than OC (P < .001). To determine whether PWS is associated with dysregulation of other gut satiety peptides, we compared fasting levels of total PYY, pancreatic polypeptide (PP), and glucagon-like polypeptide (GLP-1) in PWS subjects with those in OC group. Fasting levels of PP and GLP-1 in children with PWS were comparable to those in the OC group. Fasting total PYY (P = .02) was slightly (+21%), but significantly, higher in PWS than OC. Thus, relative to BMI-matched OCs, children with PWS had high fasting ghrelin, PYY, and adiponectin, and low fasting insulin; in contrast, their fasting levels of leptin, PP, neuropeptide Y, and GLP-1 were comparable to OCs.
Glucose, insulin, and gut-peptide responses to HC and HF meals
Glucose and insulin levels
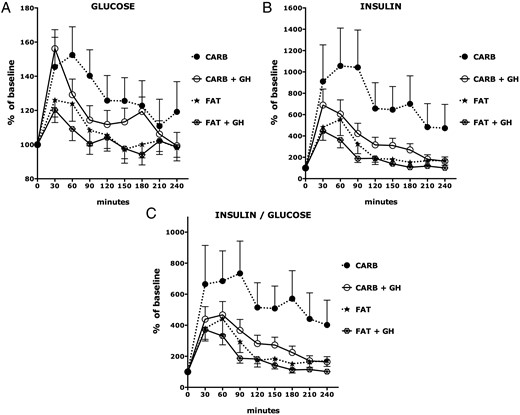
Blood glucose levels increased more after the HC meal than after the HF meal in both OC and PWS subjects (P = .0013 and P = .0004 respectively) (Figure 1A); glucose responses were comparable in the PWS and OC subjects. Insulin levels were higher in OC than in PWS across all postprandial time points (P = .0158; Figure 1, B and C). The HC meal stimulated a much greater release of insulin than the HF meal in both OC and PWS subjects (P < .0001 and P < .0001, respectively). However, the percent increase in insulin from baseline was slightly more pronounced in PWS subjects than OC subjects at 30 minutes (P = .0475). Thus, first-phase insulin secretion seems to be intact in PWS.

Glucose, insulin, and insulin/glucose ratio responses to isocaloric high-fat and high-carbohydrate breakfast meals.
Predicted values and SEs were based on linear mixed models. See the Results for statistically significant differences among the experimental groups. CARB, high-carbohydrate meal; FAT, high-fat meal.
Indices of insulin sensitivity: Matsuda index, HOMA-IR, insulinogenic index, and disposition index
The log Matsuda index, a measure of whole-body insulin sensitivity, was higher in children with PWS than OC (PWS, 1.09 vs OC, 0.78; P = .0099); conversely, OC had higher log HOMA-IR (PWS, 1.28 vs OC, 1.69; P = .0005), a measure of hepatic insulin resistance. There were no significant differences in the insulinogenic (PWS, 2.95 vs OC, 3.41; P = .4353) or disposition (PWS, 8.72 vs OC, 7.01; P = .2427) indices.
Ghrelin
Ghrelin levels were higher in PWS than OC subjects across all postprandial time points (P < .0001; Figure 2A). Ghrelin levels were suppressed in both groups following the HC or HF meals. The time course and magnitude of ghrelin suppression, as assessed by change from baseline, were comparable following HC and HF meals in OC (P = .5331; Figure 2B). In contrast, the HC meal was more potent than the HF meal in suppressing ghrelin in PWS subjects (P = .0273). The magnitude of ghrelin suppression following HC feeding was more pronounced in PWS than OC subjects (P = .0085) at all time points; in contrast, the magnitude of ghrelin suppression by HF feeding in PWS was greater than the magnitude of ghrelin suppression in OC only at 120 minutes (P < .05).
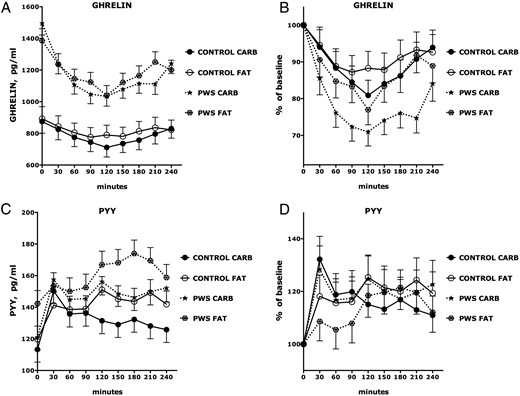
Ghrelin and PYY responses to isocaloric high-fat and high-carbohydrate breakfast meals.
Predicted values and SEs of both observed responses and percent changes relative to baseline (time = 0) of each group at each time point were based on linear mixed models. See the Results for statistically significant differences among the experimental groups. CARB, high-carbohydrate meal; FAT, high-fat meal.
Recovery of ghrelin was slower in PWS following an HC meal than following an HF meal and was delayed in PWS relative to OC subjects (Figure 2B). In contrast, the rate and magnitude of recovery of ghrelin in OC was similar following HC and HF meals.
PYY
The HC meal stimulated an acute increase in PYY at 30 minutes in all groups (Figure 2, C and D). PYY levels in PWS and OC declined between 30 and 60 minutes and then stabilized. There were no differences in PYY responses to HC or HF meals among OC subjects. In contrast, the acute PYY increase at 30 minutes following the HF meal was delayed and attenuated in PWS (P = .037; Figures 2, C and D).
Ghrelin/PYY ratio
The ratio of Ghrelin to PYY, which could be considered a measure of orexigenic drive, was higher in PWS than OC subjects across all postprandial time points (P = .0006; Figure 3A). HC and HF feeding caused comparable reductions in the ghrelin/PYY ratio among OC (P = .9582). In contrast, HC feeding was more potent (nadir, −43% from baseline) than HF feeding (nadir, −34%) in reducing the ghrelin/PYY ratio in PWS subjects (P = .0012; Figure 3, A and B). The magnitude of reduction in the ghrelin/PYY ratio following HC feeding was marginally greater in PWS than in OC (P = .052). The postnadir increase (recovery) in ghrelin/PYY ratio was more pronounced following HF feeding than HC feeding in PWS (P = .0442).

Ghrelin/PYY ratio responses to isocaloric high-fat and high-carbohydrate breakfast meals.
Predicted values and SEs of both observed responses and percent change relative to baseline (time = 0) of each group at each time point were based on linear mixed models. See the Results for statistically significant differences among the experimental groups. CARB, high-carbohydrate meal; FAT, high-fat meal.
Differences between GH-treated and -untreated children with PWS
PWS subjects receiving GH therapy were younger and had lower BMI-z scores (P = .04) and leptin levels (P = .03) and higher IGF-I-standard deviation score (P = .02) and HMW-adiponectin (P = .003) than GH-untreated PWS subjects (P = .04) (7).
GH therapy had no effect on fasting or postprandial glucose levels (Figure 4A). There was a lesser increase in insulin in GH-treated PWS children than in untreated children following the HC meal (P = .001) but not the HF meal (P = .1261; Figure 4B). Consequently, the percent increase in the ratio of insulin/glucose was lower in patients with PWS treated with GH following an HC meal (P = .0017, Figure 4C).
Glucose, insulin, and insulin/glucose ratio responses to isocaloric high-fat and high-carbohydrate breakfast meals in GH-treated and untreated PWS.
Predicted values and SEs of percent change relative to baseline (time = 0) of each group at each time point were based on linear mixed models. See the Results for statistically significant differences among the experimental groups. CARB, high-carbohydrate meal; FAT, high-fat meal; +GH, treated with GH.
The Matsuda index was higher in GH-treated children with PWS than in untreated children with PWS children (P = .047). The effect of GH therapy was abolished when the data were adjusted for age, sex, and BMI-z, and the Matsuda index in untreated subjects with PWS was comparable to that in OC subjects.
The percent reduction in ghrelin following HC and HF meals was most pronounced among children with PWS who were not treated with GH (P < .0001); there was an exaggerated and prolonged suppression of ghrelin by HC feeding in untreated PWS children (P < .0001, Figure 5A). In contrast, the magnitude of ghrelin suppression in GH-treated children with PWS was similar to that in (untreated) OC (P = .7424). Moreover, the rebound recovery of ghrelin in GH-treated patients with PWS following HC (P = .4709) or HF (P = .8273) meals was similar to that in (untreated) OCs (Figure 5A).
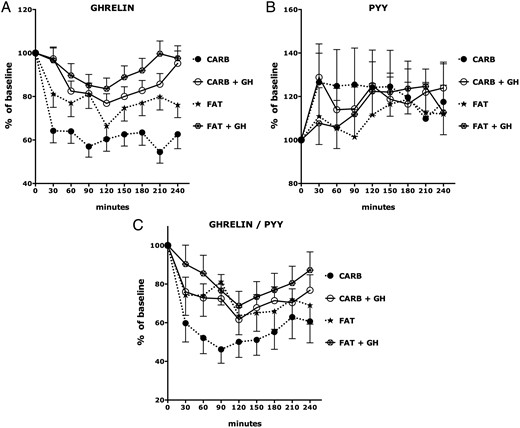
Ghrelin, PYY, and ghrelin/PYY ratio responses to isocaloric high-fat and high-carbohydrate breakfast meals in GH-treated and untreated PWS.
Predicted values and SEs of percentage change relative to baseline (time = 0) of each group at each time point were based on linear mixed models. See the Results for statistically significant differences among the experimental groups. CARB, high-carbohydrate meal; FAT, high-fat meal; +GH, treated with GH.
In contrast with its effects on ghrelin, there were no significant effects of GH therapy on PYY responses to HC or HF meals (Figure 5B).
The percent reduction in ghrelin/PYY ratio following HC and HF meals was most pronounced among children with PWS who were not treated with GH (P < .0001); there was an exaggerated and prolonged suppression of ghrelin/PYY ratio by HC feeding in untreated PWS children (P < .0001; Figure 5C).
Discussion
PWS is a genetic disorder characterized by failure to thrive and hypotonia in infancy, childhood short stature, cognitive delay, behavioral difficulties, sleep disturbances, and progressive obesity associated with periods of insatiable hunger (1). Previous studies from this and other laboratories has shown that PWS is associated paradoxically with high fasting levels of ghrelin, a gastric hormone that promotes food intake and weight gain in humans and experimental animals (8–17) PWS children also have GH deficiency and many, but not all, are treated with GH (2). The paradoxical fasting hyperghrelinemia and GH deficiency make PWS a unique model to study the control of hormones, cytokines, and metabolites that regulate food intake, insulin production, and insulin action.
In this study we explored the macronutrient regulation of ghrelin, PYY, and insulin levels in children with PWS and BMI-matched OCs using isocaloric HC and HF test meals and a rigorous statistical analysis using linear mixed models. We also assessed the effects of GH therapy on hormonal responses to nutrient challenge. Analysis of our findings permits us to make three novel observations.
First, ghrelin levels are higher in children with PWS than OCs at baseline and after HC or HF feeding, but carbohydrate is more potent than fat in suppressing ghrelin in PWS and delays its recovery.
Second, the increase in PYY following an HF meal is delayed and attenuated in PWS. Thus, as measured by ghrelin/PYY ratio, children with PWS have higher orexigenic drive under fasting conditions and during a mixed-meal tolerance test. This reflects fasting and postprandial hyperghrelinemia and an attenuated PYY response to fat.
Finally, there are lower levels of leptin, a lesser postprandial increase in insulin, and a blunted suppression of ghrelin in patients with PWS treated with GH. These are abolished by adjustment for BMI-z, suggesting that the effects of GH are mediated by reductions in adiposity and consequent increases in insulin sensitivity.
Some of our findings are consistent with those of Bizzarri et al (18), who found a more rapid decline in plasma ghrelin in PWS than obese children following a mixed liquid meal. In addition, a study by Paik et al (19) showed more marked suppression of acylated ghrelin levels in PWS children than in obese controls after glucose challenge. The preferential suppression of ghrelin by carbohydrate feeding might be explained in part by higher postprandial insulin levels following carbohydrate ingestion: fasting acylated and des-acyl ghrelin levels and absolute suppression of acylated ghrelin correlated with whole-body insulin sensitivity index in PWS children, suggesting that acylated ghrelin might be suppressed by insulin. Indeed, several studies show that insulin inhibits ghrelin secretion independent of glucose (20–25). The mechanism of suppression of ghrelin by insulin is not understood. Insulin might exert a direct effect on the ghrelin-secreting cells of the stomach or modulate other neuroendocrine mechanisms regulating ghrelin release. Additional possible mediators of ghrelin suppression may include autonomic nervous system activity (vagally mediated) and/or postprandial increases in intestinal osmolarity (26, 27).
In contrast with ghrelin, a gastric hormone that promotes food intake, PYY is produced by intestinal L cells and inhibits food intake (28). In our study, both HC and HF meals induced an increase in PYY in the PWS as well as OC group. However, the increase in PYY following HF feeding was delayed and attenuated in PWS. We cannot exclude the possibility that a selective defect in gastric emptying attenuates the PYY response to HF feeding. Indeed, a single small study found that gastric emptying rate in adults with PWS was comparable to that in lean adults but slower than that in obese adults (29). Moreover, a study in children with PWS showed delayed gastric emptying compared with obese children despite higher ghrelin levels (30). In contrast, the insulin secretory response to fat in our PWS subjects was normal.
The fasting and postprandial hyperghrelinemia and attenuated PYY response to fat in PWS yields an imbalance between orexigenic and anorexigenic hormones. This suggests that the ratio of ghrelin to PYY may serve as a novel marker for, or driving force behind, the hyperphagia of PWS. It also suggests that children with PWS might benefit from therapeutic approaches designed to increase PYY and/or reduce ghrelin production or action. In that vein, it should be noted that medications (such as somatostatin agonists) that reduce PYY levels might counteract any beneficial effects of concurrent ghrelin reduction on appetite or weight gain (13).
Our findings regarding PYY differ in part from those of other investigators. Butler et al (31) reported lower fasting levels of PYY in infants and children age 2.5 months to 13.3 years with PWS compared with a control population. Conversely, Bizzarri et al (18) reported that children with PWS exhibit higher meal-induced responses in plasma PYY levels than obese and lean children. In adult patients with PWS, fasting and postprandial PYY levels were comparable to those in obese controls and subjects with hypothalamic obesity (32). In contrast, Gimenez-Palop et al (33) found lower fasting PYY levels in PWS adults than in lean subjects and a blunted postmeal PYY response in PWS relative to obese or lean adults. The latter observation is consistent with our findings. It is possible that the nutrient regulation of PYY in PWS might be modulated by metabolic or hormonal status and might change during development.
One major hormonal determinant of metabolic status is the availability of GH. Previous studies revealed that GH reduces body fat and weight gain in PWS (34–39). This likely explains why BMI-z scores and leptin levels in our GH-treated PWS subjects were lower than those in untreated PWS patients. GH treated PWS subjects had higher whole body insulin sensitivity, as measured by Matsuda index (40), but normal insulin secretion. We hypothesize that GH therapy in PWS causes lipolysis and antagonizes the lipogenic effect of insulin, reducing white fat mass and lowering leptin. These in turn increase insulin sensitivity and adiponectin levels and reduce the insulin secretory response to carbohydrate and the postprandial insulin/glucose ratio. The relative decrease in insulin may promote an increase in ghrelin; this could explain the lesser decrease in ghrelin in response to carbohydrate in our GH-treated PWS patients. It is also possible that the differences in GH-treated and untreated subjects might be related to differences in age. Despite differences in age, however, GH therapy had no effect on fasting or postprandial PYY levels.
How these changes modulate food intake in PWS is currently unclear. To our knowledge there is as yet no study that has investigated the effects of GH on eating behavior or actual food intake in children with PWS. In a small group (n = 12) of adults with PWS, Hoybye et al (29) found no effects of GH therapy (n = 7) on eating behavior using Visual Analogue Rating Scales and individual eating curves.
Major strengths of our study include the relatively large number (for a rare genetic disorder) of children with PWS, the use of OCs matched for age, sex, and BMI-z, the careful matching and random testing of isocaloric HC and HF meals, and the rigorous statistical analysis using linear mixed models to estimate percentage change from baseline in study outcomes over time as well as group differences and dietary effects. Moreover, the inclusion of GH-treated and -untreated patients with PWS enabled us to identify novel effects of GH therapy on appetite-regulating hormones, insulin production, and insulin action.
Limitations of our study include the lack of assessment of appetite and satiety. We did not measure acyl and des-acyl ghrelin levels in our study cohort; at the time this study was initiated, no accurate measure of acylated ghrelin was available and samples were not prepared for its measurement. Moreover, no detailed measurement of body fat content was applied. Pubertal stage was not accounted in the models given that we did not have complete data on rates of pubertal progression prior to the study.
Despite these limitations, the findings of our study suggest that children with PWS have higher orexigenic drive under fasting conditions and during a mixed-meal tolerance test: their higher ghrelin/PYY ratio reflects fasting and postprandial hyperghrelinemia and an attenuated PYY response to fat. GH therapy in PWS is associated with reduced body fat and leptin, increased insulin sensitivity, and attenuated postprandial suppression of ghrelin. We conclude that ghrelin/PYY ratio may serve as a marker of, or stimulus for, the development of hyperphagia in PWS. Therapeutic approaches designed to increase PYY and/or reduce ghrelin production or action might therefore prove beneficial in children with PWS. Longer-term randomized controlled trials of varying macronutrient composition will facilitate the development of dietary therapies that attenuate hyperphagia, prevent weight gain, and promote weight loss.
Acknowledgments
We thank Ms Juanita Cuffee (study coordinator) for help with recruitment of study subjects as well as the families and children who participated in these studies.
This study was registered in ClinicalTrials.gov as trial number NCT02464514.
This study was conducted through the Duke University Medical Center, General Clinical Research Center (MO1-RR-30, National Center for Research Resources, Clinical Research Centers Program, National Institutes of Health) and was supported by grants from the National Institute of Diabetes and Digestive and Kidney Diseases (1K23-RR-021979, to A.M.H.), the Foundation for Prader-Willi Research (to M.F. and A.M.H.), and additional funding from the Sarah W. Stedman Nutrition and Metabolism Center/Duke Molecular Physiology Institute, the Canadian Institutes of Health Research Institute of Nutrition, Metabolism and Diabetes, Stollery Children's Hospital Foundation, the Women and Children's Health Research Institute, the Alberta Diabetes Institute, American Diabetes Association, Duke Children's Miracle Network and Duke Private Diagnostic Clinic Enhanced Academics in a Basic Laboratory Environment (ENABLE) career development program (to P.G.B.).
Disclosure Summary: The authors have nothing to disclose.
M.F. and A.M.H. contributed equally to the study.
Abbreviations
- BMI
body mass index
- BMI-z
body mass index z score
- CV
coefficient of variation
- GLP-1
glucagon-like peptide 1
- HC
high carbohydrate
- HF
high fat
- HMW
high molecular weight
- HOMA-IR
homeostatic model assessment–insulin resistance index
- OC
obese control
- PP
pancreatic polypeptide
- PWS
Prader-Willi syndrome
- PYY
peptide YY.
