


There is growing interest in the relationship between bone marrow fat (BMF), bone mineral density (BMD), and fractures. Moreover, BMF might be influenced by metabolic diseases associated with bone loss and fractures, such as type 2 diabetes mellitus (T2DM), anorexia nervosa (AN), and obesity.
The primary-source literature for this review was acquired using a PubMed search for articles published between January 2000 and April 2015. Search terms included BMF, BMD, fractures, T2DM, AN, and obesity. The titles and abstracts of all articles were reviewed for relevant subjects.
Magnetic resonance imaging, with or without spectroscopy, was used to noninvasively quantify BMF in humans. A negative relationship was found between BMD and BMF in both healthy and osteopenic/osteoporotic populations. Data are lacking on the relationship between BMF and fractures. Studies in populations of individuals with metabolic diseases such as T2DM, AN, and obesity have shown BMF abnormalities.
We conclude that most human data demonstrate an inverse relationship between BMF and BMD, but data on the relationship with fractures are inconsistent and need further study. In daily practice, the usefulness for clinicians of assessing BMF using magnetic resonance imaging is still limited. However, the perspectives are exciting, particularly in terms of improving the diagnosis and management of osteoporosis.
With the increase in population age and the prevalence of obesity, it is important to understand the relationship between adipose tissue and bone mass, bone quality, and fractures (1, 2). Greater body weight or body fat mass has been known to have a positive effect on bone mineral density (BMD), but obesity is not protective against fractures. Furthermore, the association between fractures and obesity seems to be site-dependent (3–5). The connection between fat and bone is complex because adiposity has associations with bone that are age-, gender-, menopausal status–, adipose depot–, and bone compartment–specific (6, 7). Indeed, subcutaneous adipose tissue (SAT), visceral adipose tissue (VAT), and bone marrow fat (BMF) exhibit distinct, tissue-specific properties and therefore different metabolic activities (8, 9).
In the past decade, a new approach to evaluating the bone-fat relationship has emerged, focusing on BMF (10, 11). Osteoblasts and adipocytes differentiate from the same mesenchymal stem cells (MSCs). Aging and estrogen deficiency—two conditions pivotally involved in the pathophysiology of osteoporosis—are associated with lower osteogenic and greater adipogenic lineage commitment of MSCs (12, 13). This differentiation process is mainly regulated by the transcription factors peroxisome proliferator-activated receptor-γ and runx2 (for adipogenesis and osteoblastogenesis, respectively), with the cooperation of numerous other factors, in particular the Wnt pathway (14, 15). In addition, fat and bone are increasingly recognized as being capable of mutual regulation (15, 16). This process occurs in the bone marrow, and histomorphometric studies have shown a positive connection between bone marrow adiposity and osteoporosis (17, 18). This “local interaction” is associated with the autocrine and paracrine release of fatty acids and cytokines such as adipokines, osteoprotegerin, soluble receptor activator of nuclear factor kB ligand, tumor necrosis factor-α, and interleukin-6 (19). Furthermore, BMF has been studied recently as an endocrine organ with systemic effects (20), and it has been suggested that there are two types of BMF: one that is present throughout life (ie, constitutive) and one that is regulated by local and systemic factors (7).
As imaging techniques become more sophisticated, the role of adiposity on skeletal health can be studied directly and noninvasively. As such, BMF can now be noninvasively quantified using magnetic resonance imaging (MRI), either with or without spectroscopy (21, 22). Using MRI with spectroscopy (MRS) in combination with dual-energy x-ray absorptiometry (DXA), several studies have reported a detrimental role of BMF on BMD in patients with osteoporosis as well as in populations of individuals with metabolic diseases such as obesity, diabetes mellitus and anorexia nervosa (AN) (23–26). It is conceivable, therefore, that BMF may be driving bone loss—at least in part—and contributing to osteoporosis (6). However, there are now animal models suggesting that a positive coexistence of marrow adipocytes and osteoblasts is possible in mice with a high bone mass phenotype, thus turning fat from foe to friend of the skeleton (27, 28).
This article review presents our understanding of the role of BMF in skeletal health and draws on animal data to fill in the gaps where human data are unavailable. Because of restrictions on the length of the reference list, the reader is also referred to another review written by our team on the same topic (29).
Materials and Methods
The primary-source literature for the review was acquired using a PubMed search for articles published between January 2000 and April 2015. The search was limited to human and animal studies in the English language; search terms included bone marrow fat, BMD, fractures, diabetes, anorexia nervosa, and obesity. This was complemented by a hand search of relevant key journals and the examination of several reference lists. The titles and abstracts of all articles were reviewed for relevant subjects.
BMF evaluation in patients
MRI appears to be the best method for measuring BMF in humans (21–24). However, various techniques and methods are described in the literature, and this, together with the heterogeneous nature of BMF (30), may account for discrepancies in measurement results. Most clinical studies on the relationship between BMD and BMF have used MRS to analyze separate water and fat signals of BMF (BMF content) at the vertebrae or hip (31, 32), with or without magnetic resonance perfusion imaging (to assess BMF perfusion) (33). MRS is also used to measure lipid saturation (BMF composition [ie, presence and type of hydrogen bindings]) within the bone marrow (25). The resulting spectrum shows peaks corresponding to water, saturated lipids, unsaturated lipids, and residual lipids (Figure 1) (25, 34). In MRS measurements, BMF is expressed as a percentage. For evaluation of vertebral BMF, the measurement is acquired on one or more of the lumbar vertebral bodies (L1–L4). A single voxel is placed in the center of the vertebral body (21). The percent of BMF can be calculated using the large lipid peak at 1.3 ppm (saturated lipids), ignoring the much smaller lipid peaks at 5.3 (unsaturated lipids) and 2.0 (residual lipids) (21). Fat content is then calculated as: fat content = [(Ifat/ (Ifat + Iwater)] × 100%. Furthermore, BMF content has also been reported using three of these lipid peaks (34). With MRS, it is also possible to quantify the smaller lipid peaks and assess the degree of saturation of the lipids in marrow (34).
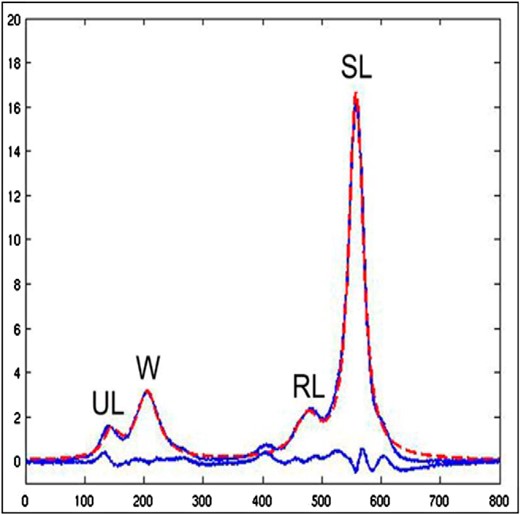
Bone marrow fat evaluation in patients: MRI with spectroscopy.
The resulting spectrum shows four peaks corresponding to water (W), saturated lipids (SL), unsaturated lipids (UL), and residual lipids (RL). Adapted from Li et al (21).
T1-weighted whole-body MRI has been used to overcome the regional sampling and heterogeneity of vertebral or hip MRS and as a means of evaluating the interaction between fat and bone, independently of SAT or VAT, by adjusting for body composition (23, 24, 26). BMF content can also be measured using water-fat imaging methods such as the 3-point Dixon method, which covers a large area of bone and is more time and cost effective than MRS (35). BMF measured by the Dixon method and by T1-weighted MRI (24, 26, 35) is also expressed as a percentage. By T1-weighted MRI, fat fraction is calculated for the whole body and for specific regions, often the pelvic region, from a whole-body MRI.
Finally, dual-energy quantitative computed tomography (QCT) can also be used to assess BMF density (g/cm3) (eg, tibial BMF density), but requires exposure to relatively high levels of radiation (36).
Thus, MRI with or without spectroscopy can be used to noninvasively quantify BMF in humans. However, MRS is technically demanding and requires advanced postprocessing. Last, there is currently no standardized protocol for BMF imaging.
BMF variations with age, sex, and menopause
At birth, bone cavities are filled mainly with red hematopoietic marrow. During childhood, red marrow is gradually replaced by fatty yellow marrow (37). BMF variations with age, sex, and menopause are illustrated in Figure 2. Despite wide individual variations, there is, globally, a positive correlation between BMF and age (38, 39). However, this positive correlation has only been demonstrated in cross-sectional studies. One of the most comprehensive studies to address sex-related changes in BMF in healthy subjects is that of Kugel et al (40). This study shows an age-related increase in vertebral BMF in both males and females, with males possessing approximately 6–10% more fat than females of comparable age between the ages of 20 and 60 years (40). More recently, data on elderly subjects (>60 years of age) have been obtained (41). Overall, 259 healthy subjects, 62–90 years of age were recruited. This is the first study to show that vertebral BMF increases sharply in females between 55 and 65 years of age (ie, in those years following menopause) (41). In males, vertebral BMF content rose gradually throughout life. Vertebral BMF content in females older than 60 years of age is approximately 10% higher than in males (ie, a reversal of the sex difference in BMF content reported for subjects younger than 60 years) (40, 41).
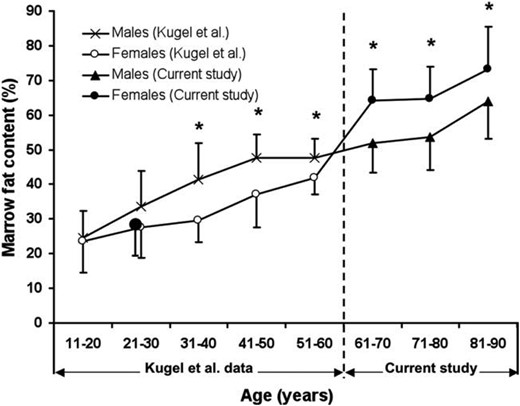
Marrow fat content (%) of lumbar vertebral body stratified for age.
*Age groups with a significant male-female difference in marrow fat content (%). Adapted from Griffith et al (41).
BMF variations with exercise and unloading
Adults
Exercise is universally recognized as a means of decreasing obesity-associated white adipose tissue depots and enhancing BMD and muscle mass (42, 43). Interestingly, bone response to exercise includes changes in BMF, which may contribute to the beneficial effect of exercise on bone mass. For example, female athletes (17–40 years of age) involved in weight-bearing impact sports (impact group, n = 122) have lower BMF (tibial BMF density assessed using peripheral QCT) compared with athletes involved in nonimpact loading sports (nonimpact group, n = 57) and nonathletic controls (control group, n = 41) (44). Furthermore, in all young women, BMF is a predictor of bone strength, independently of loading history, body size, or body composition (44).
The effect of immobility on vertebral BMF, assessed using MRI, has been measured prospectively in 24 healthy women (25–40 years of age) who had undergone bed rest. Vertebral BMF had increased after 60 days of bed rest (+2.5 ± 1.1%, P < .05), and the increased level persisted for 1 year after bed rest had ended (45). In another study (the second Berlin Bed Rest Study), 24 healthy men (20–45 years of age) underwent bed rest for 60 days and the accumulation of vertebral BMF was prevented by resistive exercise with or without whole body vibration (46). Drawing on histological data, investigators have also identified spinal cord injury as a condition associated with bone marrow adiposity accumulation (47).
Children
In a pilot study, Casazza et al (48) randomized 20 children (mean age, 5 years) to a school-based physical activity intervention group involving thrice-weekly 20-minute sessions of moderate physical activity such as jumping, hopping, running, and stretching (intervention group, n = 10), or to usual physical activity (controls, n = 10). The authors found that those randomized to the intervention group showed a significant reduction in MRI-assessed femoral BMF.
Mice
Moreover, in 8-week-old female C57BL/6 mice, BMF accumulation accelerated by a high-fat diet was suppressed by exercise (voluntary access to running wheels) after 6 weeks (49). In this study, femoral BMF was assessed by micro-computed tomography (Scanco μCT-35, Scanco Medical, Bruttisellen, Switzerland) as well as bone parameters, and mice were divided into regular-diet and high fat-diet groups with or without exercise (four groups, n = 5 per group). Interestingly, exercise significantly increased bone quantity in both diet groups (49).
Taken together, these studies suggest that the beneficial effect of exercise on BMD might be mediated by a decrease in BMF and a concomitant increase in osteoblastogenesis.
Relationship between BMF and BMD
Clinical studies in healthy populations
In most of these studies, BMF was measured using T1-weighted whole-body MRI (Table 1). Several studies found a significant negative association between BMF content and BMD in healthy men (26, 50) and women (24, 26, 50). Whole-body and pelvic MRI-measured BMF were strongly correlated with whole-body DXA-measured BMD in 56 healthy Caucasian women (18–88 years of age) (24). This negative correlation with pelvic MRI-measured BMF remains significant after adjusting for age, weight, total body fat, and menopausal status (24). In a population of 210 middle-aged Caucasian and African-American men and women (38–52 years of age), a negative relationship was found between MRI-measured BMF (pelvic, hip, and lumbar spine) and hip and lumbar spine BMD, independently of demographic and body composition (26). In another study including 560 healthy men and women (younger group: age 18.0–29.9 years; older group: age 50.0–88 years), Shen et al observed an inverse relationship between BMF and BMD in an anatomically matched region (ie, pelvic BMF and pelvic BMD), a nonanatomically matched region (ie, pelvic BMF and spine BMD), and regional and whole-body (ie, pelvic BMF and whole body BMD), after adjusting for body composition (50). The inverse relationship observed between pelvic BMD and pelvic BMF was also found in children and thus extends previous findings (24, 51).
Cross-Sectional Studies Evaluating the Relationship Between BMF and BMD in Healthy Populations
| Study | Population | Adiposity Measure | Bone Parameters | Results | Adjustment |
|---|---|---|---|---|---|
| Shen et al, 2007 (24) | 56 women (18–88 years) | Total body and pelvic BMF content by whole-body MRI | Total body, pelvic and spine BMD (DXA) | Inverse correlation between pelvic BMF content and total body, pelvic, and spine BMD | Age, weight, total body fat, and menopausal status |
| Shen et al, 2012 (26) | 210 African-American and Caucasian men and women (38–52 years) | Pelvic, hip, and lumbar BMF content by whole-body MRI | Hip and spine BMD (DXA) | Both hip and lumbar spine BMD were significantly inversely associated with pelvic BMF, hip BMF, and lumbar BMF | Demographics, weight, skeletal muscle, total body fat, SAT, VAT, menopausal status, lifestyle factors, and inflammatory markers |
| Shen et al, 2012 (50) | 560 participants (180 men and 380 women) | Pelvic BMF content by whole-body MRI | Total body, pelvic, and spine BMD (DXA) | Inverse correlation between pelvic BMF content and BMD in both the older and younger groups | Age, weight, total body fat, SAT, VAT, skeletal muscle, sex, ethnicity, and menopausal status |
| (18–29.9 younger group and 50–88 older group) |
Furthermore, it is also important to extend the focus beyond DXA to other bone indices (eg, volumetric BMD using QCT, cortical parameters) and to examine the relationship with BMF in healthy populations. For example, in a study involving healthy participants and persons with diabetes (25), mean vertebral BMF was found to be inversely correlated with spinal volumetric BMD (vBMD using QCT, L1–L3) for all subjects (r = −0.452; P < .05). In another study, vertebral BMF as measured by MRS was also inversely correlated with spinal vBMD (r = −0.39, P = .007) in 47 premenopausal women of various body mass indices (BMIs) (range: 18–41 kg/m2, mean 30 ± 7 kg/m2), and the correlation remained significant after controlling for VAT (P = .03) (52). Wren et al have shown that femoral cortical bone area along the shafts of all femurs, assessed using MRI, is inversely associated with BMF in the middle third of femurs in both young subjects (n = 8, <25 years old) and older men and women (n = 9, >55 years old) (23). In another cohort of 255 healthy teenagers and young adults (126 females, 129 males, 15–24.9 year of age), QCT was used to determine the possible relationship between the amount of bone in the axial and appendicular skeletons (vertebral cancellous bone and femoral cortical bone respectively) and BMF density measurements in femurs (53). The authors found that in healthy teenagers and young adults, the amount of bone in the axial and appendicular skeleton was inversely related to BMF, even after controlling for weight, height, DXA fat mass, and bone size (53). In another longitudinal study performed by Di Iorgi et al, the authors found that bone acquisition in the femur (cortical bone area using QCT) of 39 healthy young females (15–20 years of age) was inversely related to changes in BMF density (54).
These studies suggest that BMF measured by T1-weighted whole-body MRI is inversely associated with BMD assessed using DXA in healthy populations. Furthermore, several studies have demonstrated an inverse relationship between BMF density and bone parameters such as spinal vBMD by QCT or femoral cortical bone by QCT. It is important to note that the inverse relationship between BMF and BMD is more than just a statistical association. Within increasing BMF, there are also histologic changes within fat tissue assessed using bone biopsy.
Clinical studies in osteoporotic populations
As with histomorphometric studies performed on iliac crest biopsies (17, 18), higher BMF content as measured by MRS has been shown in osteoporotic Chinese men and women 55 years of age and older, when compared to those with low (osteopenic) or normal BMD matched for age (31, 32) (Table 2. More recently, in 51 postmenopausal women (54–73 years of age), BMF content measured by MRS was found to be significantly higher in patients with osteoporosis/osteopenia compared with controls, after adjustment for age and BMI (P < .05) (21). Similar results were found in 78 postmenopausal women (55–81 years of age) (55). Furthermore, BMF perfusion seems to be compromised in osteoporosis (56, 57) and might be a predictive factor of bone loss in elderly females (33, 58).
Cross-Sectional Studies Evaluating the Relationship Between BMF and BMD in Osteoporotic Populations
| Study | Population | Adiposity Measure | Bone Parameters | Results | Adjustment |
|---|---|---|---|---|---|
| Griffith et al, 2005 (31) | 82 men (67–101 y) | Vertebral BMF content by MRS Vertebral BMF perfusion (average maximum enhancement) Anatomic site: L3 MRI: 1.5 Tesla | Vertebral BMD (DXA) Normal (n = 42) Osteopenic (n = 23); osteoporotic (n = 17) | BMF content↗ and BMF perfusion↘ 1/osteoporotic versus normal 2/osteopenic versus normal | Age-matched |
| Yeung et al, 2005 (32) | 50 postmenopausal women (66–81 years of age) and 12 controls (18–43 years) | Vertebral BMF content by MRS Vertebral BMF composition by MRS Anatomic site: L3 MRI: 1.5 Tesla | Vertebral BMD (DXA) Normal (n = 15), osteopenic (n = 15), osteoporotic (n = 20), and controls (n = 12) | BMF content↗ and fat unsaturation index ↘ 1/osteoporotic vs normal 2/osteopenic vs normal 3/osteoporotic vs controls | Age-matched |
| Tang et al, 2010 (55) | 78 postmenopausal women (55–81 years of age) | Vertebral BMF content by MRS Vertebral BMF perfusion Anatomic site: L3 MRI: 1.5 Tesla | Vertebral BMD (DXA) Normal (n = 24), osteopenic (n = 25), and osteoporotic (n = 29) | BMF content↗ and BMF perfusion↘ 1/osteoporotic versus normal 2/osteopenic versus normal | Age-matched |
| Li et al, 2011 (21) | 51 postmenopausal women (54–73 years of age) | Vertebral BMF content by MRS Anatomic site: L1–L4 MRI: 3 Tesla | Vertebral BMD (DXA) Normal (n = 13), osteopenic/osteoporotic (n = 38) | BMF content↗ 1/osteopenic/osteoporotic versus normal | Age and body mass index |
Clinical studies in populations of individuals with metabolic diseases
Annorexia nervosa
Recent studies have shown that BMF is also compromised in AN (59, 60). The most outstanding finding is that, despite a severe depletion of body fat (both VAT and SAT), AN is associated with an increase in BMF content (as measured by MRS) (59, 60).
The effect of calorie restriction on cortical and trabecular bone properties and BMF (MRI at the femurs) was examined during rapid skeletal growth in young mice (C57Bl/6J) 3 weeks of age (61). In mice, at 6 or 12 weeks of age, calorie restriction resulted in higher BMF compared to mice on a normal diet, despite lower percentages of body fat (61). In contrast, calorie restriction was associated with impaired skeletal acquisition in growing mice (61).
This is consistent with adipose tissue abnormalities observed in patients with AN. Indeed, in subjects with AN, despite a severe depletion of body fat, increased BMF content as measured by MRS has been demonstrated (59). Women with AN (n = 10, 29.8 ± 7.6 years) have higher lumbar and femoral BMF content levels than normal-weight age-matched controls (n = 10, 29.2 ± 5.2 years), and BMF content correlates inversely with BMD assessed using DXA after controlling for BMI (59). In a recent study focusing on BMF composition assessed using MRS, similar BMF composition measurements were found in patients with AN (n = 14, age 29.5 ± 1.9 years) compared to 12 age-matched normal-weight controls (60).
The hormonal determinants of BMF in AN have been examined by Fazeli et al (62). Preadipocyte factor 1 is expressed in several progenitor cell types, including human MSCs and preadipocytes, and is positively associated with femoral BMF content in AN (r = 0.50, P = .01) (62). Moreover, Fazeli et al have shown that BMF content and preadipocyte factor 1 levels decrease with recovery from AN (63).
Obesity and weight loss
To the best of our knowledge, no studies have compared BMF content or composition between obese and nonobese participants. We only found one study comparing participants (n = 47) with low- and high-VAT (BMIs of 24.8 ± 5.1 versus 34.4 ± 4.9 kg/m2, respectively) (52). Subjects with high VAT had significantly higher vertebral BMF content than those in the low-VAT group, and there was a positive correlation between vertebral BMF content and VAT that remained significant after controlling for BMD (P = .05) (52).
In a cross-sectional study, 35 obese men (mean age, 33.8 ± 6.4 years; mean BMI, 36.5 ± 5.8 kg/m2) were included to evaluate determinants of bone microarchitecture assessed using high-resolution peripheral QCT of the distal radius (64). Vertebral BMF content by MRS was inversely correlated with cortical vBMD (r = −0.42, P = .02), cortical area (r = −0.45, P = .01), and trabecular thickness (r = −0.38, P = .03), and this remained significant after controlling for lumbar BMD by DXA (P < .04) (64).
Several studies have examined the longitudinal effects of weight loss on BMD in humans and confirmed a reduction in bone mass (65, 66). However, studies on the longitudinal effect of weight loss on BMF in humans are limited and further research is needed in this area (67). In a pilot study of morbidly obese diabetic (n = 6) and nondiabetic women (n = 5) undergoing Roux-en-Y gastric bypass (RYGB) surgery, Schafer et al examined the effects of RYGB on vertebral BMF content using MRS (68). Six months postoperatively, among those without diabetes, BMF was maintained on average after RYGB (+0.9%), despite dramatic declines in overall fat mass. Among those with diabetes, RYGB had significantly reduced BMF content (−7.5%, 95% confidence interval –15.2 to +0.1%, P = .05) (68).
Diabetes
Diabetes is an independent risk factor for fragility fractures at skeletal sites such as the hip, spine, and distal forearm (69–71). BMF may be altered by metabolic conditions, including diabetes. In mice, distinct models of diabetes induction demonstrated similar bone phenotypes marked by significant trabecular bone loss and increased BMF (72).
However, in a study of 13 postmenopausal women with type 2 diabetes mellitus (T2DM) and 13 age- and BMI-matched healthy controls, mean BMF was similar in the diabetic women and healthy controls, whereas mean unsaturated lipid fraction was significantly lower in the diabetic group (25). Similar results were reported by Patsch et al, who found no association between diabetic status and BMF content in a cohort of 69 postmenopausal women (mean age 63 ± 5 years), whereas diabetes was associated with lower unsaturation and higher saturation levels (34). Furthermore, in women with T2DM, higher hemoglobin A1C levels were associated with higher BMF content, suggesting that BMF may influence or may be influenced by glucose metabolism and glycemic control (25).
In subjects with AN, despite a severe depletion of body fat, increased BMF content has been demonstrated, whereas no changes in BMF composition have been observed. The opposite was shown in patients with T2DM: BMF content remained unchanged regardless of diabetic status, but T2DM was associated with lower unsaturation and higher saturation levels. Finally, no studies have been published comparing BMF content or composition between obese and nonobese participants.
BMF and fractures (Table 3)
Cross-Sectional Studies Evaluating the Relationship Between Bone Marrow Fat and Fractures
| Study | Population | Adiposity Measure | Bone Parameters | Results | Adjustment |
|---|---|---|---|---|---|
| Schellinger et al, 2001 (74) | 94 participants (15–87 years of age; 48 men and 46 women) | Vertebral BMF content by MRS Anatomic site: L2 MRI: 3 Tesla | Bone weaknessa 22 subjects with and 72 control subjects without | BMF content↗ With bone weakness versus without | None |
| Patsch et al, 2013 (34) | 69 diabetic and nondiabetic postmenopausal women (with or without fragility fractures) | Vertebral BMF content by MRS Vertebral BMF composition by MRS Anatomic site: L1–L3 MRI: 3 Tesla | Fragility fractures 16 diabetic nonfracture 19 nondiabetic with fractures 17 diabetic with fractures 17 nondiabetic nonfracture | BMF content No association with fractures BMF composition Fragility fractures ↘Fat unsaturation level ↗Fat saturation level | Age, race, and vertebral BMD by QCT |
| Schwartz et al, 2013 (76) | 257 participants (118 men and 139 women) | Vertebral BMF content by MRS Anatomic site: L1–L4 MRI: 1.5 Tesla | Vertebral fractures (VFA by DXA) Clinical fractures Prevalent vertebral fracture (n = 53; 21 men, 32 women) Prevalent clinical fracture (n = 43; 10 men, 33 women) | BMF content Women: No association with vertebral fracture No association with clinical fractures Men: BMF content higher if vertebral fracture No association with clinical fracture | Age and vertebral BMD by QCT Age, BMI, and diabetes Age and vertebral BMD by QCT Age, BMI, and diabetes |
Including prominent Schmorl's nodes, endplate depression, vertebral wedging, and vertebral compression fractures.
Abbreviation: VFA, vertebral fracture assessment.
Limited data are available on the relationship between BMF and fractures. Previous studies have reported an association between prevalent vertebral fractures and higher bone marrow adiposity measured by iliac crest biopsy (17) and BMF content assessed using MRS (39). Some human imaging studies suggest that alterations in BMF assessed using MRS may contribute to “bone weakness” independently of BMD (73, 74). Moreover, bone marrow adiposity parameters measured by iliac crest biopsy (number, size, and volume of adipocytes) were found to be higher in 64 premenopausal women with idiopathic osteoporosis (defined by low-trauma fractures [n = 45] or low BMD [n = 19]) versus 40 controls after adjustment for age and BMI (75).
More recently, in a cohort of older adults, higher BMF content was also associated with prevalent vertebral fractures, whereas no association was found between BMF content and history of clinical fractures (all fractures) or analyses limited to fragility fractures (hip, proximal humerus, and clinical spine) (76). Findings consistent with these results have been reported by Patsch et al (34). In their study, no association was found between fragility fractures and vertebral BMF. However, an association was found with BMF composition (low BMF unsaturation and high BMF saturation levels) independently of age, race, and vBMD.
Radiographic vertebral fractures might be associated with higher BMF content independently of BMD.
BMF variations with osteoporosis treatments
Increased bone marrow adiposity in postmenopausal women might be due, at least in part, to estrogen deficiency (41). Indeed, in a cohort of 29 osteoporotic postmenopausal women, one-year transdermal estrogen therapy resulted in significant decreases in bone marrow adipocyte volume (adipocyte volume/tissue volume in bone biopsy), and prevented the increase in adipocyte number as compared to placebo-treated controls (n = 27) (77). In another bone biopsy study, similar findings (decrease in adipocyte volume/tissue volume and prevention of the increase in adipocyte number) were observed in 24 postmenopausal women after 3 years of risedronate (5 mg/d) compared to placebo (78).
More recently, the influence of early zoledronic acid (ZA) administration on BMF in ovariectomized (OVX) rats has been studied (79). Thirty female Sprague-Dawley rats were randomly divided into sham-operated, OVX + vehicle, and OVX + ZA groups (n = 10/group). After OVX, a single dose of early ZA was enough to reverse marrow adipogenesis (assessed using MRI and bone histomorphometry), which occurs during estrogen deficiency (79). Similar findings on BMF assessed using MRS were observed with an early dose of ZA in the rabbit model of glucocorticoid-induced bone loss (80).
Oxytocin (OT), a neurohypophysial hormone, regulates bone metabolism in animal studies and postmenopausal women. Sixty rabbits were randomly divided into sham-operated, OVX + vehicle (OP [osteoporosis]), and OVX + OT groups (n = 20/group). Twelve weeks after operation, early in vivo OT treatment was found to have slowed down bone deterioration and reduced bone marrow adiposity accumulation (assessed using bone histomorphometry) (81).
BMF and other adipose tissue
More data are needed on the role of BMF in skeletal health and its association with extramedullary adipose tissues such as VAT and SAT (82). Compared with BMF, findings on the associations between VAT and bone are more inconsistent. However, an inverse relationship has been observed between VAT and BMD using direct measurement (computed tomography or MRI), whereas no association, or a negative association, has been observed for SAT (8, 82, 83).
It has been suggested that the role of BMF is distinct from that of VAT and SAT. This hypothesis has been confirmed in patients with AN, in whom an increase in BMF content (assessed using MRS) has been observed, despite a severe depletion of body fat (59). However, recent findings suggest an association between VAT and vertebral BMF in postmenopausal women with a history of diabetes mellitus (25), and in premenopausal women with various BMI (n = 47, 18–41 kg/m2) (52).
Conclusion and Perspectives
Examining and understanding the connection between BMF and bone has recently emerged as an exciting area of research. Findings on the associations are consistent, particularly for BMD assessed using DXA. However, the exact role of BMF in skeletal health, and its association with bone fractures, remains to be determined. Indeed, no prospective studies have assessed the association between BMF and fractures, the most common clinical consequence of osteoporosis. Furthering our understanding of the mechanism of this association could lead to better diagnosis and treatment approaches for osteoporosis. This might be of particular significance in populations of individuals with metabolic diseases (eg, diabetes) and chronic kidney disease (84), in which BMF abnormalities have been demonstrated. In daily practice, the usefulness for clinicians of assessing BMF using MRI is still limited, but perspectives are exciting, particularly in terms of improving the diagnosis and management of osteoporosis.
Acknowledgments
Disclosure Summary: The authors have nothing to disclose.
Abbreviations
- AN
anorexia nervosa
- BMD
bone mineral density
- BMF
bone marrow fat
- BMI
body mass index
- DXA
dual-energy x-ray absorptiometry
- MRI
magnetic resonance imaging
- MRS
magnetic resonance spectroscopy
- MSCs
mesenchymal stem cells
- OVX
ovariectomized
- QCT
quantitative computed tomography
- RYGB
Roux-en-Y gastric bypass
- SAT
subcutaneous adipose tissue
- T2DM
type 2 diabetes mellitus
- VAT
visceral adipose tissue
- vBMD
volumetric bone mineral density
- ZA
zoledronic acid.
