


Exercise increases the risk of hypoglycemia in type 1 diabetes.
Recently we reported a biphasic increase in glucose requirements to maintain euglycemia after late-afternoon exercise, suggesting a unique pattern of delayed risk for nocturnal hypoglycemia. This study examined whether this pattern of glucose requirements occurs if exercise is performed earlier in the day.
Ten adolescents with type 1 diabetes underwent a hyperinsulinemic euglycemic glucose clamp on 2 different occasions during which they either rested or performed 45 minutes of moderate-intensity exercise at midday. Glucose was infused to maintain euglycemia for 17 hours after exercise.
The glucose infusion rate (GIR) to maintain euglycemia, glucose rates of appearance and disappearance, and levels of counterregulatory hormones were compared between conditions.
GIRs to maintain euglycemia were not significantly different between groups at baseline (9.8 ± 1.4 and 9.5 ± 1.6 g/h before the exercise and rest conditions, respectively) and did not change in the rest condition throughout the study. In contrast, GIR increased more than 3-fold during exercise (from 9.8 ± 1.4 to 30.6 ± 4.7 g/h), fell within the first hour of recovery, but remained elevated until 11 hours after exercise before returning to baseline levels.
The pattern of glucose requirements to maintain euglycemia in response to moderate-intensity exercise performed at midday suggests that the risk of exercise-mediated hypoglycemia increases during and for several hours after moderate-intensity exercise, with no evidence of a biphasic pattern of postexercise risk of hypoglycemia.
Participation in regular physical activity is recommended for individuals with type 1 diabetes mellitus (T1DM) because of its many health benefits (1–3). Unfortunately, exercise increases the risk of hypoglycemia and associated adverse outcomes including seizures, coma, and irreversible brain dysfunction and damage (4, 5). A further complication of exercise-mediated hypoglycemia is that this risk occurs not only during exercise but also for up to 31 hours after exercise (6, 7). This late-onset postexercise hypoglycemia (LOPEH) is particularly concerning during nighttime because there is a significantly higher incidence of overnight hypoglycemia after 75 minutes of afternoon exercise (26%) compared with afternoon rest (6%; P < .05) (8). Furthermore, the use of continuous glucose-monitoring technology reveals that this high risk for nocturnal hypoglycemia after exercise may be related to the intensity of exercise (9).
The mechanisms underlying LOPEH are multifactorial and include impaired counterregulation after exercise (6, 10) that may be further compromised during sleep (11) as well as an increase in glucose uptake by skeletal muscle to replenish glycogen stores and a rise in insulin sensitivity (6, 12). These latter 2 factors contribute to increasing the risk of LOPEH by increasing the amount of exogenous glucose required to maintain euglycemia.
Previously we have shown that the exogenous glucose requirements to maintain euglycemia in individuals with T1DM increase during and shortly after afternoon exercise and again early during nighttime (7–11 hours postexercise) but with no increase in glucose requirements during the 2- to 7-hour recovery period (7). This biphasic response in glucose requirements suggests a unique pattern of delayed risk for nocturnal hypoglycemia. It is not clear, however, whether the increase in glucose requirements at night is related to sleep and whether this would occur if exercise was performed earlier in the day. This information is important for the design of guidelines aimed at helping people with T1DM to enjoy the benefits of regular physical activity without the concern of hypoglycemia. For this reason, the aim of this study was to determine the effect of midday moderate-intensity exercise on the pattern of postexercise exogenous glucose requirements in individuals with T1DM.
Materials and Methods
Participants
Ten adolescents (9 males, 1 female) aged 15.9 ± 1.1 (mean ± SD), with a duration of clinically diagnosed T1DM of 6.3 ± 3.5 years, glycated hemoglobin of 8.4 ± 2.1%, body mass index of 22.2 ± 3.2 kg/m2, and V̇O2peak of 43.3 ± 7.3 mL · kg−1 · min−1 were recruited to this study. All participants were free from diabetes complications, had undetectable levels of c-peptide, and were hypoglycemia aware. The participants were not taking any medications other than insulin, and their insulin regimens were stable prior to the study. The study was approved by the Princess Margaret Hospital Ethics Committee, and informed consent was obtained from the participants prior to their involvement.
Experimental procedures
After a familiarization session during which the anthropometric measures, V̇O2peak, and lactate threshold were determined as described previously (7), the participants attended the laboratory on 2 further occasions during which they performed either 45 minutes of moderate-intensity exercise or rest. All participants completed both conditions following a randomized, counterbalanced study design, with the female participant studied in the follicular phase of her menstrual cycle. Testing was rescheduled if the participants experienced an episode of hypoglycemia 48 hours prior to each study, and they were required to abstain from any physical activity other than light walking 24 hours before each study because both antecedent hypoglycemia (13) and antecedent exercise (10) reduce key glucoregulatory responses to subsequent moderate-intensity exercise. To ensure that the diet was matched between studies, the participants were required to keep a food diary for 24 hours prior to their first study and then match their food intake the day before their second study.
On the morning of the testing, each participant arrived in the laboratory at 7:00 am at which time a cannula was inserted into a vein in the dorsum of one hand for sampling blood. This hand was placed in a HotBox (Omega CN370, Sydney, Australia) at approximately 60°C to arterialize venous blood prior to sampling. Another cannula was inserted into a vein in the contralateral antecubital fossa for infusion of glucose and insulin. Insulin was infused at a constant rate and at a dose based on 50% of the participants usual daily dose to match the conditions adopted by MacMahon et al (7). Blood glucose level was maintained at 5–6 mmol/L for the duration of the studies by varying the infusion rate of a 20% (wt/vol) dextrose solution. The adjustments to the infusion rate of dextrose were guided by blood glucose measurements obtained every 15 minutes. At 8:00 am, each participant was provided with a standardized breakfast and given a bolus of iv insulin based on the amount of carbohydrates consumed. The participants fasted for the remainder of the study. At approximately 9:00 am, a blood sample was drawn for the determination of background enrichment of [6,6-2H]glucose. Thereafter the infusion of [6,6-2H]glucose commenced with a priming bolus of 3 mg/kg and a constant infusion of 2.4 mg · kg−1 · h−1 that continued for the duration of the experiment to measure glucose rate of appearance (Ra) and disappearance (Rd). In addition, the variable infusion of dextrose was spiked with [6,6-2H]glucose (2.48 mg/mL) to minimize the changes in the isotopic enrichment of plasma glucose in response to adjustments in dextrose infusion rate to maintain euglycemia (14). The infusion of [6,6-2H]glucose continued for at least 150 minutes prior to the commencement of exercise. After this, blood samples were collected for baseline measurements of glucoregulatory hormones, metabolites, and [6,6-2H]glucose enrichment.
At approximately 12:00 pm, the participants either exercised for 45 minutes on a cycle ergometer (Repco, Melbourne, Australia) at 95% of their lactate threshold (corresponding to 63.6 ± 10.6% V̇O2peak) to match the conditions adopted by MacMahon et al (7) or sat on the ergometer without pedaling. During exercise, the constant rate of [6,6-2H]glucose infusion was doubled to prevent large changes in isotopic enrichment (15, 16). Throughout the recovery, the participants rested in a seated position. The rate of O2 consumption and CO2 production were determined from expired air samples collected at various stages of testing using a mask during exercise and a canopy after exercise connected to an indirect calorimetry system (VMax Spectra; SensorMedics Corp, Yorba Linda, California). Carbohydrate oxidation rates were calculated using the nonprotein respiratory quotient according to the equation 4.585 V̇CO2 − 3.226 V̇O2 (17). To calculate the additional glucose requirements to maintain euglycemia during exercise, the difference in glucose infusion rates between the exercise and rest conditions were determined, and the area under the curve was analyzed. Blood samples for the measurement of hormones, metabolites, and [6,6-2H]glucose enrichment were obtained at 15-minute intervals during exercise (or rest) and every 2 hours during recovery until 6:00 am the following morning.
Measurement of glucoregulatory hormones and [6,6-2H]glucose enrichment
Arterialized venous blood samples were analyzed for glucose using a YSI analyzer (Yellow Springs Instrument, Yellow Springs, Ohio), and free insulin, glucagon, free fatty acids, cortisol, and GH were measured as previously described (18). Epinephrine and norepinephrine levels were determined in heparinized plasma samples treated with sodium metabisulphite using a BI-CAT ELISA kit (DLD Diagnostika, Hamburg, Germany). Isotopic enrichment was determined by gas chromatography-mass spectrometry (Bioanalytical Mass Spectrometry Facility, Sydney, Australia). The readings obtained were corrected for background enrichment of naturally occurring [6,6-2H]glucose and glucose Ra and Rd were estimated using the single-compartment, fixed-volume model proposed by Steele et al (19) and modified by Finegood et al (14) to account for the infusion of exogenous glucose. Only glucose Ra and Rd measured during recovery are shown here because glucose enrichment was not stable prior to exercise.
Statistical analyses
Data were analyzed using a 2-way repeated-measures ANOVA and a Fisher's least significant difference test for a posteriori analysis using SPSS 17.0 software (Chicago, Illinois). Statistical significance was accepted at P < .05. Unless otherwise stated, all results are expressed as mean ± SEM.
Results
There were no differences in blood glucose or plasma insulin levels between the exercise and rest conditions at any time point (Figure 1, A and B). Before exercise and rest, blood glucose levels were 5.54 ± 0.20 and 5.50 ± 0.18 mmol/L (P = .39), respectively, and did not change during either condition. Similarly, plasma insulin levels were 125.9 ± 32.5 and 129.8 ± 20.6 pmol/L (P = .89) before the exercise and rest conditions, respectively, and did not change during or after exercise or rest.
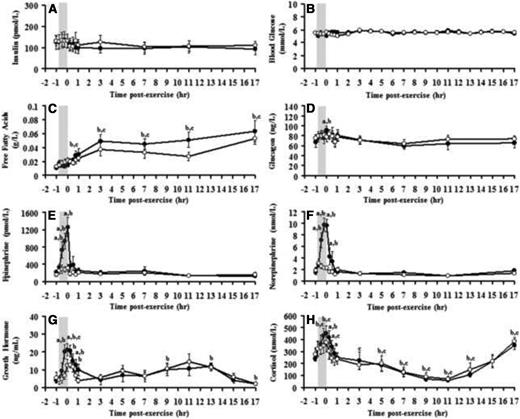
Responses of plasma free insulin (A), blood glucose (B), plasma free fatty acids (C), plasma glucagon (D), epinephrine (E), norepinephrine (F), serum GH (G), and serum cortisol levels (H) to exercise (closed circles) and rest (open circles). Shaded box, Exercise period. a, Significant difference between exercise and rest conditions; b, significant difference compared with baseline (exercise); c, significant difference compared with baseline (rest), P < .05.
In response to exercise, glucagon, epinephrine, norepinephrine, GH, and cortisol increased above baseline levels and returned to preexercise levels during early recovery (Figure 1, D–H). Later during recovery, cortisol levels increased to above baseline levels. Free fatty acid levels steadily increased after exercise, reaching a peak after 3 hours of recovery from exercise (Figure 1C). However, there were no differences in the levels of any of counterregulatory hormones measured here or free fatty acids between exercise and rest conditions from the first hour of recovery until 17 hours of recovery (Figure 1, C–H).
The glucose infusion rate (GIR) to maintain stable blood glucose levels was not different between groups at baseline (9.8 ± 1.4 and 9.5 ± 1.6 g/h before the exercise and rest conditions, respectively; P = .46) and did not change in the rest condition for the duration of the study. In contrast, GIR increased more than 3-fold during exercise (from 9.8 ± 1.4 to 30.6 ± 4.7 g/h; P = .00), fell within the first hour of recovery to a level above baseline (14.9 ± 1.3 g/h; P = .00), and remained elevated until 11 hours after the exercise before returning to baseline levels (Figure 2A and Table 1). During this period, an additional 56.6 g of glucose was infused to maintain euglycemia in the exercise compared with the rest condition.
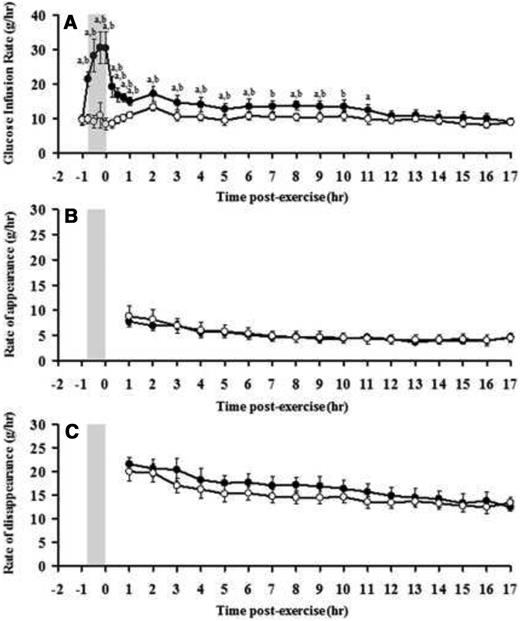
Responses of GIR (A), endogenous glucose Ra (B), and glucose Rd (C) to exercise (closed circles) and rest (open circles). Shaded box, Exercise period. a, Significant difference between exercise and rest conditions; b, significant difference compared with baseline levels (exercise), P < .05.
Glucose Infusion Rates Necessary to Maintain Euglycemia Before, During, and After Exercise and Rest
| Time | GIR Exercise Condition, g/h | GIR Rest Condition, g/h | Difference in GIR Between Conditions | P Value |
|---|---|---|---|---|
| Before exercise | 9.8 ± 1.4 | 9.5 ± 1.6 | 0.2 ± 2.3 | .46 |
| End of exercise | 30.6 ± 4.7 | 10.9 ± 3.7 | 20.7 ± 7.2 | .02 |
| 1 hour after exercise | 14.9 ± 1.3 | 10.9 ± 0.9 | 5.1 ± 1.8 | .02 |
| 3 hours after exercise | 14.6 ± 2.2 | 10.5 ± 1.3 | 4.1 ± 2.1 | .04 |
| 5 hours after exercise | 12.8 ± 1.6 | 9.4 ± 1.5 | 3.4 ± 1.7 | .03 |
| 7 hours after exercise | 13.5 ± 1.6 | 10.5 ± 1.0 | 2.9 ± 1.8 | .06 |
| 9 hours after exercise | 13.4 ± 1.8 | 10.4 ± 1.3 | 3.1 ± 1.8 | .05 |
| 11 hours after exercise | 12.4 ± 1.7 | 9.7 ± 1.5 | 2.7 ± 1.5 | .05 |
| 13 hours after exercise | 10.8 ± 1.5 | 9.8 ± 0.8 | 1.1 ± 1.3 | .21 |
| 15 hours after exercise | 10.2 ± 1.6 | 8.4 ± 0.9 | 1.8 ± 1.3 | .09 |
| 17 hours after exercise | 9.0 ± 1.0 | 8.9 ± 0.7 | 0 ± 1.5 | .31 |
From 1 hour of recovery until 17 hours of recovery, there was no difference in glucose Ra between exercise and rest conditions (Figure 2B and Table 2). Similarly, there was no difference in glucose Rd during this period between exercise and rest conditions (Figure 2C and Table 2).
Glucose Rates of Appearance and Disappearance After Exercise and Rest
| Time | Exercise Condition | Rest Condition | P Value | |||
|---|---|---|---|---|---|---|
| Ra, g/h | Rd, g/h | Ra, g/h | Rd, g/h | Ra | Rd | |
| 1 hour after exercise | 7.8 ± 0.7 | 21.6 ± 1.3 | 8.8 ± 2.1 | 20.0 ± 2.1 | .30 | .19 |
| 3 hours after exercise | 7.0 ± 0.8 | 20.4 ± 2.4 | 6.9 ± 1.5 | 17.0 ± 1.6 | .49 | .13 |
| 5 hours after exercise | 5.6 ± 0.7 | 17.5 ± 1.7 | 5.8 ± 1.3 | 15.3 ± 1.8 | .44 | .19 |
| 7 hours after exercise | 4.6 ± 0.5 | 17.0 ± 2.0 | 4.9 ± 1.0 | 14.7 ± 1.4 | .39 | .16 |
| 9 hours after exercise | 4.2 ± 0.4 | 16.8 ± 2.1 | 4.7 ± 1.1 | 14.5 ± 1.4 | .35 | .17 |
| 11 hours after exercise | 4.7 ± 0.4 | 15.7 ± 1.8 | 4.3 ± 1.0 | 13.5 ± 1.3 | .37 | .17 |
| 13 hours after exercise | 3.7 ± 0.4 | 14.5 ± 1.8 | 4.2 ± 1.0 | 13.6 ± 1.3 | .32 | .34 |
| 15 hours after exercise | 3.8 ± 0.5 | 13.3 ± 1.9 | 4.3 ± 1.0 | 12.7 ± 1.3 | .36 | .38 |
| 17 hours after exercise | 4.7 ± 0.7 | 12.4 ± 0.8 | 4.5 ± 0.8 | 13.3 ± 1.3 | .46 | .22 |
Before exercise, the rates of carbohydrate oxidation were similar between the exercise and rest conditions (13.9 ± 0.75 and 11.4 ± 0.74 g/h, respectively; P = .00). During exercise, the absolute rate of carbohydrate oxidation increased compared with rest (127.4 ± 7.7 vs 13.4 ± 1.7 g/h, respectively; P = .00), equating to 95.5 g and 10.1 g of carbohydrate oxidized during exercise and rest treatments, respectively.
Discussion
This study shows that in response to moderate-intensity exercise performed close to midday, the exogenous glucose requirements to maintain euglycemia increase during exercise and remain elevated for 11 hours after exercise in adolescents with T1DM. This finding thus suggests that the risk of exercise-mediated hypoglycemia increases during and for several hours after moderate-intensity exercise, with no evidence of a biphasic pattern of postexercise risk of hypoglycemia when exercise is performed at midday.
Previously we have shown that the glucose requirements to maintain euglycemia increase during and shortly after late-afternoon exercise and again from 7 to 11 hours after exercise (7), with no extra glucose required during the 2- to 7-hour recovery period. Such a biphasic response was not observed here because our results show that, after midday exercise, the glucose requirements to maintain euglycemia remain significantly elevated above resting levels for up to 11 hours after exercise. This was the case despite the fact that plasma insulin levels and exercise conditions were matched between studies. Our findings thus suggest not only that the risk of LOPEH is elevated for the first 11 hours after midday moderate-intensity exercise, as mentioned earlier, but also that midday exercise does not increase the risk of hypoglycemia during the night. What remains to be determined, however, are the mechanisms underlying the different patterns of glucose requirements to maintain euglycemia between this study and that of MacMahon et al (7). This task is a particularly challenging one, given that the biphasic response reported by MacMahon et al (7) remains to be explained.
The sustained increase in glucose requirements during the first 11 hours of recovery is likely to be explained by the trend for higher glucose Rd during recovery from exercise compared with the rest condition. Indeed, although glucose Rd did not differ statistically between experimental groups, there was a trend (P < .13-.19) for glucose Rd to be higher for up to 11 hours during recovery from exercise compared with rest. In contrast, there were no differences in glucose Ra after the exercise and rest conditions. These findings suggest that an increase in peripheral glucose use contributes to the increase in glucose requirements after exercise and the associated risk of postexercise hypoglycemia.
It is likely that the sustained increase in GIR above baseline after exercise serves to replenish muscle and hepatic glycogen stores. In support of this view, others have reported that increases in insulin sensitivity and the rate of muscle glucose uptake are favorable to the replenishment of muscle glycogen stores after prolonged moderate-intensity exercise (12, 20). This is likely to be the case here as suggested by the following calculations. Assuming that all of the glucose infused during exercise was oxidized, one can estimate based on our indirect calorimetry data that 74.3 g of muscle/hepatic glycogen was oxidized during that time. During the first 11 hours of recovery, the difference between whole-body carbohydrate oxidation (112.9 g per 11 hours) and total amount of glucose infused to maintain euglycemia (158.6 g per 11 hours) provides an estimate of the amount of glycogen deposited during that time, which here corresponds to 45.7 g of glycogen. These findings thus indicate that approximately 30% of the glucose required to maintain euglycemia during the first 11 hours of recovery is used to replenish muscle glycogen stores. However, the amount of glycogen thus replenished is insufficient to replace all the glycogen used during exercise because it accounts for approximately 60% of the glycogen oxidized during that time.
The observation that there were no differences in glucose Ra during recovery from exercise and rest is consistent with the absence of significant differences in the levels of the glucoregulatory hormones between conditions. Because insulin, glucagon, epinephrine, norepinephrine, GH, and cortisol have acute and chronic stimulatory effects on hepatic glucose production (21), the absence of differences in the levels of these hormones between exercise and rest conditions would be expected to result in similar glucose Ra between conditions. Our findings also suggest that the sensitivity of glucose Ra to insulin is not affected by exercise, as shown by others (22, 23). It is important to note that although changes from baseline levels of GH and cortisol were observed, these responses were consistent with normal diurnal variations in the levels of these hormones (24, 25).
Importantly, there are limitations with our findings that limit their translation to clinical practice. First, because the amount of glucose required to prevent hypoglycemia depends on insulin concentrations (26) and the participants in this study performed exercise at insulin levels moderately above their basal insulin requirements, it follows that our results cannot be used to estimate the extra glucose required to prevent hypoglycemia in individuals exposed to different insulin levels. This is an important limitation, given that many people may exercise when they are relatively hyperinsulinemic (27). Furthermore, it remains to be determined whether the amount of exogenous glucose required to prevent exercise-mediated hypoglycemia differs, depending on whether glucose is ingested rather than infused, because factors related to the gastrointestinal absorption rate and food composition may become important confounding variables. Another limitation relates to the duration of the period of increased hypoglycemia risk after exercise determined here because it applies only to circumstances during which no carbohydrate-rich meal is consumed after exercise. Because most individuals are likely to consume a meal within the first 11 hours of recovery from exercise, it follows that the duration of the postexercise increased risk of hypoglycemia would be expected to be less than reported here. Also, because our findings relate only to a fixed period of aerobic exercise, they do not exclude the possibility that factors such as the intensity and duration of exercise (28, 29) may contribute to differences in postexercise glucose requirements to maintain euglycemia and the associated risk of postexercise hypoglycemia. Finally, because the participants in this study were mostly male, it is possible that these results may have been affected by a sex bias.
Although measuring the amount of extra glucose required to maintain euglycemia during and after exercise provides a valuable approach to indirectly determine the risk of exercise-mediated hypoglycemia, it is important to note that this approach represents only a partial evaluation of this risk. This is because the absence of a difference in GIR between experimental conditions does not exclude the possibility that the counterregulatory response to hypoglycemia is differentially affected by these conditions. Indeed, moderate-intensity exercise has been shown to reduce the counterregulatory responses to a subsequent episode of hypoglycemia (30–32), thus increasing the risk of hypoglycemia when blood glucose levels are falling after exercise.
In conclusion, the pattern of glucose requirements to maintain euglycemia in response to moderate-intensity exercise performed at midday suggests that the risk of exercise-mediated hypoglycemia increases during and for several hours after moderate-intensity exercise, with no evidence of a biphasic pattern of postexercise risk of hypoglycemia as opposed to what has been reported when exercise is performed late in the afternoon. Whether these differences relate to the diurnal pattern of change in counterregulatory hormones such as cortisol and GH or other factors remains to be determined. On clinical grounds, our results also suggest that the time of day when exercise is performed may be an important factor affecting the risk of postexercise hypoglycemia during sleep, with midday and late afternoon exercise increasing the risk of hypoglycemia in the evening and after midnight, respectively. Strategies to reduce this risk, such as increasing carbohydrate intake or reducing insulin doses after moderate-intensity exercise, may be indicated, but it is important to note that the extent of these adjustments remains unclear. The effect of exercise intensity (eg, anaerobic exercise) and exercise duration on postexercise glucose requirements and the risk of postexercise hypoglycemia in T1DM patients are also important avenues for future research.
Acknowledgments
We thank the National Health and Medical Research of Australia for their support. The mass spectrometric analysis for this work was carried out at the Bioanalytical Mass Spectrometry Facility, Univeristy of New South Wales. The Bioanalytical Mass Spectrometry Facility, University of New South Wales, was supported in part by infrastructure funding from the New South Wales Government as part of its coinvestment in the National Collaborative Research Infrastructure Strategy.
This study was funded by a National Health and Medical Research Council of Australia program grant.
Disclosure Summary: The authors have nothing to disclose.
Abbreviations
- GIR
glucose infusion rate
- LOPEH
late-onset postexercise hypoglycemia
- Ra
rate of glucose appearance
- Rd
rate of glucose disappearance
- T1DM
type 1 diabetes mellitus.
