


Abstract
Background: Low plasma concentration of high-density lipoprotein (HDL) cholesterol is a risk factor for cardiovascular disease and a feature of the metabolic syndrome. Rosuvastatin has been shown to increase HDL cholesterol concentration, but the mechanisms remain unclear.
Methods and Results: Twelve men with the metabolic syndrome were studied in a randomized, double-blind, crossover trial of 5-wk therapeutic periods with placebo, 10 mg/d rosuvastatin, or 40 mg/d rosuvastatin, with 2-wk placebo washout between each period. Compared with placebo, there was a significant dose-dependent increase in HDL cholesterol, HDL particle size, and concentration of HDL particles that contain apolipoprotein A-I (LpA-I). The increase in LpA-I concentration was associated with significant dose-dependent reductions in triglyceride concentration and LpA-I fractional catabolic rate, with no changes in LpA-I production rate. There was a significant dose-dependent reduction in the fractional catabolic rate of HDL particles containing both apolipoprotein A-I and A-II (LpA-I:A-II), with concomitant reduction in LpA-I:A-II production rate, and hence no change in LpA-I:A-II concentration.
Conclusions: Rosuvastatin dose-dependently increased plasma HDL cholesterol and LpA-I concentrations in the metabolic syndrome. This could relate to reduction in plasma triglycerides with remodeling of HDL particles and reduction in LpA-I fractional catabolism. The findings contribute to understanding mechanisms for the HDL-raising effect of rosuvastatin in the metabolic syndrome with implications for reduction in cardiovascular disease.
Epidemiological data have established low plasma high-density lipoprotein (HDL) cholesterol level as a major risk factor for cardiovascular disease (CVD) (1). Low HDL cholesterol together with raised triglyceride levels is an atherogenic lipid profile frequently associated with the metabolic syndrome (2). The number of HDL particles in circulation is reflected in part by the concentration of its principal apolipoprotein (apo), apoA-I. Recent evidence suggests that apoA-I may be a better marker for CVD risk than traditional HDL cholesterol measures (3). Furthermore, the ratio of apoB to apoA-I, reflecting the balance between atherogenic and nonatherogenic lipoprotein particles, is directly related to the components of the metabolic syndrome and is a powerful, independent predictor of CVD risk (4). Hence, a better understanding of the pathophysiology of HDL and its associated apolipoproteins would benefit the development of new lipid-regulating therapies.
HDL particles are heterogeneous and according to their apolipoprotein content may be separated into HDL particles that contain apoA-I (LpA-I) and HDL particles that contain both apoA-I and apoA-II (LpA-I:A-II) (5). Several studies support the observation that the larger LpA-I are more effective in promoting in vitro cellular cholesterol efflux (6–8). Subjects with CVD have also been shown to have lower LpA-I level compared with healthy individuals (9, 10). However, it remains controversial as to which subpopulation contributes to the antiatherogenic effects of HDL.
Statins inhibit 3-hydroxy-3-methylglutaryl coenzyme A (HMG CoA) reductase, a rate-limiting enzyme in cholesterol biosynthesis (11). Although their principal action is to reduce plasma concentrations of apoB-containing lipoproteins, statins have a modest HDL-raising effect (12). This may be related to a decreased lipid exchange between HDL and apoB-containing lipoproteins, in part due to reduced cholesterol ester transfer protein (CETP) activity consequent on lower plasma CETP mass and reduction in acceptor particles [very-low-density lipoproteins (VLDL) and chylomicrons]. Statins may also activate the peroxisome proliferator-activated receptor-α pathway via inhibition of rho-signaling, thereby increasing apoA-I expression (13).
Rosuvastatin is an effective, hydrophilic statin shown to have a greater HDL cholesterol-raising effect than other statins. In a dose range between 10 and 40 mg daily, rosuvastatin has been shown in several clinical trials to result in a graded reduction in plasma low-density lipoprotein (LDL) cholesterol and triglycerides, with a consistent increase in HDL cholesterol (14, 15). We recently report that rosuvastatin dose-dependently decreased the concentrations of apoB-containing lipoproteins by increasing their rates of catabolism in the metabolic syndrome (16).
The primary objective of this study was to investigate the dose-related effect of treatment with rosuvastatin on HDL metabolism in the metabolic syndrome. We hypothesized that a higher dose of rosuvastatin would increase HDL cholesterol concentration by a mechanism that primarily involves reduction in the catabolism of apoA-I and apoA-II.
Subjects and Methods
Subjects
Twelve men with the metabolic syndrome by the National Cholesterol Education Program Adult Treatment Panel III definition (17). Upper limits for HDL cholesterol of no more than 47 mg/dl (1.2 mmol/liter), LDL cholesterol no more 230 mg/dl (6 mmol/liter), and triglycerides no more than 400 mg/dl (4.5 mmol/liter) were stipulated to exclude subjects with genetic hyperlipidemia, including familial hypercholesterolemia and familial hypertriglyceridemia, and other secondary causes of severe dyslipidemia. Subjects with diabetes mellitus [fasting glucose > 126 mg/dl (7 mmol/liter)], CVD, renal dysfunction [macroproteinuria and/or serum creatinine > 1.7 mg/dl (150 μmol/liter)], hypothyroidism, abnormal liver or muscle enzymes, alcohol consumption of more than 30 g alcohol/d, and use of lipid-modifying agents were excluded. Subjects with the apoE2/E2 genotype were also excluded because of the known effects of this genotype on apoB metabolism and its potential to impact HDL metabolism. All were nonsmokers and were consuming ad libitum weight-maintenance diets. Participants provided informed written consent, and the study was approved by the Ethics Committee of Royal Perth Hospital.
Study design and clinical protocols
This was a randomized, double-blind, placebo-controlled, three-way crossover trial. Eligible subjects entered a 4-wk weight-maintenance, placebo run-in period followed by randomization to a 5-wk treatment period of either 10 mg rosuvastatin (R10) or 40 mg rosuvastatin (R40) or matching placebo taken orally at night, with crossover to two more 5-wk treatment periods interspersed by 2-wk washouts. Rosuvastatin was provided by AstraZeneca Pty. Ltd., London, UK. Advice was given to continue on isocaloric diets and maintain physical activity constant during the study. Compliance with rosuvastatin or placebo was assessed by tablet count.
All subjects were admitted to the metabolic ward in the morning after a minimum of 12 h fasting. They were studied semirecumbent and allowed water only for the initial 10 h of the study. Venous blood was collected for biochemical measurements. Body weight and height were measured and arterial blood pressure recorded using a Dinamap1846 SX/P monitor (Critikon, Tampa, FL). Dietary intake was assessed using 24-h dietary diaries and DIET 4 Nutrient Calculation Software (Xyris Software, Highgate Hill, Queensland, Australia).
A single bolus of D3-leucine (5 mg/kg) was administered iv within a 2-min period into an antecubital vein via a Teflon cannula. Blood samples were taken at baseline and at 5, 10, 20, 30, and 40 min and 1, 1.5, 2, 2.5, 3, 4, 5, 6, 8, and 10 h after isotope injection. Additional blood samples were collected in the morning on the four following days (24, 48, 72, and 96 h) after a minimum 12-h fast. All the procedures were repeated at the end of each treatment period.
Isolation and measurement of isotopic enrichment of apoA-I and apoA-II
ApoB-containing lipoproteins were precipitated from plasma and HDL isolated by ultracentrifugation (Optima XL-100K; Beckman Coulter, Fullerton, Australia) as previously described (18). ApoA-I and apoA-II were isolated from HDL by PAGE and blotted onto polyvinylidene difluoride membrane; apoA-I and apoA-II bands were excised from the membrane, hydrolyzed with 6 m HCl at 110 C for 16 h, and dried for derivatization by an oxazolinone method. Plasma free leucine was isolated by cation-exchange chromatography and isotopic enrichment determined using gas chromatography-mass spectrometry with selected ion monitoring of samples at a mass-to-charge ratio (m/z) of 212 and 209 and negative ion chemical ionization. Tracer-to-tracee ratios were derived from isotopic ratios of each sample.
Quantification of apoA-I, apoA-II, and apoA-I in LpA-I and LpA-I:A-II
Plasma total apoA-I and apoA-II concentrations were determined by immunonephelometry (Dade Behring, Deerfield, IL). The ratio of HDL cholesterol to apoA-I and apoA-II was used as an estimate of HDL particle size. LpA-I concentration was measured by differential electroimmunoassay (Sebia, Moulineaux, France), with an interassay coefficient of variation (CV) of less than 5%. The apoA-I content in LpA-I:A-II concentration was calculated as total plasma apoA-I minus LpA-I (6, 19, 20).
Biochemical analyses
Plasma total cholesterol, triglyceride, and HDL cholesterol concentrations were determined by standard enzymatic methods (Hitachi, Tokyo, Japan; Roche Diagnostic GmbH, Mannheim, Germany) and LDL cholesterol by Friedewald calculation. Insulin was measured by a solid phase 2 site sequential chemiluminescent immunometric assay (Diagnostic Products Corp., Los Angeles, CA) and glucose by hexokinase method (Hitachi, Tokyo, Japan). Insulin resistance was estimated using HOMA score (21). Lathosterol concentration was assayed using gas chromatography-mass spectrometry. ApoE was genotyped by the modified method of Hixson and Vernier (44). Liver (alanine transferase, aspartate transferase, and alkaline phosphatase) and muscle (creatinine kinase) enzymes were analyzed during each treatment period (Hitachi).
Plasma lecithin cholesteryl acyl transferase (LCAT) mass was measured by an ELISA (Daiichi Pure Chemicals Co., Tokyo, Japan). Cholesterol esterification rate was assessed by the ability of plasma to esterify [14C]cholesterol. In brief, 100-μl aliquots of plasma were equilibrated with [14C]cholesterol-albumin complex for 4 h at 4 C to label free cholesterol and then incubated for 30 min at 37 C for esterification of cholesterol. This method uses endogenous substrate, thus reflecting the contribution of differences in LCAT activity toward different lipoprotein subfractions. Plasma CETP mass was measured by ELISA kit (Daiichi Pure Chemicals). CETP activity was measured using a fluorometric assay (Roar Biochemical, New York, NY) (22), with a coefficient of variation of less than 10% for all assays.
Kinetic analyses
Figure 1 shows the compartment model developed using the SAAM II program (SAAM Institute, Seattle, WA) and used to describe HDL apoA-I and apoA-II leucine tracer-tracee ratio data (23). This model had been previously validated in a separate study (23). Compartments 1–4 are required to describe leucine tracer kinetics observed in plasma. Compartment 1 is connected to compartments 5 and 6, compartments that account for the synthesis and secretion of apoA-I and apoA-II into plasma; compartments 7 and 8 represent apoA-I associated with the LpA-I and LpA-I:A-II particles, respectively; compartment 9 describes the plasma kinetics of HDL apoA-II. The turnover for delay in compartment 6 (mean ± sem; apoA-1, 0.61 ± 0.07 h; apoA-II, 0.53 ± 0.1 h) was shorter than compartment 5 (mean ± sem; apoA-I, 3.62 ± 0.42 h; apoA-II, 2.52 ± 0.26 h); however, this did not have implications on kinetic parameter estimations, nor was there any effect of treatment on these delay times. An assumption implicit in this model is that the fractional catabolic rate (FCR) of apoA-I in the LpA-I:A-II particle (compartment 8) is the same as that of apoA-II (compartment 9) (19, 24). The model also assumes that LpA-I:A-II particles are removed intact and that apoA-I is not recycled.
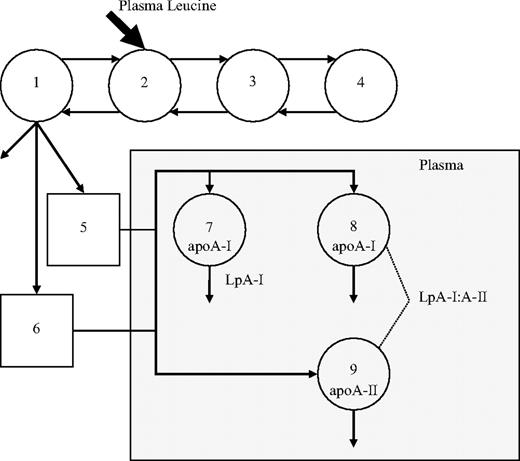
Compartment model describing apoA-I in LpA-I and LpA-I:A-II particles and apoA-II and apoA-I tracer kinetics. Leucine tracer is injected into plasma, compartment 2, and distributes to extravascular compartments 1, 3, and 4. Compartments 1–4 are required to describe leucine tracer kinetics observed in plasma. Compartment 1 is connected to two intracellular delay compartments (compartments 5 and 6) that account for the synthesis, assembly, and secretion of apoA-I and apoA-II. Compartments 7 and 8 describe the plasma kinetics of HDL apoA-I associated with LpA-I and LpA-I:A-II particles, respectively. Plasma kinetics of HDL apoA-II, which represents the apoA-II component of LpA-I:A-II, is described by compartment 9.
The FCR of apoA-I in LpA-I and LpA-I:A-II, apoA-I and apoA-II were estimated after simultaneously fitting the model to the apoA-I and apoA-II tracer/tracee ratio and LpA-I and LpA-I:A-II mass data. The corresponding production rates (PRs) were calculated as the product of FCR and pool size, pool size being the product of concentration and plasma volume. Plasma volume was estimated as 4.5% of body weight, with adjustment made to account for a decrease in relative plasma volume with body weights in the obese range. In the present study, the kinetics of LpA-I and LpA-I:A-II were employed to describe the kinetics of apoA-I in LpA-I and LpA-I:A-II particles, respectively.
Statistical analyses
Skewed variables were logarithmically transformed where appropriate. Data at the end of the three treatment periods were compared using a mixed-effect model (SAS Proc Mixed, SAS Institute), which also tested and excluded carryover and time-dependent effects. A mixed-effect model was also used to examine the dose-related effect of rosuvastatin on the outcome variables. The P values are reported, with statistical significance set at the 5% level. Statistical associations between changes in HDL particle kinetic parameters with changes in LDL-apoB FCR and other study variables were also examined on both doses of rosuvastatin using simple linear regression method.
Results
The 12 subjects recruited were (mean ± sd) middle-aged (48.6 ± 8.5 yr), centrally obese (body mass index 33.6 ± 4.9 kg/m2, waist circumference 114.0 ± 12.5 cm), normotensive (131.9 ± 8.4, 79.6 ± 6.6 mm Hg), dyslipidemic [total cholesterol, 220 ± 29 mg/dl (5.65 ± 0.75 mmol/liter), triglycerides 202 ± 66 mg/dl (2.23 ± 0.74 mmol/liter), HDL cholesterol 38 ± 4 mg/dl (0.98 ± 0.11 mmol/liter)], normoglycemic [91 ± 11 mg/dl (5.06 ± 0.63 mmol/liter)] and insulin resistant (HOMA score 3.41 ± 1.48). Individual subject characteristics at baseline are detailed in Supplemental Table 1 (published as supplemental data on The Endocrine Society’s Journals Online web site at http://jcem.endojournals.org). There were no significant treatment effects on body weight, blood pressure, insulin, glucose, fatty acids, and HOMA score. Both R10 and R40 were well tolerated. There were no significant changes in liver and muscle enzymes or serum creatinine, and no subjects developed dip-stick-positive proteinuria. Mean daily dietary intake was as follows: energy, 10,245 ± 575 kJ; total fat, 90.9 ± 6.3 g; total carbohydrate, 256 ± 15 g; protein, 123 ± 7 g; cholesterol, 385 ± 46 mg; and alcohol, 6.5 ± 2.9 g. Dietary intake did not differ significantly between treatment phases.
Compared with placebo, both doses of rosuvastatin lowered plasma concentrations of total cholesterol (R10, −34%; R40, −42%), triglycerides (R10, −24%; R40, −42%), LDL cholesterol (R10, −49%; R40, −57%), apoB (R10, −38%; R40, −46%), and apoB/apoA-I ratio (R10, −40%; R40, −47%) and increased HDL cholesterol concentration (R10, +4.4%; R40, +10%) and estimated HDL particle size (R10, +3.1%; R40, +8.2%) (Table 1). Individual lipid measures during placebo and rosuvastatin treatments are detailed in Supplemental Table 2. Lathosterol and lathosterol-cholesterol ratio were significantly reduced during treatment with R10 and R40. The changes were greater with R40, with statistically significant evidence for a dose-dependent effect. Compared with placebo, both doses of rosuvastatin significantly decreased cholesterol esterification rate (R10, −20%; R40, −28%) and CETP mass (R10, −15%; R40, −22%) and activity (R10, −11%; R40, −11%). LCAT mass did not change with treatment (Table 1).
Plasma lipids and apolipoproteins, measures of cholesterol synthesis, and lipid transfer proteins during treatment with placebo (P), R10, and R40
| P | R10 | R40 | Group difference | Dose effect (P value) | |||
|---|---|---|---|---|---|---|---|
| P vs. R10 | P vs. R40 | R10 vs. R40 | |||||
| Total cholesterol | |||||||
| mg/dl | 215 ± 10 | 142 ± 6 | 125 ± 5 | <0.001 | <0.001 | 0.024 | <0.001 |
| mmol/liter | 5.52 ± 0.25 | 3.64 ± 0.16 | 3.20 ± 0.13 | ||||
| Triglycerides | |||||||
| mg/dl | 219 ± 29 | 168 ± 19 | 128 ± 11 | 0.027 | <0.001 | 0.063 | <0.001 |
| mmol/liter | 2.47 ± 0.32 | 1.88 ± 0.21 | 1.44 ± 0.13 | ||||
| LDL cholesterol | |||||||
| mg/dl | 137 ± 9 | 70 ± 5 | 59 ± 4 | <0.001 | <0.001 | 0.063 | <0.001 |
| mmol/liter | 3.50 ± 0.22 | 1.78 ± 0.12 | 1.51 ± 0.10 | ||||
| HDL cholesterol | |||||||
| mg/dl | 36.7 ± 2 | 38.4 ± 2 | 40.3 ± 2 | 0.227 | 0.011 | 0.129 | 0.011 |
| mmol/liter | 0.94 ± 0.04 | 0.98 ± 0.05 | 1.03 ± 0.04 | ||||
| ApoB (g/liter) | 1.19 ± 0.05 | 0.74 ± 0.03 | 0.65 ± 0.03 | <0.001 | <0.001 | 0.009 | <0.001 |
| ApoB/apoA-I ratio | 0.98 ± 0.02 | 0.58 ± 0.02 | 0.51 ± 0.03 | <0.001 | <0.001 | 0.006 | <0.001 |
| Estimated HDL particle size | 0.16 ± 0.01 | 0.17 ± 0.01 | 0.18 ± 0.01 | 0.575 | 0.028 | 0.082 | 0.019 |
| Lathosterol concentration | |||||||
| mg/dl | 0.93 ± 0.10 | 0.24 ± 0.03 | 0.13 ± 0.01 | <0.001 | <0.001 | 0.145 | <0.001 |
| μmol/liter | 24.0 ± 2.64 | 6.33 ± 0.80 | 3.42 ± 0.35 | ||||
| Lathosterol:cholesterol ratio (μg/mg) | 4.36 ± 0.42 | 1.73 ± 0.19 | 1.08 ± 0.11 | <0.001 | <0.001 | 0.031 | <0.001 |
| Plasma LCAT mass (μg/ml) | 7.26 ± 0.37 | 7.04 ± 0.34 | 7.12 ± 0.40 | 0.795 | 0.751 | 0.550 | 0.918 |
| Cholesterol esterification rate (nmol/μl/h) | 0.54 ± 0.03 | 0.41 ± 0.02 | 0.37 ± 0.02 | <0.001 | <0.001 | 0.019 | <0.001 |
| Plasma CETP mass (μg/ml) | 1.36 ± 0.07 | 1.16 ± 0.06 | 1.06 ± 0.03 | 0.004 | <0.001 | 0.206 | <0.001 |
| Plasma CETP activity (nmol/ml/h) | 87.07 ± 3.07 | 77.10 ± 2.02 | 77.11 ± 2.05 | <0.001 | <0.001 | 0.964 | 0.006 |
Results are shown as mean ± sem.
The isotopic tracer curves for HDL apoA-I and apoA-II in a representative subject during treatment with placebo and with R10 and R40 are shown in Fig. 2. The symbols represent the enrichment data, and the solid lines show the best fit of the model to the tracer data. Plasma leucine tracer curves did not differ significantly among treatment periods. The slower falls in the HDL apoA-I and apoA-II tracer curves were consistent with decreased rates of catabolism.
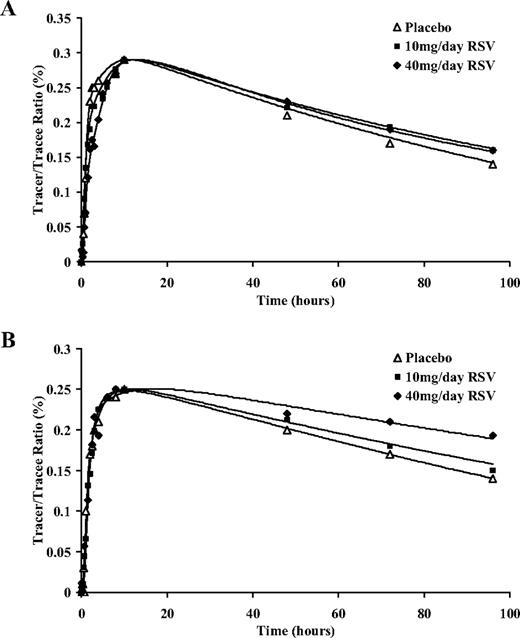
Isotopic enrichment for HDL apoA-I (A) and apoA-II (B) with D3-leucine in a representative subject on placebo, 10 mg/d rosuvastatin (RSV) and 40 mg/d rosuvastatin.
Table 2 shows concentrations and kinetics of apoA-I, apoA-II, LpA-I, and LpA-I:A-II during treatment with placebo and R10 and R40 daily. Compared with placebo, rosuvastatin increased the concentration of LpA-I (R10, +7.5%; R40, +17.5%), with no significant changes to apoA-I, apoA-II, or LpA-I:A-II concentrations. Both doses of rosuvastatin decreased the FCRs of apoA-I (R10, −10%; R40, −18%), apoA-II (R10, −8.4%; R40, −19%), LpA-I (R10, −15%; R40, −23%), and LpA-I:A-II (R10, −8.4%; R40, −19%), the effect being greater with R40. Concomitantly, the PRs of apoA-I (R10, −7.4%; R40, −17%), apoA-II (R10, −7.7%; R40, −20%), and LpA-I:A-II (R10, −5.3%; R40, −22%) were decreased on rosuvastatin, the effect being greater with the 40-mg dose. There was a statistically significant dose-dependent effect of rosuvastatin in decreasing the FCRs and PRs of these lipoproteins. Neither dose significantly altered LpA-I PR. Individual subject data for apoA-I and apoA-II kinetic parameters during placebo and rosuvastatin treatments are described in Supplemental Tables 3 and 4.
Kinetic parameters for ApoA-I, apoA-II, LpA-I, and LpA-I:A-II during placebo (P) and R10 and R40
| P | R10 | R40 | Group difference | Dose effect (P value) | |||
|---|---|---|---|---|---|---|---|
| P vs. R10 | P vs. R40 | R10 vs. R40 | |||||
| Concentration (g/liter) | |||||||
| ApoA-I | 1.22 ± 0.04 | 1.27 ± 0.04 | 1.25 ± 0.03 | 0.090 | 0.086 | 0.566 | 0.276 |
| ApoA-II | 0.29 ± 0.01 | 0.28 ± 0.01 | 0.28 ± 0.01 | 0.606 | 0.768 | 0.817 | 0.672 |
| LpA-I | 0.37 ± 0.02 | 0.40 ± 0.02 | 0.44 ± 0.02 | 0.360 | 0.032 | 0.179 | 0.029 |
| LpA-I:A-II | 0.85 ± 0.03 | 0.87 ± 0.04 | 0.82 ± 0.02 | 0.377 | 0.614 | 0.163 | 0.379 |
| FCR (pools/d) | |||||||
| ApoA-I | 0.36 ± 0.01 | 0.32 ± 0.02 | 0.29 ± 0.02 | 0.023 | <0.001 | 0.014 | <0.001 |
| ApoA-II | 0.30 ± 0.01 | 0.27 ± 0.02 | 0.24 ± 0.02 | 0.202 | 0.001 | 0.018 | <0.001 |
| LpA-I | 0.50 ± 0.03 | 0.42 ± 0.03 | 0.38 ± 0.03 | 0.062 | 0.001 | 0.094 | 0.004 |
| LpA-I:A-II | 0.30 ± 0.01 | 0.27 ± 0.02 | 0.24 ± 0.02 | 0.202 | 0.001 | 0.018 | <0.001 |
| PR (mg/kg/d) | |||||||
| ApoA-I | 16.45 ± 1.25 | 15.34 ± 1.39 | 13.82 ± 1.29 | 0.162 | 0.002 | 0.037 | 0.001 |
| ApoA-II | 3.20 ± 0.27 | 2.98 ± 0.34 | 2.58 ± 0.30 | 0.216 | 0.002 | 0.031 | 0.001 |
| LpA-I | 6.91 ± 0.65 | 6.25 ± 0.66 | 6.26 ± 0.67 | 0.227 | 0.167 | 0.847 | 0.245 |
| LpA-I:A-II | 9.51 ± 0.75 | 9.10 ± 0.94 | 7.44 ± 0.76 | 0.594 | 0.009 | 0.023 | 0.004 |
With R40, the decrease in triglyceride concentration was significantly associated with an increase in HDL particle size (r = −0.630; P = 0.028; Fig. 3A). The increase in HDL particle size was also significantly associated with the increase in LpA-I concentration (r = 0.598; P = 0.040; Fig. 3B). The above associations were also observed with R10 but were not statistically significant. No significant associations were observed between changes in apoA-I, apoA-II, LpA-I, and LpA-I:A-II PR and FCR with that of LDL-apoB FCR (16) and other study variables.
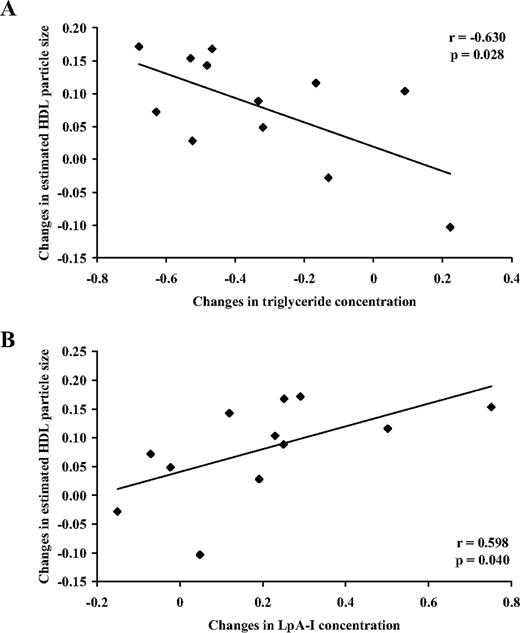
Associations between changes in estimated HDL particle size and triglyceride concentration (A) and LpA-I concentration (B) on 40 mg/d rosuvastatin relative to placebo.
Discussion
We provide new information on the dose-ranging effects of rosuvastatin, a highly effective HMG CoA reductase inhibitor, on HDL metabolism in subjects with the metabolic syndrome. We demonstrate that rosuvastatin dose-dependently increased HDL cholesterol, LpA-I concentration, and HDL particle size. The increase was primarily associated with dose-dependent decreases in LpA-I particle catabolism and triglyceride concentration, coupled with reduced CETP activity and cholesterol esterification rate. These results add further to our published report on the dose-dependent effect of rosuvastatin on the kinetics of apoB-containing lipoproteins in the same subjects (16).
Previous kinetic studies using radioactive and stable isotopic techniques that examined the effects of statins on HDL metabolism have not shown consistent effects. Of these studies, four used a high dose of statin. Bilz et al. (25) showed in eight hypertriglyceridemic men that 80 mg atorvastatin significant increased HDL cholesterol concentration with no changes apoA-I kinetics (25). Mauger et al. (26) observed no change to HDL cholesterol concentration in seven men with low plasma HDL cholesterol concentration with 40 mg atorvastatin or 80 mg simvastatin, although they reported an increase in apoA-I concentration and PR with 80 mg simvastatin. We previously reported that 40 mg atorvastatin did not alter HDL cholesterol and apoA-I concentrations or apoA-I kinetics in obese, insulin-resistant subjects (18, 27). Discrepancies among the studies may relate to different lipoprotein and clinical characteristics, study design, sample size, and duration of intervention. None of these studies examined the effects of increasing doses of statin on HDL metabolism. We extend previous reports by focusing on the metabolic syndrome and by investigating the effect on turnover rates of LpA-I and LpA-I:A-II particles using a three-way crossover study design with two doses of rosuvastatin.
The combination of central obesity, insulin resistance, and hypertriglyceridemia collectively contributes to the accelerated catabolism of HDL subpopulations in the metabolic syndrome (28–30). This is in part due to the expansion in the VLDLtriglyceride pool and increased neutral lipid exchange by CETP leading to alteration in HDL particle composition, increased hepatic removal through hepatic lipase activity, dissociation of apoA-I from HDL particles, and subsequently recycling or catabolism by the kidney (31). Our subjects exhibited such hypercatabolism of HDL particles.
Consistent with findings of large clinical trials with rosuvastatin, HDL cholesterol concentration increased in a dose-dependent manner after rosuvastatin treatment (14). In the absence of significant changes in plasma apoA-I and apoA-II concentrations, a change in HDL composition was observed through an increase in LpA-I concentration and estimated HDL particle size, consistent with recent reports (32). An explanation for this finding was that rosuvastatin, particularly at the higher dose, decreased the FCRs of apoA-I, apoA-II, LpA-I, and LpA-I:A-II, and this was coupled with a commensurate fall in PRs, with the exception of that for LpA-I, thus accounting for the increase in LpA-I concentration. The reduction in the production rate of apoA-I-containing particles in response to a fall in catabolism may simplistically reflect the operation of balancing feedback mechanisms in the setting of insulin resistance. Exactly how this mechanism operates is unknown. The inhibition of endogenous cholesterol synthesis and reduction in neutral lipid exchange between LDL and VLDL in response to rosuvastatin may partly contribute to accelerated catabolism of apoB-containing particles (16). Because we did not find an association between the increase in catabolism of LDL apoB and the fall in the catabolism of HDL particles, we suggest that the processes are not coupled. This suggests that the regulation of HDL is independent of HMG CoA reductase inhibition and involves limitation of triglyceride substrate availability, stimulation of lipolytic enzymes and receptors, and consequent remodeling of HDL.
Changes in the distribution and estimated size of HDL particles may be attributed to the reduction in CETP activity with rosuvastatin. The reduction in CETP activity and mass is consistent with previous studies with statins and may be associated with inhibition of CETP synthesis and reduced substrate for cholesterol ester transfer (18, 33–35). CETP mediates the heteroexchange of neutral lipids between HDL particles and apoB-containing lipoproteins. It has been previously reported that CETP may induce the formation of smaller HDL particles at the expense of larger HDL particles (36). The hypercatabolism of HDL particles in the presence of hypertriglyceridemia and elevated CETP activity in insulin-resistant states including the metabolic syndrome and type 2 diabetes is also well established (37). Therefore, the marked fall in plasma triglycerides, particularly at the high dose of rosuvastatin, may reduce CETP-mediated HDL remodeling, leading to formation of larger and more slowly catabolized HDL particles (33–35). Although the effect of statins on CETP has been previously reported, their effects on cholesterol esterification rate and LCAT mass are still unclear. Our study showed a reduction in rate of cholesterol esterification with no change to LCAT mass with rosuvastatin. We propose that the reduction in cholesterol esterification rate may be secondary to the fall in substrate availability and reduced CETP activity, because apoA-I concentration, the principal activator of LCAT, and LCAT mass were not altered.
Our findings showed a significant dose-dependent effect of rosuvastatin on HDL particle kinetics and HDL cholesterol concentration. Whether these changes translate to improved HDL functionality requires further study. Nonetheless, the recent ASTEROID trial (38) reported that the reduction in LDL cholesterol and increase in HDL cholesterol predicted coronary atheroma regression (39). Greater inhibition of CETP and catabolism of HDL, as seen with torcetrapib, may be less desirable (40).
Our study was restricted to men, and we did not study subjects with type 2 diabetes. We anticipate that our study would apply to women and diabetic subjects owing to the underlying presence of insulin resistance, although this will need to be formally tested. The study of subjects with isolated low HDL cholesterol would be required to investigate the triglyceride-independent effects of rosuvastatin on HDL particle kinetics. Our use of the HDL cholesterol to apolipoprotein ratio was only an approximation of HDL particle size, which could be more accurately estimated using gradient gel electrophoresis, ultracentrifugation, and nuclear magnetic resonance spectroscopy. However, this method of estimating HDL particle size has been used in previous studies (6, 19, 20). Measurements of lipases in post-heparin plasma may have clarified the mechanism for decreased catabolism of HDL particles with rosuvastatin. Isolation of LpA-I and LpA-I:A-II using immunoaffinity chromatography to obtain direct measures of LpA-I and LpA-I:A-II enrichment may provide better estimates of the kinetics of apoA-I in LpA-I and LpA-I:A-II. Although methodological differences, including method of tracer administration, may impact kinetic parameter estimation, the HDL particle kinetic parameters determined in our study are concordant with previous studies (41). Furthermore, we studied subjects in the postabsorptive state, and more studies are required to examine the effects of rosuvastatin on HDL metabolism in the fed state.
Our study also explored a newly developed multicompartmental model to examine the kinetics of HDL subpopulations LpA-I and LpA-I:A-II (23). The model was developed using plasma HDL apoA-I and apoA-II tracer data in conjunction with the findings of two published studies (19, 24). This model assumed that the kinetics of apoA-I in the LpA-I:A-II particle were the same as for HDL apoA-II (19, 24). This assumption was validated using apoA-I enrichment data obtained in LpA-I and LpA-I:A-II particles, separated from plasma by immunoaffinity chromatography, obtained after infusion of D3-leucine in men with mixed hyperlipidemia (42). The model also assumes that LpA-I:A-II particles are removed intact and that apoA-I is not recycled.
In conclusion, rosuvastatin dose-dependently increases the plasma concentration of HDL cholesterol, with a shift toward larger HDL particles, and this was primarily associated with a decrease in HDL apolipoprotein catabolism. Our findings provide a mechanistic basis for the lipid and lipoprotein changes in the comparative study with rosuvastatin in subjects with metabolic syndrome (COMETS) trial (15) and suggest that these subjects, particularly those with CVD, may derive incremental benefit from higher-dose rosuvastatin therapy (43). Future studies using new in vivo kinetic approaches and novel biomarkers to assess the effects of therapies, including rosuvastatin on HDL functionality and reverse cholesterol transport, are warranted.
Acknowledgments
We are grateful to Dr. V. Burke for statistical advice, Associate Professor F. van Bockxmeer for the apoE genotyping, and Dr. G. Chew for providing expert clinical assistance.
This study was funded by research grants from AstraZeneca Pty. Ltd. P.H.R.B. is a National Health and Medical Research Council (NHMRC) Research Fellow and is supported by the National Institutes of Health (NIH/NIBIB P41 EB-001975). D.S. is an NHMRC Research Fellow.
E.M.M.O., P.H.R.B., D.S., and A.H. have nothing to declare. G.F.W. and P.J.N. have received consulting and lecture fees (less than $10,000) from AstraZeneca Pty. Ltd.
Abbreviations
- Apo,
Apolipoprotein;
- CETP,
cholesterol ester transfer protein;
- CVD,
cardiovascular disease;
- FCR,
fractional catabolic rate;
- HDL,
high-density lipoprotein;
- HMG CoA,
3-hydroxy-3-methylglutaryl coenzyme A;
- LCAT,
lecithin cholesteryl acyl transferase;
- LDL,
low-density lipoprotein;
- LpA-I,
HDL particles that contain apoA-I;
- LpA-I:A-II,
HDL particles containing both apolipoprotein A-I and A-II;
- PR,
production rate;
- R10,
10 mg rosuvastatin;
- R40,
40 mg rosuvastatin;
- VLDL,
very-low-density lipoprotein.
