


Abstract
Diabetes mellitus (DM), a possible adverse effect of childhood cancer treatment, is strongly associated with cardiovascular disease and early mortality in adult childhood cancer survivors (CCS).
Here, we assess the prevalence and determinants of DM in our nationwide CCS cohort.
In this cross-sectional study, the prevalence of DM was assessed in 2338 CCS, using the Lifelines cohort (n = 132 226 adults with no history of cancer) as a reference. DM was defined through serum glucose measurement (fasting glucose ≥7.0 mmol/L or nonfasting ≥11.1 mmol/L) and/or self-report (previous diagnosis and/or medication use). Multivariable logistic regression models, adjusted for age, sex, and body mass index (BMI), were used to assess the cohort effect on the presence of DM. Multivariable logistic regression analysis was used to identify determinants of DM in CCS.
Survivors (median age 34.7 years, median follow-up time 27.1 years) showed increased odds for hyperglycemia (aOR = 2.72; 95% CI, 2.06-3.59), previous DM diagnosis (aOR = 3.03; 95% CI, 2.33-3.95), and antidiabetic medication use (aOR = 2.94; 95% CI, 2.17-3.99), compared to the reference cohort. Age (OR = 4.32; 95% CI, 1.84-10.15, >35 vs 18-35 years), BMI (OR = 1.12; 95% CI, 1.08-1.16, per point), family history of DM (OR = 2.38; 95% CI, 1.51-3.76), prior abdominal/pelvic radiotherapy (OR = 4.19; 95% CI, 2.32-7.55), total body irradiation (OR = 14.31; 95% CI, 6.98-29.34), hypogonadism (OR = 2.40; 95% CI, 1.15-4.99), hypertension (OR = 1.71; 95% CI, 1.06-2.76), and dyslipidemia (OR = 3.81; 95% CI, 2.15-6.75) were associated with DM in CCS. A statistically significant interaction between age and sex on the development of DM in survivors was identified.
The identified 3-fold increased risk of DM in CCS, along with the clinically relevant and some modifiable determinants, underscores the importance of early risk-based screening and the exploration of lifestyle interventions in this population.
Due to enhanced diagnostics, better stratification strategies, improved therapeutics, and established supportive care regimens, survival rates of most childhood cancers have improved notably over the past decades (1). However, childhood cancer survivors (CCS) still face a lifelong increased risk of morbidity and mortality following their disease and treatment (2). It has been shown that CCS have twice the burden of chronic diseases at age 45 years and reveal a consequent excess mortality compared to the general population (3, 4). Endocrine disorders, like diabetes mellitus (DM), are among the most common late effects, with possibly even higher prevalence in specific tumor-type subgroups (5-7).
DM, and associated metabolic syndrome, are strongly associated with an increased risk of cerebrovascular and cardiovascular disease (CVD) as well as overall mortality (8). These macrovascular comorbidities, in combination with several microvascular comorbidities due to DM, including retinopathy, nephropathy, and neuropathy (9), can substantially affect the quality of life of survivors and contribute to early mortality.
In CCS, the occurrence of coronary and cerebrovascular disease has been reported to be up to 12.7 times more frequent compared to the general population, with even higher risks in certain subgroups of CCS (10, 11). This makes it imperative to early initiate appropriate risk-based screening and implement risk-reducing strategies in this high-risk population both for DM and CVD. This is even more relevant as adequate interventions in patients at risk, such as a healthy diet, weight loss (12), physical activity, or aspirin (12), that have proven in the general population to delay the development of type 2 DM and/or CVD (13), may benefit CCS. Existing surveillance guidelines for CCS (14, 15) may be more tailored if based on a deeper understanding of the contributing factors of DM in CCS, leading to a better identification of who exactly is at risk of developing DM later in life.
Currently, available CCS studies report a prevalence of DM in CCS between 0.4% and 9.1% (national/multicenter studies) and 0.0% to 9.7% (single-center studies). Most studies reveal an increased risk of DM in survivors compared to a reference population (6, 7, 16-21), although not all studies substantiate these results (22, 23). Most of the available large-scale studies rely on self-reported conditions (16, 17, 20, 21, 24), the purchase of diabetic medication (7), medical records (25-27), DM-related hospital contacts (6, 18), or health databases (19, 23), all potentially leading to an underestimation of the actual risk of DM, as asymptomatic survivors may be missed.
Hence, the aims of the present study were to assess the prevalence of DM in our nationwide CCS cohort (treated 1963-2002), using self-report as well as serum glucose level measurements for diagnosis, and to identify demographic-, treatment-, and endocrine comorbidity–related determinants that might be associated with DM in these CCS.
Materials and Methods
Study Population
This cross-sectional study included data from the Dutch Childhood Cancer Survivor Study-LATER (DCCSS-LATER) cohort (28). This cohort consists of 6165 survivors who were alive for at least 5 years after a diagnosis of childhood cancer (ie, histologically confirmed malignancies or Langerhans cell histiocytosis), were diagnosed before age 19 years, and were treated in a Dutch pediatric oncology center between 1963 and 2002 (29). As part of the DCCSS-LATER 2 (30), the full eligible cohort of 4671 adults (ie, who were still alive and living in the Netherlands in October 2016) was asked to participate (Supplementary Fig. S1) (31). The DCCSS was approved by the medical research ethics committee of the Amsterdam University Medical Center (registered at toetsingonline.nl, NL32117.018.10) and all participants provided written informed consent.
Data Collection
Demographic-, disease-, and therapy-related data, and information about recurrences and subsequent malignancies, had been extracted from medical records in a national effort before recruitment (captured in the DCCSS-LATER database) (29). Collected data included radiation fields and prescribed dose, as well as chemotherapy regimens and total cumulative doses, from which cyclophosphamide equivalent doses and steroid equivalent doses were estimated (32, 33). All additional data were collected on recruitment during a single late-effects clinic visit, between June 2016 and February 2020. During this visit, survivors had a physical examination, including blood pressure measurement and height and weight values, from which we derived body mass index (BMI). They completed various questionnaires, including a general health questionnaire (with questions as “do you have diabetes mellitus,” and “have you ever smoked cigarettes?”) and SQUASH (short questionnaire to Assess Health-enhancing physical activity) (34). The SQUASH questionnaire was used to assess physical activity levels, with low physical activity defined as less than 150 minutes of medium exercise per week. Blood samples were supposed to be drawn after overnight fasting; however, when participants arrived without an overnight fast, this was reported in the data. Blood samples were stored at −80 °C in the DCCSS-LATER biobank (Princess Màxima Center for Pediatric Oncology). We assessed serum glucose levels using the Cobas 6000 c501 assay (Roche Diagnostics). Additionally, we assessed triglycerides, high-density lipoprotein, insulin-like growth factor 1, and creatinine levels. An overview of all outcomes and covariates, with information about used assays, references, and used definitions, is depicted in Supplementary Table S1 (31). All supplemental tables and figures are located in a digital research materials repository (31).
Reference Population
As a reference cohort, we used normative Dutch data from the Lifelines study cohort (adults aged 18-65 years, without a history of cancer) (35). Lifelines is a multidisciplinary prospective population-based cohort study examining in a unique 3-generation design the health and health-related behaviors of 167 729 individuals living in the North of the Netherlands. It employs a broad range of investigative procedures in assessing the biomedical, sociodemographic, behavioral, physical, and psychological factors that contribute to the health and disease of the general population, with a special focus on multimorbidity and complex genetics. Collected data included data on demographics, height, and weight measurements, serum glucose level measurements, and self-reported information on diagnosis of DM and antidiabetic medication use, and lifestyle factors (including smoking and physical activity).
Diabetes Mellitus
Both in the survivor and reference cohort, we considered participants to have DM if they either 1) were previously diagnosed with DM (self-report), and/or 2) were (self-reported) users of antidiabetic medication (either oral and/or any form of insulin, ATC code A10), and/or 3) had a measured fasting serum glucose value greater than or equal to 7.0 mmol/L or nonfasting serum glucose value greater than or equal to 11.1 mmol/L. Fulfillment of at least one criterion was sufficient for the study diagnosis of DM. Unfortunately, differentiation between types of DM (ie, type 1, type 2, gestational, or any other type) was not possible.
Statistical Analyses
Patient demographic-, disease-, and therapy-related characteristics were summarized using descriptive statistics. Comparisons between survivors and the reference cohort were assessed using chi-square and, if numbers were low (n < 5), Fisher exact tests. A multivariable logistic regression model was used to investigate the association between the presence of DM and both cohorts, adjusted for age, sex, and BMI. Odds ratios (ORs) and 95% CI are provided. To identify determinants associated with DM in CCS, univariable logistic regression models were estimated. In the multivariable models, statistically significant variables (defined as P < .05) from univariable analysis as well as variables known to be important from the literature (ie, sex, age, and age at diagnosis) were included. Separate models for treatment-related and endocrine comorbidity–related determinants were used to avoid multicollinearity between endocrine deficiencies caused by treatment factors. The presence of multicollinearity was investigated by calculating variance inflation factors. Case-wise deletion was used when data in covariates were missing. An interaction term between sex and age was added to investigate the effect on the outcome among the different strata. A likelihood ratio test was conducted to determine whether an improved fit was reached by adding treatment- and/or comorbidity-related determinants to the multivariable models. All analyses were conducted in R software environment (version 4.0.3) (36).
Results
Of the 4671 invited survivors, 2338 (50.1%) participated in the present study (part of the DCCSS-LATER 2). Our survivor cohort was 51.2% male, had a median age of 34.7 years (range, 18.2-70.8 years), and a median follow-up time of 27.1 years since childhood cancer diagnosis (range, 14.8-54.7 years). The most common underlying primary childhood cancers had been hematological malignancies (54.7%). The baseline characteristics of the survivor cohort as compared to the reference cohort are depicted in Table 1. When comparing participants and nonparticipants of our survivor cohort, we observed no significant differences regarding age at diagnosis, age at recruitment, and follow-up time, but there were significant differences in sex, frequency of radiotherapy, chemotherapy, and hematopoietic stem cell transplantation (HSCT) (Supplementary Table S2) (31). In our survivor cohort, we obtained information on DM diagnosis (self-report) of 2156 participants (92.2%), antidiabetic medication use (self-report) of 2154 participants (92.1%), and serum glucose level measurements of 2221 participants (95.0%). In the reference cohort, information on DM diagnosis was obtained of 132 102 participants (99.9%), antidiabetic medication use of 132 055 participants (99.9%), and serum glucose level measurements of 126 570 participants (95.7%).
Baseline characteristics of survivor and reference cohort
| Characteristics | Survivor cohort N = 2338a | Reference cohort N = 132 226a | Comparison, P |
|---|---|---|---|
| Sex | <.001 | ||
| Male | 1198 (51.2) | 54 763 (41.4) | |
| Female | 1140 (48.8) | 77 463 (58.6) | |
| Age at outpatient clinic visit, y (years) | |||
| 18-30 | 728/2326 (31.3) | 20 819 (15.7) | <.001 |
| 30-39 | 883/2326 (38.0) | 30 042 (22.7) | <.001 |
| 40-49 | 550/2326 (23.6) | 49 040 (37.1) | <.001 |
| >50 | 165/2326 (7.1) | 32 325 (24.4) | <.001 |
| BMIb | |||
| >25 | 1025/2252 (45.5) | 69 989/132 150 (53.0) | <.001 |
| >30 | 306/2252 (13.6) | 19 941/132 150 (15.1) | .048 |
| >35 | 87/2252 (3.9) | 4966/132 150 (3.8) | .794 |
| Lifestyle characteristics | |||
| Smoking | 665/2048 (32.5) | 28 437/127 358 (22.3) | <.001 |
| Heavy drinking | 59/902 (6.5) | NA | |
| Low physical activity | 436/1709 (25.5) | 56 955/117 803 (48.3) | <.001 |
| Age at diagnosis, y | |||
| 0-4 | 1071 (45.8) | ||
| 5-9 | 651 (27.8) | ||
| 10-14 | 481 (20.6) | ||
| 15-17 | 135 (5.8) | ||
| Primary childhood cancer | |||
| Hematologic malignancies | 1279 (54.7) | ||
| Solid tumors | 843 (36.1) | ||
| CNS neoplasms | 213 (9.1) | ||
| Other and unspecified neoplasms | 3 (0.1) | ||
| Follow-up time since diagnosis, y | |||
| 10-20 | 472 (20.2) | ||
| 20-30 | 928 (39.7) | ||
| 30-40 | 693 (29.6) | ||
| 40-50 | 220 (9.4) | ||
| 50-59 | 25 (1.1) | ||
| Surgeryc | |||
| Yes | 1145/2331 (49.1) | ||
| Amputation | 67 (2.9) | ||
| Radiotherapyc | |||
| Any radiotherapy | 905/2337 (38.7) | ||
| Abdominal/pelvicd | 201/2327 (8.6) | ||
| Craniald,e | 432/2330 (18.5) | ||
| Total body | 88/2327 (3.8) | ||
| Chemotherapyc | |||
| Any chemotherapy | 2057 (88.0) | ||
| Alkylating agents | 1176/2126 (55.3) | ||
| Anthracyclines | 1172/2204 (53.2) | ||
| Asparaginase | 584/2335 (25.0) | ||
| Corticosteroids | 1190/2338 (50.9) | ||
| Platinum | 311/2335 (13.3) | ||
| Vinca alkaloids | 1829/2336 (78.3) | ||
| Bone marrow transplantc | |||
| With myeloablative conditioning | 137/2322 (5.9) | ||
| Therapyc | |||
| No treatment | 10/2337 (0.4) | ||
| Surgery only | 150/2337 (6.4) | ||
| Chemotherapy only (± surgery) | 1272/2337 (54.4) | ||
| Radiotherapy only (± surgery) | 121/2337 (5.2) | ||
| Chemotherapy and radiotherapy (± surgery) | 784/2337 (33.5) |
P values for comparison were obtained using the Pearson chi-square test. Significant values (P < .05) are displayed in bold.
Abbreviations: BMI, body mass index; CNS, central nervous system.
aNot all numbers and percentages add up to group total because of variating missing data per subgroup. In groups with missing values, the total number of participants with an outcome for this variable is included in the table (after the slash).
bWeight is adjusted for amputated limbs by adding percentage to body weight (based on given amputation).
cPrimary cancer and recurrences.
dNot including cranial and/or abdominal/pelvic irradiation resulting from total body irradiation.
eIncluding cranial irradiation (brain tumors) and craniospinal irradiation.
Prevalence and Odds of Diabetes Mellitus
In our survivor cohort, 66 (3.1%) participants reported to have been previously diagnosed with DM, compared to 2414 (1.8%) participants in the reference cohort (P < .001). The self-reported mean age at diagnosis of DM was 31.0 years (range, 1.0-64.0 years) in the survivor cohort, vs 44.0 years (range, 33.0-52.0 years) in the reference cohort. The use of antidiabetic medication was reported in 49 (2.3%) survivors and 1779 (1.3%) references (P < .001). Hyperglycemia was present during study measurements in 59 (2.7%) survivors and 2075 (1.6%) participants in the reference cohort (P < .001). Of these hyperglycemia measurements, 54 (91.5%) in the survivor cohort and 2053 (98.9%) in the reference cohort were based on fasting serum glucose levels.
In total, 88 (3.8%) survivors were identified with DM according to our study diagnosis (ie, at least 1/3 criteria: previous diagnosis of DM, antidiabetic medication use, and/or hyperglycemia), compared to the 3255 (2.6%) participants from the reference cohort (P < .001) (Table 2). This statistically significantly increased prevalence of DM in survivors vs references was present in all age groups and increased with age to 12.1% in CCS aged 50 years and older vs 5.2% in the reference cohort (Fig. 1). Within the survivor cohort, there was no difference in prevalence of the study diagnosis of DM between participants with underlying primary cancer subgroups (3.7%, 3.9%, and 3.8% for CCS with underlying hematological malignancies, solid tumors, and central nervous system [CNS] neoplasms, respectively).
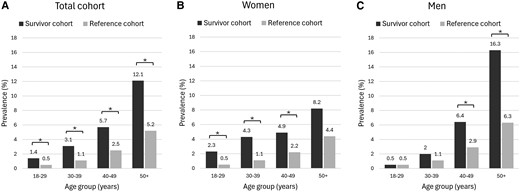
Age- and sex-stratified prevalence of diabetes mellitus (A: the entire cohort; B: women only, C: men only). *Statistically significant difference (P < .05).
Prevalence and odds ratio, along with 95% CI, of diabetes mellitus
| Survivor cohort N = 2338 | Reference cohort N = 132 226 | OR (95% CI) | Adjusted OR (95% CI)a | |
|---|---|---|---|---|
| DM (study criteria) | 88/2324 (3.8) | 3255/126 576 (2.6) | 1.49 (1.20-1.85) | 2.62 (2.08-3.30) |
| Self-reported DM diagnosis | 66/2156 (3.1) | 2414/132 102 (1.8) | 1.70 (1.32-2.17) | 3.03 (2.33-3.95) |
| Self-reported antidiabetic medication use | 49/2154 (2.3) | 1779/132 055 (1.3) | 1.70 (1.28-2.27) | 2.94 (2.17-3.99) |
| Hyperglycemia | 59/2221 (2.7) | 2075/126 570 (1.6) | 1.64 (1.26-2.13) | 2.72 (2.06-3.59) |
Significant values (P < .05) are displayed in bold.
Abbreviations: DM, diabetes mellitus; OR, odds ratio.
aAdjusted for age, sex, and body mass index.
Compared to the reference cohort, survivors had an increased adjusted odds ratio (aOR) for self-reported DM diagnosis (aOR = 3.03; 95% CI, 2.33-3.95), self-reported antidiabetic medication use (aOR = 2.94; 95% CI, 2.17-3.99), and measured hyperglycemia (aOR = 2.72; 95% CI, 2.06-3.59). The aOR for our study diagnosis of DM was 2.62; 95% CI, 2.08-3.30 (see Table 2).
Most participants classified with DM in the present study fulfilled all 3 criteria, both in the survivor (36.4%) and reference cohort (33.8%; P = .660). The distribution of criteria was equally divided comparing the survivor and reference cohort (Fig. 2). Of those fulfilling the study diagnosis of DM, 14 of 88 (15.9%) and 502 of 3225 (15.4%) participants in the survivor and reference cohort, respectively, reported to have been previously diagnosed with DM, but reported no antidiabetic medication use and were normoglycemic during study measurements (P = .930).
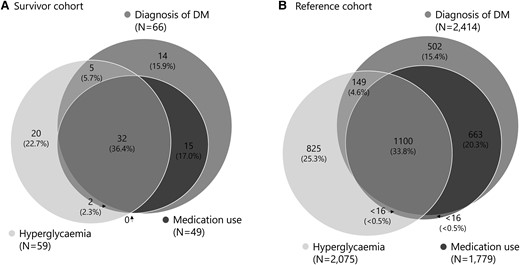
Visualization of contributing factors to the study diagnosis of diabetes mellitus (DM). This figure shows whether participants from the survivor cohort (A) or reference cohort (B) that we classified as having DM matched 1, 2, or 3 criteria. One fulfilled criterion was sufficient for the study diagnosis of DM.
Determinants Associated With Diabetes Mellitus
In univariable logistic regression analysis, we identified numerous determinants associated with DM in CCS (Supplementary Table S3) (31). For the multivariable logistic regression analysis, the application of the likelihood ratio test revealed an improved fit after adding treatment factors to the model with demographic factors (P < .001 for both abdominal radiotherapy and total body irradiation [TBI]) as well as adding the interaction term between sex and age (P = .019). In the final model, we identified age at clinic visit (OR = 4.32; 95% CI, 1.84-10.15, for age >35 years vs 18-35 years) as well as the interaction term between sex and age to be statistically significantly associated with DM in CCS. Additionally, BMI (OR = 1.12; 95% CI, 1.08-1.16 per BMI point), a family history of DM (OR = 2.38; 95% CI, 1.51-3.76), prior abdominal/pelvic irradiation (OR = 4.19; 95% CI, 2.32-7.55), and prior TBI (OR = 14.31; 95% CI, 6.98-29.34) were found to be associated with the outcome (Table 3). In the model for comorbidity-related determinants, the likelihood ratio test revealed an improved fit after adding comorbidities to demographic factors (P < .001), as well as improvement after adding the interaction term between sex and age (P = .047). In the best fitted model (model 4), we identified dyslipidemia (OR = 3.81; 95% CI, 2.15-6.75), hypertension (OR = 1.71; 95% CI, 1.06-2.76), and hypogonadism (OR = 2.40; 95% CI, 1.15-4.99) as being associated with DM in CCS (Table 4).
Multivariable logistic regression analysis: patient demographics and treatment factors for diabetes mellitus in childhood cancer survivors
| Model 1 | Model 2 | Model 3 | Model 4 | Model 5 | |
|---|---|---|---|---|---|
| Demographic factors | OR (95% CI) | OR (95% CI) | OR (95% CI) | OR (95% CI) | OR (95% CI) |
| Sex (female) | 1.04 (0.67-1.61) | 2.32 (0.95-5.67) | 0.96 (0.62-1.49) | 1.05 (0.67-1.66) | 2.57 (1.03-6.44) |
| Age at diagnosis (per y) | 1.01 (0.96-1.06) | 1.01 (0.96-1.06) | 1.03 (0.98-1.08) | 1.02 (0.97-1.07) | 1.02 (0.97-1.07) |
| Age at clinic visit, y (35+ vs 18-35) | 2.51 (1.52-4.16) | 4.72 (2.05-10.87) | 2.14 (1.29-3.57) | 2.15 (1.28-3.61) | 4.32 (1.84-10.15) |
| Body mass index (per point) | 1.08 (1.04-1.12) | 1.08 (1.04-1.12) | 1.09 (1.05-1.13) | 1.12 (1.08-1.16) | 1.12 (1.08-1.16) |
| Occurrence DM in family (yes vs no) | 2.19 (1.41-3.39) | 2.16 (1.39-3.35) | 2.21 (1.42-3.43) | 2.41 (1.53-3.80) | 2.38 (1.51-3.76) |
| Treatment factors | |||||
| Abdominal/Pelvic RT (yes vs no)a | — | — | 3.19 (1.81-5.63) | 4.12 (2.28-7.42) | 4.19 (2.32-7.55) |
| Total body irradiation (yes vs no) | — | — | — | 13.67 (6.72-27.82) | 14.31 (6.98-29.34) |
| Interaction | |||||
| Sex: age, y (female: 35+) | — | 0.33 (0.12-0.94) | — | — | 0.29 (0.10-0.84) |
| ANOVA (LRT) | — | P = .034 (vs model 1) | P < .001 (vs model 1) | P < .001 (vs model 3) | P = .019 (vs model 4) |
Significant values (P < .05) are displayed in bold.
Model 1: demographic factors.
Model 2: demographic factors + interaction term between sex and age.
Model 3: demographic factors + treatment-related factors (− total body irradiation).
Model 4: demographic factors + treatment-related factors (+ total body irradiation).
Model 5: demographic factors + treatment-related factors (+ total body irradiation) + interaction term between sex and age.
Abbreviations: ANOVA, analysis of variance; DM, diabetes mellitus; LRT, likelihood ratio test; OR, odds ratio; RT, radiotherapy.
aNot including abdominal/pelvic irradiation resulting from total body irradiation.
Multivariable logistic regression analysis: patient demographics and comorbidity-related factors for diabetes mellitus in childhood cancer survivors
| Model 1 | Model 2 | Model 3 | Model 4 | |
|---|---|---|---|---|
| Demographic factors | OR (95% CI) | OR (95% CI) | OR (95% CI) | OR (95% CI) |
| Sex (female) | 1.04 (0.67-1.61) | 2.32 (0.95-5.67) | 1.24 (0.78-1.96) | 2.70 (1.04-7.01) |
| Age at diagnosis (per y) | 1.01 (0.96-1.06) | 1.01 (0.96-1.06) | 1.00 (0.95-1.05) | 1.00 (0.95-1.05) |
| Age at clinic visit, y (35+ vs 18-35) | 2.51 (1.52-4.16) | 4.72 (2.05-10.87) | 2.11 (1.24-3.59) | 4.02 (1.63-9.93) |
| Body mass index (per point) | 1.08 (1.04-1.12) | 1.08 (1.04-1.12) | 1.04 (1.00-1.09) | 1.04 (1.00-1.09) |
| Occurrence DM in family (yes vs no) | 2.19 (1.41-3.39) | 2.16 (1.39-3.35) | 2.08 (1.32-3.27) | 2.07 (1.31-3.27) |
| Comorbidities | ||||
| Dyslipidemia (yes vs no) | — | — | 3.90 (2.20-6.91) | 3.81 (2.15-6.75) |
| Growth hormone deficiency (yes vs no) | — | — | 0.80 (0.36-1.79) | 0.81 (0.36-1.81) |
| Hypertension (yes vs no) | — | — | 1.68 (1.04-2.70) | 1.71 (1.06-2.76) |
| Hypogonadism (yes vs no) | — | — | 2.51 (1.21-5.20) | 2.40 (1.15-4.99) |
| Interaction terms | ||||
| Sex: age, y (female: 35+) | — | 0.33 (0.12-0.94) | — | 0.34 (0.12-1.03) |
| ANOVA (LRT) | — | P = .034 (vs model 1) | P < .001 (vs model 1) | P = .047 (vs model 3) |
Significant values (P < .05) are displayed in bold.
Model 1: Demographic factors.
Model 2: Demographic factors + interaction term between sex and age.
Model 3: Demographic factors + comorbidities.
Model 4: Demographic factors + comorbidities + interaction term between sex and age.
Abbreviations: ANOVA, analysis of variance; DM, diabetes mellitus; LRT, likelihood ratio test; OR, odds ratio.
Sensitivity Analysis
Sensitivity analyses were conducted including solely participants with fasting glucose levels and excluding participants with nonfasting glucose levels (10.0% and 1.7% in the survivor and reference cohort, respectively). These analyses showed minimal differences in the prevalence and corresponding ORs of DM (Supplementary Table S4) (31). Additionally, we conducted a sensitivity analysis excluding the self-reported previous diagnosis of DM as a study criterion. Although the overall prevalence of DM decreased both in the survivor and reference cohort, the corresponding ORs remained comparable (see Supplementary Table S4) (31). For both sensitivity analyses described earlier, minimal differences in results of multivariable logistic regression analysis were seen (Supplementary Table S5) (31).
Discussion
We aimed to assess the prevalence and determinants for DM in our nationwide CCS cohort. Our survivors showed almost 3-fold increased odds of DM compared to the reference cohort, regardless of the measurement method employed (self-reported previous DM diagnosis, antidiabetic medication use, and/or hyperglycemia). The development of DM in survivors seems to occur at a younger age compared to that expected in the general population, suggesting an “accelerated aging” phenotype in these survivors (37). Determinants age, family history of DM, prior abdominal/pelvic radiotherapy, TBI, hypogonadism, as well as BMI and dyslipidemia were found to be associated with DM in CCS, underscoring the need for exploring lifestyle interventions for CCS to decrease the excess morbidity and mortality.
Earlier CCS studies have reported on the risk of DM in survivors vs a control population in different ways (Table 5 and Supplementary Tables S6 and S7 and Supplementary Fig. S2] (31), making a comparison with our identified 3-fold increased risk challenging. Time-to-event analyses have been described, including a population-based study in Ontario (n = 10 438) reporting a hazard ratio (HR) of 1.51 (95% CI, 1.28-1.78) for developing DM in CCS compared to matched controls after adjustment for rurality and income (19). The Nordic collaborative cohort study ALiCCS (n = 29 324) reported an HR of 1.7 (95% CI, 1.5-1.9) for developing DM in CCS compared to population comparison participants (18). Additionally, risks and odds have been calculated, including the Childhood Cancer Survivor Study (CCSS) (n = 14 290), reporting that CCS were almost twice as likely to report DM in questionnaires compared to their siblings (relative risk 1.8; 95% CI, 1.4-2.3) (20) and the St. Jude Lifetime Cohort (SJLIFE, n = 1044) study, reporting 2-fold increased odds of DM in acute lymphoblastic leukemia (ALL) survivors compared to age-, sex-, and race-matched controls (OR = 2.07; 95% CI, 1.11-3.87) (40). A more recent SJLIFE study, which is most comparable to our methodology, reported a higher prevalence of DM across all age groups both in survivors and general population controls compared to our findings (6.5% vs 3.8% in CCS, and 4.7% vs 2.6% in controls, respectively) (41). This difference demonstrates the effect differences in demographics and general population risks may have in the development of DM among CCS.
Overview of national/multicenter childhood cancer survivor cohort studies with an outcome for diabetes mellitus
| Reference | Design | Country (cohort) | Cohort size | Definition of DM | CCS (N=…) | Male, % | Age | Follow-up | DM, % | Risk? | Prognostic variable |
|---|---|---|---|---|---|---|---|---|---|---|---|
| Noyd (2023) (38) | 3 | North-America (CCSS) | 4 | Self-report (diagnosis + antidiabetic medication use) | 1092 (NHB)/1405 (Hispanic)/13 960 (NHW) | 53.6/53.3/52.9 | M/Mdn NR | NR | 8.4/9.7/5.1a | NR | Race/ethnicity |
| Lipshultz (2022) (22) | 1 | US | 4 | Fasting glucose ≥126 mg/dL or HbA1c ≥ 6.5% | 164 | 55.5 | Mdn 28.9 y (16-38) | Mdn 17.4 y (13-22) | 2.5 | 1.6% in controls, P = .50 (NHANES)b | NR |
| Chow (2022) (16) | 2 | North America (CCSS) | 4 | Self-report (diagnosis) | 571 | 43.1 | Mdn 37.7 y (20.1-65.0) | Mdn 28.5 y (18.3-49.0) | 9.1 | 3.8% in controls, P = .002 (NHANES)b | NR |
| Friedman (2020) (17) | 3 | North America (CCSS) | 4 | Self-report (diagnosis + antidiabetic medication use) | 16 194/4 568c | 53.0/53.6 | Mdn 28.6 y (8.7-57.9)/Mdn 31.6 y (10.2-58.3) | Mdn 16.3 y (2.0-34.2)/Mdn 17.7 y (2.3-33.9) | 1.2/2.3 | RR 1.83 (95% CI, 1.29-2.60); P = .001/2.92 (2.02-4.23); P < .001 (sibling controls) | Older age, higher BMI, higher pancreatic tail radiation dose |
| Freycon (2019) (27) | 3 | France | 3 | Presence of diabetes, not further defined | 71 (HSCT + TBI) | 49.3 | Mdn 25.0 y (17.0-42.0) | Mdn 14.8 y (4.4-27.2) | 11.3 | NR | NR |
| Duncan (2018)(26) | 3 | US | 4 | Medical records (diagnosis + antidiabetic medication use) | 607 (HSCT) | 56 | Mdn 18.5 y (3.0-38.0) | Mdn 97 mo (24-230) | 7.7 | NR | NR |
| Faber (2018) (25) | 1 | Germany (CVSS) | 2 | Medical records (diagnosis/medication use) or HBA1c ≥ 6.5% | 951 | 55.3 | M 34.0 y (23-48) | M 28.4 y (23-36) | 2.0 | SPR (95% CI)d: 1.00 (0.39-1.89) (GHS, 35-48y); 0.95 (0.51-1.61) (DEGS); 2.00 (1.08-3.67) (KORA) | NR |
| Winther (2018) (18) | 3 | 5 Nordic countries (ALiCCS) | 1 | Hospital contacts | 29 324 | NR | NR | NR | 1.1 | HR 1.7 (95% CI, 1.5-1.9) (population comparison participants) | NR |
| Lega (2018) (19) | 3 | Canada | 3 | Health databases (diagnosis) | 10 438 | 53.1 | NR | M 11.2 y ± 6.9 | 1.5 | HR 1.51 (95% CI, 1.28-1.78) (age- and sex-matched controls, adjusted for rurality and income) | NR |
| Mostoufi-Moab (2016) (20) | 3 | North America (CCSS) | 4 | Self-report (antidiabetic medication use) | 14 290 | 54 | M 32 y (5-58) | Mdn 24 y (5-39) | 0.5-3.8 | RR 1.8 (95% CI, 1.4-2.3) (sibling controls) | TBI and Abd RT |
| Kero (2016) (7) | 3 | Finland | 2 | Purchase of antidiabetic medication | 2530 | 52.9 | Mdn 19.2 y (0-37.0) | Mdn 10.4 y (0-18) | 2.1 | HR 3.0 (95% CI, 1.5-6.1) (sibling controls) | Tumor type: ALL, AML, CNS, HL |
| Chao (2016) (23) | 3 | US | 4 | Health databases (diagnosis) | 652 | 53.2 | NR | M 6.2 y ± 4.1 | 1.1 | IRR 1.6 (95% CI, 0.7-3.7) (age- and sex-matched controls, adjusted for race) | NR |
| Holmqvist (2014) (6) | 3 | 5 Nordic countries (ALiCCS) | 1 | Hospital contacts | 32 903 | 53.4 | NR | Mdn 10 y (0-42) | 1.5 | SHRR 1.6 (95% CI, 1.5-1.8) and AER 43 (32-53) (age-, sex-, country-matched controls) | Tumor type: WT, leukemia, CNS, germ-cell, malignant bone, HL |
| Patterson (2012) (39) | 3 | US | 4 | Medical records (diagnosis) | 519 (CNS) | 51.2 | M 12.1 y ± 4.4 | M 7.2 y ± 3.7 | 0.4 | NR | NR |
| de Vathaire (2012) (24) | 3 | France and UK | 4 | Self-report, confirmed by medical records | 2520 | 53.3 | NR | Mdn 28 y (IQR 24-35) | 2.6 | NR | Pancreatic tail radiation |
| Meacham (2009) (21) | 2 | North-America (CCSS) | 4 | Self-report (antidiabetic medication use) | 8599 | 51.5 | M 31.5 y (17.0-54.1) | M 23.5 y (16.0-35.2) | 2.5 | OR 1.8 (95% CI, 1.3-2.5) (sibling controls, adjusted for age, sex, race/ethnicity, household income, health insurance, and BMI) | TBI, abd RT, alkylating agents, younger age at Dx, older attained age, higher BMI |
This table shows an overview of available national/multicenter based studies on diabetes mellitus in childhood cancer survivors. The literature search and search flowchart are depicted in Supplementary Table S6 and Supplementary Fig. S2, respectively. The overview of available single-center studies is depicted in Supplementary Table S7. Holmqvist (2014) and Winther (2018) describe the same cohort but with different risk calculations. The study by Meacham (2010) is not included in the table since it reports on the same cohort as Meacham (2009) with similar results and calculations. Age and follow-up time are shown as mean (M) ±SD or (range)/median (Mdn) (range).
Study design: 1 = prospective study, 2 = cross-sectional study, 3 = retrospective study.
Cohort size: 1 = nationwide (>1 country), 2 = nationwide (=1 country), 3 = population-based, 4 = multicenter.
Abbreviations: abd, abdominal; AER, absolute excess risk; AFR, African ancestry; ALiCCS, Adult Life After Childhood Cancer in Scandinavia; ALL, acute lymphoblastic leukemia; AML, acute myeloid leukemia; BMI, body mass index; CCS, childhood cancer survivor; CCSS, Childhood Cancer Survivor Study; CCSS, Childhood Cancer Survivor Study; CNS, central nervous system; CTCAE, Common Terminology Criteria for Adverse Events; CVSS, cardiac and vascular late sequelae in long-term survivors of childhood cancer study; DEGS, German Health Interview and Examination Survey for Adults; DM, diabetes mellitus; Dx, diagnosis; EUR, European ancestry; GHS, Gutenberg Health Study; HbA1c, glycated hemoglobin A1c; HL, Hodgkin lymphoma; HR, hazard ratio; HSCT, hematopoietic stem cell transplantation; IQR, interquartile range; IRR, incidence rate ratio; KORA, Cooperative Health Research in the region of Augsburg; M, mean; Mdn, median; NHANES, National Health and Nutrition Examination Survey; NHB, non-Hispanic Black; NHW, non-Hispanic white; NR, not reported; OR, odds ratio; RR, relative risk; RT, radiotherapy; SHRR, standardized hospitalization rate ratio; SJLIFE, St. Jude Lifetime Study Cohort; SPR, standardized prevalence ratio; TBI, total body irradiation; UK, United Kingdom; US, United States; WT, Wilms tumor.
aCumulative incidence by age 40 years.
bNHANES included in these depicted studies are age-, sex-, and race-matched controls from the NHANES database as controls.
cFirst number depicted is for CCS with no exposure to abdominal irradiation, the second number depicted is regarding CCS with exposure to abd irradiation.
dThis study used 3 different population cohort studies as controls (name in parentheses and in abbreviations).
We found a statistically significant interaction between sex and age for the development of DM in survivors, indicating a different effect on the outcome among the different strata. Female survivors revealed a higher prevalence of DM compared to the reference cohort in the younger age groups, whereas male survivors had a higher prevalence of DM only at an older age. Historically, aging has been associated with DM, as older age is a well-recognized risk factor for the development of DM (42). Our results seem to amplify the occurrence of DM in the general population, where younger women are more likely to develop DM compared to younger men and older men have a higher risk of DM compared to older women. To our knowledge, a sex difference on the effect of age on developing DM in survivors has not yet been explored in other national CCS studies. Previous studies have reported on female CCS carrying a higher risk of late effects compared to male CCS (43); however, the underlying mechanisms for this higher prevalence of late toxicity in female CCS have not yet been fully elucidated.
Consistent with results from earlier CCS studies, our results suggest that survivors exposed to prior abdominal/pelvic radiotherapy and TBI carry a statistically significant higher risk of DM (OR = 4.19; 95% CI, 2.32-7.55, and OR = 14.31; 95% CI, 6.98-29.34, respectively). Pancreatic insufficiency following irradiation probably results from radiation-induced apoptosis of pancreatic β cells, of which the majority are found in the islets of Langerhans, leading to a decreased insulin production (44). A recent study established the relation between the radiation dose of the tail of the pancreas and subsequent risk of DM and described a minimum latency of 20 years between radiation exposure and the development of DM, emphasizing the need for dose restriction on the tail of the pancreas when possible and the importance of long-term follow-up after abdominal irradiation (24). Apart from radiation-induced damage on the pancreas, irradiation on adipose tissue, which is increasingly recognized as an endocrine organ, might alter the adipose-derived hormones. This could lead to insulin resistance as well (45). Although abdominal irradiation dose with TBI is often lower compared to that of solely abdominal irradiation (for example in Wilms tumor patients), the aforementioned mechanisms will conceivably play, at least in part, a role. Certain endocrinopathies following TBI, such as gonadal insufficiency, may also contribute to the increased risk of DM in these survivors. Some studies are suggesting that DM is associated with TBI through abdominal obesity. Our results, in concordance with results from the CCSS (21), reveal the association between DM risk and TBI to be significant even after adjustment for BMI. Nevertheless, an altered fat distribution (“sarcopenic obesity”) in survivors with prior HSCT and TBI has been reported (46).
Our results did not reveal an association between prior asparaginase use and DM in survivors. High doses of glucocorticoids and asparaginase, both acting synergistically and the latter causing asparaginase-induced pancreatitis, are known for their risk of drug-induced DM, regularly occurring during the induction phase of ALL (47). Although most often drug-induced hyperglycemia resolves after the medication has been discontinued or reduced, asparaginase-induced toxicity in the pancreas has been correlated with persistent DM as well (48). Since we lacked information on experiencing asparaginase-induced toxicity during cancer treatment, we could only establish the correlation between prior asparaginase treatment and DM later in life, which could have clouded our results. Considering that ALL patients represent the largest CCS population and asparaginase treatment is a crucial part of their treatment according to current protocols, further research into this association is warranted. An important note is that asparaginase treatment is rarely given without steroid treatment (in our cohort n = 1, 0.2%), underscoring the relatedness of both treatment components. Although persistent DM has been reported in the literature after steroid use (49), we did not find this association, which is consistent with finding from the CCSS (21) and SJLIFE (40).
Apart from nonmodifiable determinants, we identified 3 modifiable determinants associated with DM in CCS: BMI (OR = 1.12; 95% CI, 1.08-1.16, per point), hypertension (OR = 1.71; 95% CI, 1.06-2.76), and dyslipidemia (OR = 3.81; 95% CI, 2.15-6.75). DM and dyslipidemia both have, at least partially, common underlying mechanisms by which both comorbidities can be induced, such as abdominal irradiation and TBI (50). Therefore, as treatment factors were excluded in the comorbidity-related model to avoid multicollinearity, dyslipidemia (but also hypertension) may act as a surrogate marker for the treatment-related risk of DM. More important, DM and dyslipidemia are both major risk factors for CVD and effective treatment options exist for both. Therefore, both need to be seriously acknowledged in surveillance. We underscore the importance of lifestyle interventions, as statin therapy has been associated with an increased risk of DM in the general population, although the beneficial effects of statins on CV events and mortality seem to outweigh the risk of DM (51). The identified association between BMI and DM in survivors is comparable to what is known from the general population (52). In contrast, growth hormone deficiency is associated with insulin resistance in the general population (53), but we did not identify this association in our survivor cohort, which is consistent with the findings of an Australian CCS study (54). Both their as well as our results, however, did show an association with hypogonadism and DM (54). This association between hypogonadism and DM has been reported previously in the general population as well, although predominantly in male cancer survivors (55). The association in females warrants further research. Low physical activity levels were not found to be associated with DM in our CCS cohort, despite it being a well-known risk factor of DM in the general population (12, 13). We hypothesize that the strong effect of certain cancer treatments (ie, abdominal radiotherapy, TBI) might overshadow the effect of physical activity, or other lifestyle factors, on the development of DM in CCS.
For the present study, some limitations need to be considered. First, we cannot rule out selection bias due to the observed differences between the characteristics of the participants and nonparticipants, although not all information from the refusers was available and absolute differences were small. Second, we could not differentiate between type 1 or type 2 DM and we considered participants with a single fasting glucose level greater than or equal to 7.0 mmol/L as diabetic, whereas the American Diabetes Association guidelines state that 2 separate measurements are required for diagnosis when the patient is asymptomatic. This could have resulted in an overestimation of DM, both in the survivor as well as the reference cohort. On the other hand, a recent study involving CCS treated with HSCT revealed that a single fasting glucose (or hemoglobin A1c [HbA1c]) level identified only one-third of the survivors with DM compared to survivors identified with an oral glucose tolerance test (56), suggesting a potential underestimation of DM in our cohort. Third, earlier studies have associated certain ethnicities with a higher risk of DM. Unfortunately, according to Dutch law it is not allowed to collect data on ethnicity and therefore we could not include this variable in our analyses. Last, the relationship between the radiation dose on organs/structures at risk (like the pancreas and abdominal adipose tissue) and the risk of DM will be investigated in further studies in this cohort.
In conclusion, CCS show an almost 3-fold increased odds of DM compared to the general population, regardless of measurement method used. Age, the occurrence of DM in the family, prior abdominal/pelvic radiotherapy, TBI, and hypogonadism were found to be associated with DM, as well as modifiable determinants BMI, hypertension, and dyslipidemia. Our results support the efforts to identify those survivors at risk for DM, and subsequent morbidity and mortality, which is key in the development of surveillance guidelines and preventive interventions for CCS.
Acknowledgments
We thank all participating survivors, physicians, research nurses, and data managers for their contribution to our study. Lastly, we wish to acknowledge services of the Lifelines Cohort Study, their contributing research centers delivering the data, and their study participants.
Funding
This work was supported by the Children Cancer-free Foundation (KiKa), KiKaRoW, and the ODAS foundation. The Lifelines initiative has been made possible by a subsidy from the Dutch Ministry of Health, Welfare and Sport, the Dutch Ministry of Economic Affairs, the University Medical Center Groningen (UMCG), Groningen University, and the Provinces in the North of the Netherlands (Drenthe, Friesland, Groningen).
Disclosures
All authors have no conflicts of interest to disclose.
Data Availability
The data underlying this article were provided by the DCCSS-LATER consortium under license. Data will be shared on reasonable request to the corresponding author with permission of the DCCSS-LATER consortium. The data are not publicly available due to privacy or ethical restrictions. Concerning the data of the Lifelines cohort, data may be obtained from a third party and are not publicly available. Researchers can apply to use the Lifelines data used in this study. More information about how to request Lifelines data and the conditions of use can be found on their website (https://www.lifelines.nl/researcher/how-to-apply).
References
Abbreviations
- ALL
acute lymphoblastic leukemia
- aOR
adjusted odds ratio
- BMI
body mass index
- CCS
childhood cancer survivors
- CCSS
Childhood Cancer Survivor Study
- CNS
central nervous system
- CVD
cardiovascular disease
- DCCSS-LATER
Dutch Childhood Cancer Survivor Study-LATER
- DM
diabetes mellitus
- HbA1c
hemoglobin A1c
- HSCT
hematopoietic stem cell transplantation
- OR
odds ratio
- SJLIFE
St. Jude Lifetime Cohort
- TBI
total body irradiation
Author notes
Marry M van den Heuvel-Eibrink and Sebastian J C M M Neggers contributed equally to this work.
