


Abstract
The Bigfoot Unity Diabetes Management System integrates Abbott FreeStyle Libre 2 continuous glucose monitoring (CGM) data into a smart insulin pen cap and mobile app, enabling clinician-directed insulin dose recommendations and real-time alerts.
The objective was to analyze real-world 6-month glycemic control in a prospective study for individuals using the System for multiple daily insulin injections (MDI).
We conducted a 6-month analysis from the BURST study (NCT05088265) of individuals with type 1 or type 2 diabetes (T2D). Participants reported baseline demographics, adverse events, and other survey data electronically. Either at-home kit or electronic medical record glycated hemoglobin A1c (HbA1c) data were collected.
Of 102 participants in the per protocol cohort, median age was 59 years, 87% had T2D, 42% used CGM previously, 62% were White non-Hispanic, and 59% female. Mean HbA1c decreased from 9.1 ± 1.7% at baseline to 8.0 ± 1.2% at 6 months (mean difference −1.1%, 95% CI −1.4 to −0.8, P < .001). At 6 months, time in range (70-180 mg/dL), time at < 70 mg/dL, and time at < 54 mg/dL were 56 ± 23%, 1.0 ± 1.4%, and 0.04 ± 0.14%, respectively. Six severe hypoglycemia events occurred in 4 participants (none System-related) and no diabetic ketoacidosis events occurred in the per protocol cohort.
In this study primarily of older adults with T2D using MDI, durable glycemic improvement occurred using the System at 6 months, with the frequency of hypoglycemia being substantially below established targets of < 4% and < 1% for time below 70 and 54 mg/dL, respectively.
Diabetes is a growing public health concern (1, 2). For people with insulin-requiring diabetes, dosing instructions may be complex and confusing (3-6). While recent guidelines call for continuous glucose monitoring (CGM) use for all who require insulin, regardless of diabetes type (7), there is also evidence that patients may not know how to interpret what to do with the CGM data (6, 8, 9). As injection therapy is used by more than 80% of people with insulin-requiring diabetes, there is a clear need for intuitive, integrated systems to help multiple daily injection (MDI) patients interpret CGM data into actionable management steps to reduce the burden of demanding self-care directives and support telemedicine (3, 6, 10-13).
The Bigfoot Unity Diabetes Management System was cleared by the Food and Drug Administration (FDA) in May 2021 (14), with commercial launch in July 2021. The System integrates with the FreeStyle Libre 2 Sensor (Abbott Diabetes Care, Inc., Alameda, CA, USA) and is designed to help with common barriers, including remembering and knowing how much insulin to take based on clinician recommendations. Bigfoot Unity is compatible with most commonly used disposable, long- and rapid-acting insulin pens, it supports the use of mealtime and correction insulin doses based on current glucose levels, and helps prevent the stacking of rapid-acting insulin. Cloud-based services enable CGM, blood glucose meter (Agamatrix, Salem, NH, USA) and insulin dose timing data, along with therapy settings and alerts received for low glucose and potentially missed long-acting doses, to be seamlessly recorded and communicated to the person with diabetes in a mobile app. Through the app, they also have access to their current ambulatory glucose profile report, including CGM and insulin data that can be shared with clinicians. This information can also be reviewed by their clinician in a dedicated web portal to assist in providing optimal diabetes care.
The objective of this study was to collect 6-month real-world use and safety data in a clinic setting of those with insulin-treated type 1 diabetes (T1D) or type 2 diabetes (T2D) prescribed the Bigfoot Unity System for multiple daily insulin injection; we sought to understand possible glycemic and psychosocial benefits after using the System.
Methods
Study Participants
The Bigfoot Unity Real World Study (BURST; NCT05088265) is a prospective, single-arm observational clinical study. Prescribing medical practices and/or sponsor representatives provided information about the study to recent users and individuals considering Bigfoot Unity System initiation, without regard to gender, race, or ethnicity. Persons completing Bigfoot Unity registration and expressing interest in the study were provided a link to a website containing study information. Participants reviewed and signed the electronic informed consent from the study website hosted by the coordinating center, the Jaeb Center for Health Research (JCHR, Tampa FL). Participants self-attested to the study eligibility criteria in the electronic consent. Briefly, participants were required to have either a T1D or T2D diagnosis, be English speaking, US residents aged 12 years and older, prescribed and trained on Bigfoot Unity, using compatible insulin brands and using rapid-acting insulin plus long-acting insulin once daily with an available baseline glycated hemoglobin A1c (HbA1c). Participants were asked not to consent if pregnant or intending to become pregnant, had implantable pacemakers, had serious medical conditions such as needing dialysis, were taking more than 500 mg vitamin C, or were employed by the sponsor or coordinating center (see NCT05088265 for more information). Additional screening procedures occurred after consent. The prespecified protocol, consent forms, data collection forms, and recruitment materials were approved by the JCHR institutional review board. Participants were enrolled between October 2021 and July 2023. Although inclusion/exclusion criteria allowed children to enroll if they were 12 years of age or older, no children enrolled in the study (see Table 1: participants from 19 to 82 years of age enrolled).
Participant characteristics
| Parameter | Per protocol cohort (N = 102) | Expanded cohort (N = 171) | Safety cohort (N = 232) | |
|---|---|---|---|---|
| Age in years, median (range) | 59 (22-82) | 57 (19-82) | 57 (19-82) | |
| Type 2 diabetes, n (%) | 89 (87) | 139 (81) | 187 (81) | |
| Female, n (%)a | 58 (59) | 93 (57) | 120 (57) | |
| Body mass index, mean (SD)a | 35.1 (8.0) | 34.0 (8.0) | 33.6 (8.1) | |
| Diabetes duration, n (%)a | ||||
| < 5 year | 16 (16) | 31 (19) | 44 (21) | |
| 5 to 10 years | 14 (14) | 29 (18) | 37 (18) | |
| > 10 years | 68 (69) | 102 (63) | 129 (61) | |
| Race/Ethnicity, n (%)a | ||||
| White non-Hispanic | 61 (62) | 94 (58) | 125 (60) | |
| Black/African American | 26 (27) | 49 (30) | 65 (31) | |
| Hispanic or Latino | 9 (9) | 11 (7) | 11 (5) | |
| Otherb | 2 (2) | 6 (4) | 7 (3) | |
| Prefer not to answer | 0 (0) | 2 (1) | 2 (<1) | |
| Usual number of meals per day, n (%)a | ||||
| 1 | 1 (1) | 1 (<1) | 2 (<1) | |
| 2 | 36 (37) | 57 (35) | 69 (33) | |
| 3 | 42 (43) | 77 (48) | 109 (50) | |
| 4 | 9 (9) | 14 (9) | 18 (9) | |
| 5 or more | 10 (10) | 13 (8) | 15 (7) | |
| Incomea | ||||
| < $25 000 | 24 (24) | 38 (23) | 49 (23) | |
| $25 000—<$50 000 | 29 (30) | 47 (29) | 61 (29) | |
| $50 000—<$100 000 | 23 (23) | 38 (23) | 54 (26) | |
| ≥ $100 000 | 17 (17) | 23 (14) | 25 (12) | |
| Do not wish to provide | 5 (5) | 16 (10) | 21 (10) | |
| Educationa | ||||
| Some high school or middle school | 1 (1) | 2 (1) | 4 (2) | |
| High school graduate/diploma/GED | 31 (32) | 58 (36) | 79 (38) | |
| Associate degree/some college | 35 (36) | 54 (33) | 70 (33) | |
| Bachelor's degree | 12 (12) | 25 (15) | 32 (15) | |
| Advanced/Graduate degree | 18 (18) | 21 (13) | 23 (11) | |
| Do not wish to provide | 1 (1) | 2 (1) | 2 (<1) | |
| Prescribed correction insulin dose at baseline, n (%) | 102 (100) | 169 (99) | 229 (99)c | |
| Prescribed fixed meal dose at baseline, n (%)d | 74 (73) | 127 (74) | 159 (69)c | |
| Meal dose prescribed at baseline, n (%) | ||||
| Breakfast, lunch, dinner | 81 (79) | 138 (81) | 178 (77)c | |
| Small, medium, large | 19 (19) | 28 (16) | 41 (18)c | |
| 3 carbohydrate amounts | 2 (2) | 4 (2) | 12 (5)c | |
| Basal dose at baseline (units), median (quartiles) | 26 (20, 50) | 30 (20, 50) | 30 (20, 50)c | |
| Duration of prior CGM use, n (%)a | ||||
| No prior CGM use | 57 (58) | 95 (59) | 118 (56) | |
| Less than 6 months | 7 (7) | 13 (8) | 26 (12) | |
| 6 months to < 1 year | 5 (5) | 10 (6) | 13 (6) | |
| ≥ 1 year | 29 (30) | 44 (27) | 53 (25) | |
| Received diabetes education in past 12 months, n (%)a | 26 (27) | 45 (28) | 63 (30) | |
| Smoking history (current), n (%)a | 10 (10) | 20 (12) | 29 (14) | |
| Medical conditions, n (%)a | ||||
| High blood pressure | 77 (79) | 123 (76) | 150 (71) | |
| High cholesterol | 79 (81) | 119 (73) | 150 (71) | |
| Stroke | 7 (7) | 8 (5) | 12 (6) | |
| Heart disease | 24 (24) | 31 (19) | 45 (21) | |
| Diabetic neuropathy (nerve disease) | 44 (45) | 65 (40) | 86 (41) | |
| Diabetic retinopathy (eye disease) | 13 (13) | 25 (15) | 31 (15) | |
| Diabetic kidney disease | 16 (16) | 23 (14) | 28 (13) | |
| Hypoglycemia unawareness | 4 (4) | 9 (6) | 13 (6) | |
| Severe hypoglycemia in past 3 months, n (%)a,e | ||||
| 0 | 75 (77) | 117 (72) | 149 (71) | |
| 1 | 9 (9) | 17 (10) | 20 (10) | |
| 2 | 6 (6) | 14 (9) | 18 (9) | |
| ≥ 3 | 8 (8) | 14 (9) | 23 (11) | |
| DKA in past 3 months, n (%)a,e | ||||
| 0 | 93 (95) | 154 (95) | 192 (91) | |
| 1 | 3 (3) | 4 (2) | 11 (5) | |
| 2 | 1 (1) | 1 (<1) | 1 (<1) | |
| ≥ 3 | 1 (1) | 3 (2) | 6 (3) | |
| Use of noninsulin glucose lowering medications, n (%)a | ||||
| None | 34 (35) | 63 (39) | 85 (40) | |
| Metformin only | 21 (21) | 29 (18) | 36 (17) | |
| Metformin + other medications | 20 (20) | 29 (18) | 35 (17) | |
| Other medications without metformin | 22 (22) | 34 (21) | 47 (22) | |
| Unknown | 1 (1) | 7 (4) | 7 (3) | |
| GLP-1RA and SGLT2i Use | ||||
| Neither | 72 (73) | 116 (72) | 150 (71) | |
| GLP-1RA only | 3 (3) | 6 (4) | 9 (4) | |
| SGLT2i only | 14 (14) | 23 (14) | 32 (15) | |
| GLP-1RA + SGLT2i | 8 (8) | 10 (6) | 12 (6) | |
| Unknown | 1 (1) | 7 (4) | 7 (3) | |
| Use of glucose-increasing medications, n (%)a,f | ||||
| 0 | 71 (72) | 124 (77) | 159 (76) | |
| 1 | 14 (14) | 23 (14) | 28 (13) | |
| ≥ 2 | 0 (0) | 1 (<1) | 3 (1) | |
| Unknown | 13 (13) | 14 (9) | 20 (10) | |
Abbreviations: CGM, continuous glucose monitoring; DKA diabetic ketoacidosis, GED, General Educational Degree; GLP-1RA, glucagon-like peptide-1 receptor agonists; SGLT2i, sodium-glucose co-transporter-2 inhibitors.
aFour (4) in the per protocol cohort, 9 in the expanded cohort, and 22 in the safety cohort were missing baseline surveys.
bOther race: 1 participant selected Native Hawaiian/Other Pacific Islander and 1 selected multiple races in the per protocol cohort. 2 participants selected Asian, 1 selected Native Hawaiian/Other Pacific Islander, and 3 selected multiple races in the expanded cohort. 3 participants selected Asian, 1 selected Native Hawaiian/Other Pacific Islander, and 3 selected multiple races in the safety cohort.
cOne (1) in the safety cohort had missing information.
dFixed meal dose means that all meals within meal dose categories prescribed at baseline reflected the same insulin dose.
eThree (3) with severe hypoglycemia and 2 with DKA were hospitalized in the per protocol cohort; 4 with severe hypoglycemia and 7 with DKA were hospitalized in the expanded cohort; 7 with severe hypoglycemia and 18 with DKA were hospitalized in the safety cohort.
fFor those using 1 other medication, for at least 43% it is a steroid; for ≥2 other medications, all include a steroid.
Study Procedures
Participants were asked to complete electronic questionnaires at baseline, 3 months, and 6 months. Questionnaires pertaining to demographics, medical history and medications were collected only at baseline and were self-reported by the participant (rather than screening for complications). For classifying the type of diabetes, data from the prescription received by the treating health care professional (HCP) for Bigfoot Unity System onboarding was used. Questionnaires pertaining to severe hypoglycemia and diabetic ketoacidosis (DKA), for occurrences within the 3 months prior, were collected at baseline. Subsequent questionnaires were sent to participants every 2 weeks through 6 months to assess self-reported safety events during the study such as severe hypoglycemia, DKA, and hospitalizations. Patient-reported outcomes (PROs) questionnaires were collected at baseline and at 3 and 6 months. Because participants could enroll up to 2 weeks after starting to use the System, baseline questionnaires, including baseline PROs, were structured to collect retrospective information prior to starting the System. The training date was used to indicate System start (day 0). A University of Minnesota Advanced Research and Diagnostic Laboratory kit was mailed to study participants in order to collect a capillary blood sample for HbA1c measurement at baseline and at 3 and 6 months by a method that has been previously described (15, 16). If a participant did not collect the blood sample within the acceptable window (−90 to 0 days for baseline) or the blood sample was received at the central lab beyond the stability period, an electronic medical record HbA1c value was used. De-identified CGM and other System data from the sponsor commercial database were transferred to JCHR for analysis.
Analyses were performed for safety, per protocol, and expanded cohorts. The safety cohort included all persons who enrolled and completed training on the System. The per protocol cohort included all participants with a baseline and 6-month HbA1c and at least 50% CGM data availability at 6 months. The expanded cohort included all participants with a baseline HbA1c and any HbA1c or glucose management indicator (GMI) available after day 68 of use.
Glycemic and System Use Parameters
The 3-month and 6-month endpoint windows were defined as 68 to 140 days and 141 to 228 days from System training, respectively; CGM metrics were calculated over a 28-day period with the most data and required at least 50% CGM data available (at least 336 hours) in the 6-month period to be included in the per protocol analyses. CGM and use metrics were also calculated for the first 2 weeks of System use. Prespecified outcomes for analysis were GMI (an estimate of HbA1c from CGM-measured mean glucose) calculated as described (17), percent time in range (TIR; 70-180 mg/dL, 3.9-10.0 mmol/L), percent time below range (< 70 mg/dL and < 54 mg/dL or < 3.9 mmol/L and < 3.0 mmol/L, respectively), percent time above range (> 180 mg/dL and > 250 mg/dL or > 10.0 mmol/L and > 13.9 mmol/L, respectively), sensor data availability (from sensor scans), mean sensor glucose and coefficient of variation, mean sensor scans, and dose events. Prespecified subgroup analyses included those with baseline HbA1c ≥ 8% vs < 8% (≥ 64 mmol/mol vs < 64 mmol/mol), those ≥ 65 years vs < 65 years, ethnicity, economic status, education, living areas, and those with and without previous CGM experience.
Patient-Reported Outcomes
PROs included the 28-item Type 1 Diabetes Distress Scale (T1-DDS) and the Hypoglycemia Confidence Scale (HCS) at baseline and at 3 and 6 months; total scores and all 7 subscale scores for the T1-DDS were calculated as described (10, 18). Of note, the T1-DDS, though it was initially developed for T1D, was deemed the better choice for assessing diabetes distress in the current study, since the sample included a mix of adults with T1D and T2D, and all were insulin users. Each T1-DDS item is scored on a 6-point, Likert scale, ranging from “not a problem” to “a very serious problem”; thus, lower scores indicate less distress. Based upon prior cutpoint analyses using T1-DDS, we investigated 6-month change from baseline in 2 subgroups of participants: those with T1-DDS < 2.0 and those with T1-DDS ≥ 2.0 (19). Each HCS item is scored on a 4-point, Likert scale, ranging from “not confident at all” to “very confident,” thus higher scores indicate greater confidence. Based on previous observations, we also investigated those with HCS < 3.0 and those ≥ 3.0 (18). Participants also completed the System Usability Scale (SUS) at 3 and 6 months (20). The SUS scores ranged from 0 to 100 with higher scores indicating more usability.
Safety Assessments
For assessing hypoglycemia, the mean number of unique low (< 70 mg/dL or < 3.9 mmol/L) and very low (< 54 mg/dL or < 3.0 mmol/L) glucose events lasting at least 15 minutes occurring per week within each analysis period were summarized as described (21). Hypoglycemia events were also summarized for the nocturnal period, defined as midnight (00:00 hours) to 06:00 hours in the morning (21).
Serious adverse events were collected and categorized by the study medical monitor (R.W.B.) as follows: severe hypoglycemia defined as loss of consciousness or impairment where assistance was required by a third party; DKA where there was a reported diagnosis of DKA from a healthcare facility; serious hyperglycemia for hyperglycemia events treated in a healthcare facility other than DKA; severe CGM issues requiring prescription treatment or treatment in a healthcare facility subclassified as infection, skin reaction, or discomfort or bleeding; and any hospitalizations. These definitions were incorporated into the baseline surveys assessing DKA and severe hypoglycemia in the 3 months prior to using the System and incorporated into the safety surveys sent to participants as they used the System in the study. For reported events during the study, JCHR staff would attempt to contact participants to confirm reported events indeed met these definitions (it was not possible to confirm baseline information in a similar way). Device relationship of adverse events was assessed by the medical monitor (eg, definitely, probably, possibly, or unlikely related, or unrelated). Safety data were reported for the safety, per protocol, and expanded cohorts.
Statistical Analysis
As this was an observational analysis, the sample size was not based on statistical power. Analyses combined type 1 and type 2 diabetes unless otherwise specified. The analysis was prespecified to be completed when approximately 100 participants had sufficient data to be included in the per protocol analysis. Analyses reported herein include data collected through August 31, 2023.
A longitudinal linear regression model was used to test HbA1c and PRO change from baseline. An estimate of the change from baseline, 95% CI, and P value was reported at 3 and 6 months. Missing data were handled by the longitudinal models through maximizing the likelihood function integrated over possible values of the missing data. If the change from baseline was skewed, then robust regression was used and missing data were handled using multiple imputation. The change in CGM metrics from the first 2 weeks was assessed using the same methods. Use parameters (eg, doses, alerts and scans) were summarized descriptively during the 6 months of follow-up.
The false discovery rate was controlled by using the adaptive Benjamini-Hochberg procedure. Analyses were grouped into the following categories: CGM metrics; HbA1c; PROs; subgroup analyses. Separate false discovery rate control was performed by analysis cohort (per protocol vs expanded).
A P value < .05 was considered statistically significant. Analyses were conducted using SAS software, version 9.4 (SAS Institute, Cary, NC).
Results
Participant Accounting
Figure 1 shows a flow diagram of participants and an overview of data available for each of the analysis cohorts. The safety cohort reflects 232 of 250 (93%) of those who enrolled. The expanded cohort reflects 171 of 207 (83%) who were eligible for outcomes analysis and the per protocol cohort represents 102 of 153 (67%) eligible for the 6-month per protocol analysis (Fig. 1).
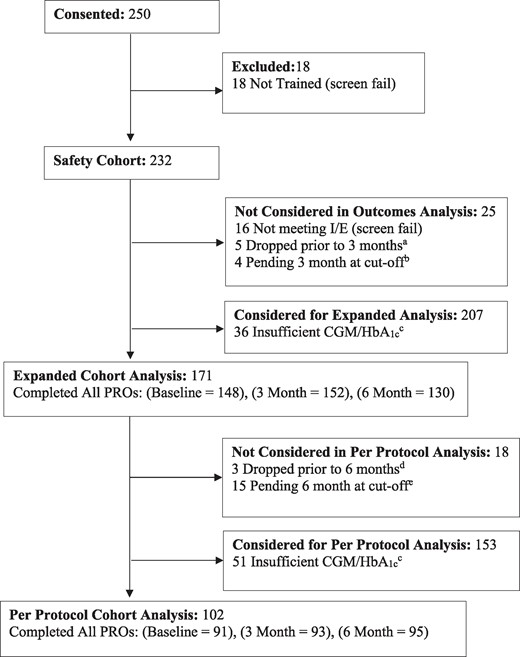
Participant flow diagram. aFive (5) participants withdrew from the study prior to their 3-month window; 2 participants were no longer seeing the prescribing health care professional, no longer using the System and asked to be withdrawn; 2 simply stated they no longer wished to participate; and 1 participant was withdrawn due to death. bAs noted, 4 were not included in the analysis due to having 3-month data that was still pending at the time of the analysis. cOne (1) participant who died during follow-up was active in the study during their 3-month window but provided insufficient CGM/HbA1c data to be analyzed in the expanded cohort. One (1) participant who died during follow-up provided sufficient CGM/HbA1c to be analyzed in the expanded cohort but not the per protocol cohort. dThree (3) participants requested to withdraw prior to the 6-month window; 1 participant was no longer using the System as was no longer on multiple daily injections and asked to be withdrawn; 1 simply stated they no longer wished to participate; and 1 participant was no longer using the System due to lack of insurance coverage and asked to be withdrawn. eAs noted, 15 were not included in the analysis due to having 6-month data that was still pending at the time of the analysis.
Participant Characteristics
Within the per protocol cohort (N = 102), median age was 59 years (range, 22-82) and 89 of 102 (87%) had T2D. Sixty-two percent (62%) selected White non-Hispanic as their race/ethnic background (see Table 1 for categories), 59% were female, and 69% had diabetes for 10 years or more. CGM had been previously used by 42% (see Table 1). The expanded cohort had similar characteristics (Table 1).
Glycemic Outcomes
In the per protocol cohort, mean HbA1c was 9.1 ± 1.7% prior to System use and decreased to 8.0% ± 1.2% at 6 months (mean difference −1.1%, 95% CI −1.4% to −0.8%, P < .001). Mean GMI in the first 2 weeks of use was 7.7% ± 1.0% and 7.6% ± 1.0% in the sixth month of use (Fig. 2). Figure 2B shows the HbA1c improvement by diabetes type. Mean HbA1c decreased from 9.0% ± 1.1% to 8.3% ± 1.0% (mean change −0.7%, 95% CI −1.5% to 0.1%) for 13 participants with T1D and decreased from 9.1% ± 1.8% to 7.9% ± 1.3% (mean change −1.2%, 95% CI −1.5% to −0.8%) for the 89 participants with T2D.
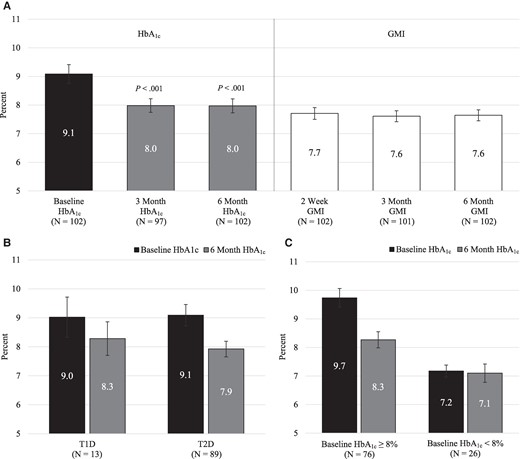
Glycated hemoglobin A1c (HbA1c) and glucose management indicator (GMI) in the Per Protocol Cohort. A, Comparison of baseline HbA1c and 3- and 6-month HbA1c (left side of panel) along with GMI within the first 2 weeks and within the third and sixth month of use (right side of panel). The median timing of baseline HbA1c prior to System start was 16 days. B, Comparison of baseline HbA1c and 6-month HbA1c within type 1 diabetes (T1D) and type 2 diabetes (T2D). C, Comparison of baseline HbA1c and 6-month HbA1c within baseline HbA1c subgroups (those ≥ 8% vs < 8%). For panels A, B, and C, data represent mean and 95% CI; in panel A, the P value indicates that the HbA1c at 3 and 6 months is statistically significantly different from the baseline HbA1c.
For the expanded cohort, similar improvement was observed. Mean HbA1c was 9.4% ± 1.9% (N = 171) prior to System use, decreasing to 8.1% ± 1.4% (N = 148) at 6 months (mean change −1.3%, 95% CI −1.6% to −1.0%, P < .001). The mean decrease was −0.9% (95% CI −1.5% to −0.4%) in 32 participants with T1D and −1.4% (95% CI −1.7% to −1.1%) in the 139 participants with T2D.
Several subgroup analyses were conducted in the per protocol cohort to determine if there were differences in HbA1c improvement (Table 2). Those with higher baseline HbA1c (≥ 8%; N = 76), had greater improvement (mean baseline HbA1c of 9.7% ± 1.4% improved to 8.3% ± 1.2% at 6 months) while those with lower baseline HbA1c had small changes in glycemic control (Table 2 and Fig. 2C). There was no statistically significant interaction in HbA1c improvement from baseline in other subgroups tested, including those with and without prior CGM experience, with the exception of those living in rural (vs urban) areas, who had higher baseline HbA1c (Table 2). Similar results in these subgroups were found in the expanded cohort (data not shown).
HbA1c within subgroups in per protocol cohort
| Na | Baseline mean ± SD | Month 6 mean ± SD | Change from baseline to month 6, mean (95% CI)b | Interaction P valueb | ||
|---|---|---|---|---|---|---|
| Overall | 102 | 9.1 ± 1.7 | 8.0 ± 1.2 | −1.1 (−1.4, −0.8) | − | |
| Age | .50 | |||||
| < 50 years | 28 | 9.5 ± 1.9 | 8.0 ± 1.3 | −1.4 (−2.1, −0.8) | ||
| 50 to < 65 years | 39 | 9.3 ± 1.6 | 8.2 ± 1.4 | −1.1 (−1.6, −0.6) | ||
| ≥ 65 years | 35 | 8.5 ± 1.4 | 7.6 ± 1.0 | −0.9 (−1.3, −0.4) | ||
| Diabetes duration | .07 | |||||
| ≤ 10 years | 30 | 9.4 ± 2.0 | 7.8 ± 1.2 | −1.6 (−2.2, −1.0) | ||
| > 10 years | 68 | 8.9 ± 1.6 | 8.0 ± 1.3 | −0.9 (−1.2, −0.6) | ||
| Income | .35 | |||||
| < $100 000 | 76 | 9.2 ± 1.7 | 7.9 ± 1.3 | −1.2 (−1.5, −0.9) | ||
| ≥ $100 000 | 17 | 8.7 ± 1.5 | 8.0 ± 1.0 | −0.7 (−1.5, 0.1) | ||
| Education | .75 | |||||
| < Bachelor's | 67 | 9.1 ± 1.7 | 8.0 ± 1.3 | −1.2 (−1.5, −0.8) | ||
| ≥ Bachelor's | 30 | 9.0 ± 1.7 | 7.9 ± 1.2 | −1.1 (−1.7, −0.4) | ||
| Race/Ethnicity group | .70 | |||||
| Non-White or Hispanic | 37 | 9.4 ± 1.6 | 8.2 ± 1.5 | −1.2 (−1.8, −0.6) | ||
| White non-Hispanic | 61 | 8.9 ± 1.7 | 7.8 ± 1.0 | −1.1 (−1.4, −0.7) | ||
| Urban/Rural | .01 | |||||
| Rural | 21 | 9.8 ± 1.8 | 7.8 ± 1.1 | −2.0 (−2.6, −1.3) | ||
| Urban | 81 | 8.9 ± 1.6 | 8.0 ± 1.3 | −0.9 (−1.2, −0.6) | ||
| Pre-study sensor use | .79 | |||||
| Non-CGM user | 57 | 9.0 ± 1.7 | 7.9 ± 1.2 | −1.2 (−1.6, −0.7) | ||
| CGM user | 41 | 9.1 ± 1.7 | 8.1 ± 1.3 | −1.1 (−1.5, −0.6) | ||
| GLP-1RA or SGLT2i use | 1.00 | |||||
| Nonuser | 73 | 9.2 ± 1.7 | 8.0 ± 1.3 | −1.1 (−1.5, −0.7) | ||
| User | 25 | 8.8 ± 1.7 | 7.7 ± 1.1 | −1.1 (−1.6, −0.6) | ||
| Baseline HbA1c | <.001 | |||||
| < 8.0% | 26 | 7.2 ± 0.5 | 7.1 ± 0.8 | −0.1 (−0.4, 0.2) | ||
| ≥ 8.0% | 76 | 9.7 ± 1.4 | 8.3 ± 1.2 | −1.5 (−1.8, −1.1) | ||
| Diabetes complicationsc | .26 | |||||
| No | 51 | 9.1 ± 1.6 | 7.9 ± 1.1 | −1.3 (−1.7, −0.9) | ||
| Yes | 51 | 9.0 ± 1.8 | 8.1 ± 1.3 | −0.9 (−1.4, −0.5) | ||
Abbreviations: HbA1c, Glycated hemoglobin A1c; CGM, continuous glucose monitoring; GLP-1RA, glucagon-like peptide-1 receptor agonists; SGLT2i, sodium-glucose co-transporter-2 inhibitors.
aFour (4) participants were missing diabetes duration, race/ethnic group, prior study sensor use, and GLP-1RA/SGLT2i use. Five (5) participants were missing education. Nine (9) participants were missing income.
bConfidence intervals on mean change from baseline were estimated from a linear mixed model. Interactions were tested using a longitudinal linear model with a study period by subgroup interaction term. CI and P values have been adjusted for multiplicity using the two-step adaptive Benjamini-Hochberg procedure.
cDefined as self-reported diabetic retinopathy, diabetic neuropathy, or diabetic kidney disease at baseline. This subgroup analysis was added post hoc and the P value for interaction has not been adjusted for multiplicity.
Sensor use, coefficient of variation, and TIR and time above and below range were evaluated (Table 3). Median sensor use was 87% with an interquartile range (IQR) of 74% to 93% in the first 2 weeks; median sensor use was 86% (IQR, 77% to 92%) and 84% (IQR, 72% to 91%) in the per protocol cohort in the third month and sixth month of use, respectively. TIR (70-180 mg/dL) in the first 2 weeks, third month, and sixth month of use was 55% ± 25%, 56% ± 24%, and 56% ± 23%, respectively. Time below range (TBR; < 70 mg/dL) was 0.6% ± 1.2%, 0.8% ± 1.2%, and 1.0% ± 1.4% and time < 54 mg/dL was 0.01% ± 0.10%, 0.03% ± 0.08%, and 0.04% ± 0.14% in the first 2 weeks, the third month, and the sixth month periods, respectively (Table 3).
Sensor and use parameters in the per protocol cohort
| Parameter (N = 102) | 2 weeks | 3rd montha | 6th month | |
|---|---|---|---|---|
| Percent sensor data availability, median (quartiles)b | 87 (74, 93) | 86 (77, 92) | 84 (72, 91) | |
| Glucose coefficient of variation in %, mean (SD)c,d | 29 (7) | 30 (6) | 31 (6) | |
| Mean glucose in mg/dL, mean (SD) | 184 (43) | 180 (41) | 181 (41) | |
| Glucose management indicator (GMI) in %, mean (SD) | 7.7 (1.0) | 7.6 (1.0) | 7.6 (1.0) | |
| Percent sensor time in ranges: | ||||
| 70-180 mg/dL (3.9-10.0 mmol/L), mean (SD) | 55 (25) | 56 (24) | 56 (23) | |
| > 180 mg/dL (> 10.0 mmol/L), mean (SD) | 44 (25) | 42 (25) | 43 (24) | |
| > 250 mg/dL (> 13.9 mmol/L), mean (SD) | 17 (20) | 15 (17) | 16 (18) | |
| < 70 mg/dL (< 3.9 mmol/L), mean (SD)c | 0.6 (1.2) | 0.8 (1.2) | 1.0 (1.4) | |
| < 54 mg/dL (< 3.0 mmol/L), mean (SD)c,d | 0.01 (0.10) | 0.03 (0.08) | 0.04 (0.14) | |
| < 54 mg/dL (< 3.0 mmol/L) ≥ 1% (14 minutes/day), mean (SD)b | 4 (4) | 1 (1) | 2 (2) | |
| Low glucose events/person/week, mean (SD)c | 1.0 (1.9) | 1.1 (1.6) | 1.3 (1.6) | |
| Nocturnal low glucose events/person/week, mean (SD)c | 0.2 (0.5) | 0.3 (0.6) | 0.4 (0.6) | |
| Very low glucose events/person/week, mean (SD) | 0.1 (0.5) | 0.1 (0.5) | 0.2 (0.4) | |
| Nocturnal very low glucose events/person/week, mean (SD) | 0.05 (0.24) | 0.07 (0.42) | 0.07 (0.24) | |
| CGM scans/day, median (quartiles)b | 7.3 (4.0, 10.1) | 5.3 (4.0, 8.8) | 5.2 (3.8, 7.9) | |
| Rapid-acting insulin doses/person/day, median (quartiles)b | 2.9 (2.2, 3.4) | 2.6 (1.9, 3.1) | 2.4 (1.9, 3.0) | |
| Long-acting insulin doses/person/week, median (quartiles)b | 7.0 (6.5, 7.5) | 7.0 (6.5, 7.3) | 6.9 (6.3, 7.0) | |
| Long-acting dose alerts/person/week, median (quartiles)b | 1.9 (0.9, 2.3) | 1.5 (1.0, 2.3) | 1.5 (0.5, 2.3) | |
| Percent long-acting alerts followed by dose within 2 hours, median (quartiles)b | 83 (50, 100) | 67 (50, 100) | 71 (50, 100) | |
| # Participants with ≥ 1 rapid-acting insulin dose adjustments, n (%)b | 22 (22) | 25 (25) | 19 (19) | |
| # Participants with ≥ 1 long-acting insulin dose adjustments, n (%)b | 22 (22) | 27 (26) | 14 (14) | |
Abbreviation: CGM, continuous glucose monitoring.
aOne (1) person did not have > 50% of CGM for analysis in the third month for N = 101 with data.
bVariable was not tested statistically as it was not part of the prespecified testing plan.
cRobust means and SD are reported. P values were estimated using a robust regression model due to skewness.
dFor glucose coefficient of variation, the sixth-month value was statically different from the first 2-weeks period; for % Time < 54 mg/dL (< 3.0 mmol/L), the third- and sixth-month values were statistically different from the first 2-weeks period at P < .005. Other variables tested were not statistically significant.
The average number of CGM-measured hypoglycemia events per week (< 70 mg/dL or < 3.9 mmol/L) was 1.0 ± 1.9, 1.1 ± 1.6, and 1.3 ± 1.6 in the first 2 weeks, third month, and sixth month of use, respectively (Table 3). Events occurring at night were 0.2 ± 0.5, 0.3 ± 0.6, and 0.4 ± 0.6, respectively.
Figure 3 shows time in ranges by type of diabetes in the 6-month period.
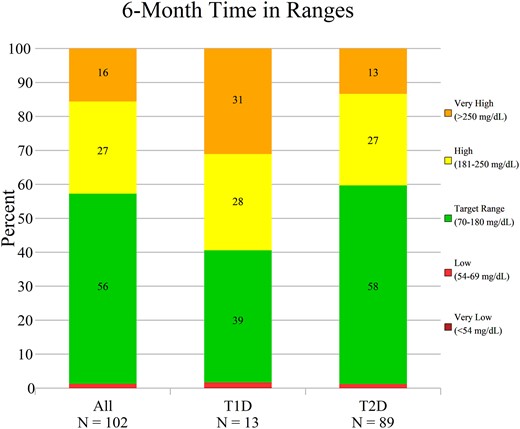
Time in ranges. Time in range, time above range, and time below range are shown for the overall per protocol cohort and within type 1 diabetes (T1D) and type 2 diabetes (T2D) subgroups, for the sixth month of System use. Data represent the mean percentage within each range.
The median number of rapid-acting insulin doses per day was 2.9 (IQR 2.2, 3.4), 2.6 (IQR 1.9, 3.1) and 2.4 (IQR 1.9, 3.0) in the first 2 weeks, third month, and sixth month of use, respectively (Table 3). The average number of long-acting doses per week was 7.0 (IQR 6.5, 7.5), 7.0 (IQR 6.5, 7.3) and 6.9 (IQR 6.3, 7.0) in the first 2 weeks, third month, and sixth month of use, respectively. At 6 months, 71% percent of the time (median), when a long-acting dose alert was issued, a long-acting dose occurred within 2 hours of receiving the alert (Table 3).
The expanded cohort had similar TIR and use outcomes despite not having strict CGM use requirements for analysis. At 6 months within the expanded cohort, median CGM use was 79% (IQR 62%, 89%), mean TIR was 54% ± 25%, mean TBR was 1.0% ± 1.5%, and median long- and rapid-acting insulin doses were 6.8 (IQR 5.5, 7.0) per week and 2.3 per day (IQR 1.4, 3.0), respectively. Within the per protocol and the expanded cohorts, over the course of 6 months, total System use represented 89.9 and 135.6 person-years, respectively.
Patient-Reported Outcomes
In the per protocol cohort, there was significant drop in total diabetes distress from baseline to 6 months and a corresponding rise in hypoglycemia confidence (Table 4). Mean T1-DDS score at baseline was 2.4 ± 0.9 and fell to 1.7 ± 0.6 at 6 months with a mean difference of −0.7 (95% CI −0.9 to −0.5, P < .001). Significant improvement in all 7 T1-DDS subscales were also observed; of particular interest were the drops in powerlessness, management distress, and hypoglycemic distress. HCS scores rose from 2.8 ± 0.7 at baseline to 3.1 ± 0.7 at 6 months (mean difference 0.4, 95% CI 0.2 to 0.5, P < .001). The mean SUS score was 80.7 at the 6-month assessment (Table 4).
Patient-reported outcomes in the per protocol cohort
| Parameter | Baseline | 3 Month | 3 month change from baseline (95% CI) [P value] | 6 Month | 6 month change from baseline (95% CI) [P value] | |
|---|---|---|---|---|---|---|
| Diabetes Distress Scale (DDS) | N = 91 | N = 94 | N = 99 | N = 95 | N = 99 | |
| Total | 2.4 ± 0.9 | 1.6 ± 0.6 | −0.7 (−0.9, −0.5) [<.001] | 1.7 ± 0.6 | −0.7 (−0.9, −0.5) [<.001] | |
| Powerlessness | 2.9 ± 1.3 | 2.0 ± 1.0 | −0.9 (−1.1, −0.6) [<.001] | 2.0 ± 0.9 | −0.9 (−1.1, −0.6) [<.001] | |
| Management Distress | 3.0 ± 1.2 | 1.7 ± 0.8 | −1.3 (−1.5, −1.0) [<.001] | 1.7 ± 0.8 | −1.3 (−1.5, −1.0) [<.001] | |
| Hypoglycemia Distress | 2.2 ± 1.3 | 1.6 ± 0.8 | −0.6 (−0.8, −0.3) [<.001] | 1.7 ± 0.9 | −0.5 (−0.8, −0.3) [<.001] | |
| Negative Social Perceptions | 1.6 ± 0.9 | 1.4 ± 0.7 | −0.2 (−0.4, 0.0) [.02] | 1.4 ± 0.7 | −0.2 (−0.4, −0.1) [0.01] | |
| Eating Distress | 3.0 ± 1.2 | 2.0 ± 1.0 | −1.0 (−1.2, −0.8) [<.001] | 2.0 ± 1.0 | −1.0 (−1.2, −0.7) [<.001] | |
| Physician Distress | 1.8 ± 1.2 | 1.2 ± 0.5 | −0.6 (−0.8, −0.4) [<.001] | 1.3 ± 0.7 | −0.5 (−0.8, −0.3) [<0.001] | |
| Friend/Family Distress | 1.9 ± 1.2 | 1.4 ± 0.7 | −0.4 (−0.7, −0.2) [<.001] | 1.6 ± 0.8 | −0.3 (−0.6, −0.1) [.003] | |
| Hypoglycemia Confidence Scale (HCS) | N = 91 | N = 94 | N = 99 | N = 95 | N = 99 | |
| Total | 2.8 ± 0.7 | 3.2 ± 0.6 | 0.4 (0.2, 0.5) [<.001] | 3.1 ± 0.7 | 0.4 (0.2, 0.5) [<.001] | |
| System Usability Scale (SUS) | − | N = 93 | − | N = 95 | − | |
| Total | − | 78.1 ± 18.5 | − | 80.7 ± 17.3 | − | |
Data reflect mean ± SD; change from baseline reflect mean (95% CI). The median timing of baseline questionnaire completion was 6 days prior to System start. P values were estimated using a longitudinal linear model and have been adjusted for multiplicity using the two-step adaptive Benjamini-Hochberg procedure.
Among participants completing the survey instrument at both baseline and 6 months, 56% (49 of 88) were found to have elevated distress (ie, above the mean T1-DDS cutpoint of ≥ 2.0) at baseline; after 6 months of System use, in those with elevated baseline distress (≥ 2.0), 49% (24 of 49) had dropped below the cutpoint, suggesting clinically relevant improvement. Similarly, using < 3.0 as the mean HCS cutpoint, 56% (49 of 88) indicated relatively low confidence regarding their management of hypoglycemia at baseline; after 6 months, among those with low confidence, 59% (29 of 49) had risen above the 3.0 cutpoint, again pointing to clinically relevant improvement. It should be noted that there were only a small number of participants who at baseline had relatively low distress (mean T1-DDS < 2.0) or moderate to high hypoglycemic confidence (mean HCS > 3.0) and worsened (ie, crossing their respective cutpoints) after 6 months (5% and 18% of participants, respectively).
In the per protocol cohort, mean T1-DDS score at baseline for those with T1D was 2.7 ± 0.8 and fell to 2.0 ± 0.9 at 6 months while baseline for T2D was 2.3 ± 0.9 and fell to 1.6 ± 0.6 at 6 months. The HCS baseline for those with T1D was 2.9 ± 0.7 and 2.8 ± 0.8 at 6 months while baseline for T2D was 2.8 ± 0.7 and 3.2 ± 0.7 at 6 months.
For the expanded cohort, similar outcomes were observed. At the 6-month assessment, the mean difference from baseline in the total T1-DDS score was −0.8 (95% CI −0.9 to −0.6, P < .001) and the mean difference in HCS was 0.4 (95% CI 0.2 to 0.5, P < .001).
Safety Outcomes
Safety data for the safety, per protocol, and expanded cohorts are shown in Table 5. In the safety cohort of N = 232, 15 severe hypoglycemia events occurred in 11 participants; all but 1 were in participants with T2D. The incidence of severe hypoglycemia per 100 person-years was 6.7, 5.2, and 9.0 in the per protocol, the expanded, and safety cohorts, respectively. Additionally, in the safety cohort, 1 DKA event occurred in a person with T2D and 2 other serious hyperglycemic events needing treatment in a healthcare facility occurred in 2 participants, 1 with T1D and 1 with T2D; neither was using the System at the time these events occurred. There were no CGM-related adverse reactions requiring treatment reported. Twenty-eight other non-diabetes-related hospitalizations occurred in 20 participants. None of these serious adverse events were considered related to System use by the medical monitor.
Safety events
| Parametera | Per protocol (N = 102) | Expanded (N = 171) | Safety (N = 232) | ||
|---|---|---|---|---|---|
| Severe hypoglycemia (SH) events, total (definite/probable/possible) | 6 (1/4/1) | 7 (1/4/2) | 15 (4/8/3) | ||
| Using system/not using system | 6/0 | 7/0 | 13/2 | ||
| Self-reported hospitalization | 0 | 0 | 2 | ||
| # of events per participant, n (%) | |||||
| 0 | 98 (96) | 166 (97) | 221 (95) | ||
| 1 | 2 (2) | 3 (2) | 7 (3) | ||
| ≥ 2 | 2 (2) | 2 (1) | 4 (2) | ||
| Incidence per 100 person-years | 6.7 | 5.2 | 9.0 | ||
| DKA events, total (definite/probable/possible) | 0 | 1 (0/1/0) | 1 (0/1/0) | ||
| Using system/not using system | 0/0 | 1/0 | 1/0 | ||
| Self-reported hospitalization | 0 | 1 | 1 | ||
| # of events per participant, n (%) | |||||
| 0 | 102 (100) | 170 (>99) | 231 (>99) | ||
| 1 | 0 (0) | 1 (<1) | 1 (<1) | ||
| ≥ 2 | 0 (0) | 0 (0) | 0 (0) | ||
| Incidence per 100 person-years | 0 | 0.7 | 0.6 | ||
| Hyperglycemia events (treated at healthcare facility), total | 0 | 0 | 2 | ||
| Using system/not using system | 0/0 | 0/0 | 0/2 | ||
| # of events per participant, n (%) | |||||
| 0 | 102 (100) | 171 (100) | 230 (>99) | ||
| 1 | 0 (0) | 0 (0) | 2 (<1) | ||
| ≥ 2 | 0 (0) | 0 (0) | 0 (0) | ||
| Incidence per 100 person-years | 0 | 0 | 1.2 | ||
| CGM events (treated at healthcare facility), total | 0 | 0 | 0 | ||
| Hospitalizations (reasons other than SH and DKA), totalb | 13 | 24 | 28 | ||
| Using system/not using system | 21/1 | 21/3 | 24/4 | ||
| # of events per participant, n (%) | |||||
| 0 | 92 (90) | 155 (91) | 212 (91) | ||
| 1 | 7 (7) | 10 (6) | 14 (6) | ||
| ≥ 2 | 3 (3) | 6 (3) | 6 (3) | ||
| Incidence per 100 person-years | 14.5 | 17.7 | 16.8 | ||
Abbreviations: CGM, continuous glucose monitoring; DKA diabetic ketoacidosis; SH, severe hypoglycemia.
aThe medical monitor determined that no events were related to Bigfoot Unity; 39 participants (4 per protocol, 10 expanded, 39 safety) never completed a safety survey.
bThree (3) deaths were reported during follow-up and classified as other hospitalizations. Two (2) participants who died were excluded from analysis in the expanded cohort and 1 was included in the expanded cohort but not the per protocol cohort. Two of three (2/3) deaths occurred while the participant was using Bigfoot Unity. The medical monitor determined that all deaths were unrelated to the System. Following the data freeze, the study team was notified of 1 additional participant death which occurred prior to the freeze. This event occurred in a T2D participant who was included in the expanded cohort but not the per protocol cohort and is not tabulated in other hospitalizations.
Discussion
In this prospective study of Bigfoot Unity users, most participants had T2D and about 40% had used CGM previously. In the per protocol cohort, a 1.1% improvement in HbA1c was observed after 3 and 6 months from a baseline of 9.1%. A similar 1.3% improvement was observed in the expanded population at 6 months where stringent CGM data availability was not required. The observed reduction in HbA1c did not compromise the population from meeting established hypoglycemia targets of < 4% and < 1% for percent time < 70 mg/dL (mean 1.0%) and < 54 mg/dL (mean 0.04%), respectively (22-24). Based on the GMI estimate of HbA1c within the first 2 weeks of being on the System, and comparison with the baseline HbA1c, there was rapid glycemic improvement which remained stable through month 6.
Connected or smart insulin pens are generally thought to be a potentially beneficial new technology to help improve MDI diabetes management and to support telemedicine (25, 26). However, there is very limited literature available to assess their effectiveness and safety. A PubMed search using the terms connected insulin pen or smart insulin pen on February 27, 2024, returned 55 articles, of which only 11 had relevant effectiveness or safety-related data for connected insulin pen systems (most were reviews of or perspectives on smart pen technology); surprisingly, none addressed the prospective collection of clinically relevant adverse events such as severe hypoglycemia (eg, requiring assistance) or DKA. Of note, there were 2 small randomized studies describing the potential benefits of smart pens (27, 28), 3 studies pertaining to the potential cost effectiveness of smart pens (29-31), 2 large retrospective real-world studies, one in over 5000 using Inpen within a 30-day period (32) and one for over 1000 T1D Novopen 6 users over approximately 3 months (33), and one small retrospective cohort of people managing MDI with Bigfoot Unity for 6 months (34).
In general, the prospective 6-month study reported here showed similar results to 3-month data presented previously (35) and similar glycemic control to a retrospective cohort using Bigfoot Unity (34); here, the baseline HbA1c was higher (9.1% vs 8.4%), which may reflect health status or other demographic biases in those who consent to participate in an ongoing study vs those who do not (36).
Similar to other investigations (34, 37), in a subset of participants with suboptimal glycemic control (those with baseline HbA1c ≥ 8%), the magnitude of the observed difference was larger (approximately 1.5% here) which may reflect regression to the mean phenomenon. This observation is important because some clinical studies may exclude participants with baseline HbA1c < 8%. Those with suboptimal control with baseline of ≥ 8% likely reflect the population for physicians to target for use, as these persons may benefit most from use of additional tools and support to help in diabetes management. However, we evaluated the HbA1c < 8% subgroup at 6 months and although there was little change in glycemic control, some improvement in T1-DDS (decreased ∼0.5 points), similar improvement of HCS (increased 0.4 points), and a similar TBR (∼1.0%) compared to the overall cohort was observed, suggesting psychosocial benefits with limited hypoglycemia.
Considering the older age of participants and comorbid conditions reported, the mean HbA1c, GMI, TIR, and TBR results (8.0%, 7.6%, 56%, and 1.0% at 6 months, respectively) demonstrate close adherence to established glycemic targets (23, 24, 38). Low and very low glucose events occurred at a low rate (mean of ∼1.3 and 0.2 events per person per week in the sixth month, respectively) and were in keeping with time below range meeting established standards (23, 24, 38). It can be noted that percent time < 54 mg/dL was on average 0.04% at 6 months and while this was statistically higher compared to the first 2 weeks of use (0.01%), it is likely not clinically meaningful. Other parameters such as the mean percent time of sensor use and mean coefficient of variation (84% and 31% at 6 months, respectively) are also within established guidelines (23, 24, 38).
Occurrences of severe hypoglycemia and DKA (9.0 and 0.6 events per 100 person-years, respectively, in the safety cohort) observed during the study period are in line with other literature with estimates ranging from 7 to 130 and 4 to 8 events per 100 person-years, respectively, in insulin-requiring diabetes populations using MDI therapy (39-43). It should be noted that because the recall process for reporting severe hypoglycemia and DKA events differed between baseline and the study period and, because only the latter had a confirmation process by the medical monitor that was not possible at baseline, we do not think it is appropriate to compare self-reported events at baseline to those occurring during the study.
Given that the System is intended for once-daily long-acting insulin dosing, the median of 7.0 and 6.9 long-acting doses per week in month 3 and 6 is encouraging. The average of 1.5 long-acting dose alerts per person per week in the sixth month may be interpreted as between 1 and 2 potentially forgotten long-acting doses; data that about 71% of such alerts received are followed by a dose taken within 2 hours of receiving the alert supports good engagement with the System in helping participants to remember to take their long-acting insulin. Given baseline data indicating that the vast majority took 2 (37%) or 3 (43%) meals per day, our findings of a median of 2.6 and 2.4 rapid-acting doses per day in the third and sixth month (slightly down from 2.9 in the first 2 weeks of use) suggest minimal missed meal injections. Use of CGM has demonstrated improved glycemic control (44-47) but there are some reports of those using CGM being unclear of how to interpret and use CGM data effectively (6, 8, 9). Here, 42% of participants were current CGM users at enrollment and had similar HbA1c improvements (1.1% vs 1.2%) when switching to Bigfoot Unity compared to non-CGM users at enrollment. These data suggest that HCP-directed meal and correction dose recommendations along with CGM contribute to the reduction from a mean baseline HbA1c of 9.1% to a mean of 8.0% after 6 months of use.
Observations of improved glycemic control were coupled with statistically significant improvements in diabetes distress (mean change −0.7 points) and improvements in hypoglycemia confidence (mean change 0.4 points). To place context around these results, note that the estimated minimally clinically important difference (MCID) for the 28-item T1-DDS total score is 0.19 in an insulin-requiring T1D population (19); comparing the average improvement in the current study with the MCID suggests that for the majority of participants, there may have been clinically meaningful improvement. Diabetes distress has been shown to be relatively stable over time, unless some form of intervention takes place (19). It is therefore notable that in the subset of participants with elevated distress at baseline (mean T1-DDS > 2.0), approximately half, (49%) had fallen below the 2.0 cutpoint for elevated distress at 6 months. Similarly, among those participants with relatively low confidence in managing hypoglycemia at baseline (mean HCS < 3.0), 59% had risen above the 3.0 cutpoint, indicating at least moderate confidence (≥ 3.0) after using the System for 6 months. For context for the SUS score, scores > 80 are considered excellent system use (48) and thus, the 6-month mean of 80.7 indicates that the System supports an above average user experience.
We combined those with type 1 and type 2 diabetes in the overall data analysis cohort. The T1D subgroup was small (see Figs. 1 and 3), but there appears to be a difference in HbA1c improvement (0.7% vs 1.2%), TIR (39% vs 58%), TBR (1.6% vs 0.9%), and time above range (59% vs 40%) between T1D and T2D subgroups, respectively. These findings are consistent with other studies in similar MDI populations (44, 45). With regard to diabetes distress, those with T1D had higher baseline distress than those with T2D (2.7 vs 2.3) with both groups having similar improvement (∼0.7 points); those with T1D had similar baseline hypoglycemia confidence as those with T2D (2.9 vs 2.8) but those with T1D did not show improvement at 6 months (−0.01 points) while those with T2D improved ∼0.5 points.
Limitations of this study include the single-arm study design with no concurrent control group and relatively small sample size in the per protocol cohort. The study design also did not include baseline CGM metrics (only baseline HbA1c and PRO data were available). Additionally, the study data collected were primarily direct from participant (ie, self-reported) which likely limited collection of complete data. Within the sponsor's commercial data, limited information is available for most participants pertaining to incomplete System data but reflected some instances of participants adopting another technology, no longer seeing the prescribing HCP, problems with insurance coverage, having some issues using the System, or no longer requiring MDI. For example, 45 of 216 (21%) who consented, started using the System and were not screening failures, had very limited data to analyze; this percentage with incomplete data could introduce bias and would be considered relatively high in a controlled trial but is anticipated in the real-world setting in an older population with comorbid conditions (49). Nonetheless, to mitigate potential dropout bias in the per protocol analysis and maximize analyzable data without requiring stringent System use, we conducted our expanded cohort analysis which demonstrated similar demographics, glycemic and PRO improvement, System use, and safety outcomes. Thus, we do not believe that the incompleteness of data for some participants was an appreciable source of bias. Finally, an additional limitation was that the number of participants with T1D was small, which limits interpretation.
With these limits in mind, the strengths of the study include the prospective collection of HbA1c, PRO, CGM and clinically relevant adverse events in a real-world and diverse population using this relatively new connected pen cap system.
In conclusion, we report the first prospective real-world data from individuals with diabetes using an MDI regimen and the Bigfoot Unity System for 6 months. For this cohort, consisting primarily of older adults with T2D and having suboptimal glycemic control, using the System resulted in rapid and durable improvement in glycemic control. Improvement in glycemic control, accompanied by psychosocial benefits, did not appear to compromise the cohort in meeting established standards for hypoglycemia and DKA. We found similar glycemic outcomes regardless of race, age, diabetes duration, presence of baseline diabetes complications, income, education, and prior sensor experience, which speaks to the generalizability of System use.
Acknowledgments
We would like to thank all of our early adopting clinical centers for their dedication to help those with diabetes. We also thank all of the BURST participants for consenting to participate in the study.
Funding
This work was funded by Abbott Diabetes Care.
Author Contributions
J.B.T.: Conceptualization, Methodology, Writing—Original draft preparation, Visualization. R.W.B.: Conceptualization, Data Curation, Methodology, Writing—Review & Editing, Supervision, Visualization. W.H.P.: Conceptualization, Data Curation, Methodology, Writing—Review & Editing. P.C.: Conceptualization, Methodology, Validation, Writing—Review & Editing, Visualization. T.M.: Data Curation, Methodology, Project administration, Writing—Review & Editing. R.B.: Formal analysis, Methodology, Software, Writing—Review & Editing. J.J.: Methodology, Project administration, Writing—Review & Editing. R.N.: Methodology, Project administration, Writing—Review & Editing. F.N.S.: Conceptualization, Methodology, Project administration, Supervision, Writing—Review & Editing. J.K.M.: Conceptualization, Methodology, Project administration, Supervision, Writing—Review & Editing.
Disclosures
J.B.T. and R.N. are full time employees of Abbott; R.W.B. reports no personal financial disclosures but reports that his institution (JCHR) has received funding on his behalf as follows: grant funding, study supplies, and consulting fees from Insulet, Tandem Diabetes Care, and Beta Bionics; grant funding and study supplies from Dexcom; grant funding from Bigfoot Biomedical (now Abbott); study supplies from Medtronic, Ascencia, and Roche; consulting fees and study supplies from Eli Lilly and Novo Nordisk; and consulting fees from embecta, Sequel Med Tech, Vertex, Hagar, Ypsomed, Sanofi, and Zucara. P.C., T.M., and R.B. are employed by JCHR; JCHR received funding from Bigfoot Biomedical (now Abbott) for study activities; W.H.P. has received consultancy fees from Bigfoot Biomedical (now Abbott), Abbott and Dexcom and his institution (Behavioral Diabetes Institute) received grant support from Abbott and Dexcom; J.J. was formerly employed by Abbott and is currently employed by Sequel Med Tech; J.K.M. was formerly employed by Abbott; F.N.S. was formerly employed by Bigfoot Biomedical.
Data Availability
Restrictions apply to the availability of some or all data generated or analyzed during this study to preserve patient confidentiality or because they were used under license. The corresponding author will on request detail the restrictions and any conditions under which access to some data may be provided.
Clinical Trial Information
Study registration: ClinicalTrials.gov (www.clinicaltrials.gov) identification NCT05088265.
References
Bigfoot Unity Diabetes Management System 510(k) Substantial Equivalence Determination Decision Summary 2021. Accessed November 14, 2024. https://www.accessdata.fda.gov/cdrh_docs/pdf20/K202145.pdf
Abbreviations
- CGM
continuous glucose monitor
- DKA
diabetic ketoacidosis
- FDA
Food and Drug Administration
- GMI
glucose management indicator
- HbA1c
glycated hemoglobin A1c
- HCS
Hypoglycemia Confidence Scale
- HCP
health care professional
- IQR
interquartile range
- JCHR
Jaeb Center for Health Research
- MDI
multiple daily injections
- PRO
patient-reported outcome
- SUS
System Usability Scale
- TBR
time below range
- TIR
time in range
- T1D
type 1 diabetes
- T1-DDS
Type 1 Diabetes Distress Scale
- T2D
type 2 diabetes
