


Abstract
To use a pre-clinical pharmacokinetic infection model to assess the antibacterial effect of ceftolozane/tazobactam alone or in combination with fosfomycin or tobramycin against Pseudomonas aeruginosa strains with MICs at or higher than the clinical breakpoint (MIC ≥ 4 mg/L).
An in vitro model was used to assess changes in bacterial load and population profiles after exposure to mean human serum concentrations of ceftolozane/tazobactam associated with doses of 2 g/1 g q8h, fosfomycin concentrations associated with doses of 8 g q8h or tobramycin at doses of 7 mg/kg q24 h over 168 h.
Simulations of ceftolozane/tazobactam at 2 g/1 g q8h alone produced 3.5–4.5 log reductions in count by 6 h post drug exposure for strains with MIC ≤32 mg/L. The antibacterial effect over the first 24 h was related to ceftolozane/tazobactam MIC. There was subsequent regrowth with most strains to bacterial densities of >106 CFU/mL. Addition of either fosfomycin or tobramycin resulted in suppression of regrowth and in the case of tobramycin more rapid initial bacterial killing up to 6 h. These effects could not be related to either fosfomycin or tobramycin MICs. Changes in population profiles were noted with ceftolozane/tazobactam alone often after 96 h exposure but such changes were suppressed by fosfomycin and almost abolished by the addition of tobramycin.
The addition of either fosfomycin or tobramycin to ceftolozane/tazobactam at simulated human clinically observed concentrations reduced P. aeruginosa bacterial loads and the risk of resistance to ceftolozane/tazobactam when strains had ceftolozane/tazobactam MIC values at or above the clinical breakpoint.
Introduction
Ceftolozane/tazobactam (C/T) is an emergent and increasingly used intravenous antibacterial therapy for severe Pseudomonas aeruginosa (Pa) infections, including multidrug resistant strains.1
Wild-type P. aeruginosa have ceftolozane-tazobactam MICs of ≤4 mg/L by EUCAST and this value is both the CLSI and EUCAST clinical breakpoint for ceftolozane/tazobactam when tested against P. aeruginosa.2,3
However, a pharmacodynamic argument can be developed based on free-drug plasma and lung epithelial lining fluid concentrations, use of bacteriostatic T > MIC targets and MIC distributions of isolates isolated from hospitalized patients with pneumonia that P. aeruginosa strains with ceftolozane/tazobactam MICs in the range 8–32 mg/L may be treatable even though such strains are presently rare even in critical care accounting for only 1.4% (11/781) of such strains in the USA.4,5
Monotherapy with an active anti-pseudomonal agent is most likely sufficient therapy for P. aeruginosa infection in most circumstances6 but combination therapies may have a role in treatment of infection in chronic lung disease, multidrug resistant infection and/or treatment of P. aeruginosa strains with MICs above but close to the clinical breakpoint.7
Previously, we showed in an in vitro pharmacokinetic model of Pseudomonal infection that a free T > MIC ceftolozane target in the presence of tazobactam for 24-h bacteriostatic and −1 log change in bacterial load were 25 ± 3% and 27 ± 4%, respectively. Emergence of resistance was suppressed at fT > MC exposures of >60%.8 Simulation of ceftolozane/tazobactam human serum concentrations associated with doses of 2 g/1 g q8h for 7 days showed eradication of bacterial load and suppression of emergence of resistance for P. aeruginosa stains with MICs in the range 0.38–4 mg/L.9
Using the same pre-clinical model, we simulated mean human clinically observed concentrations of ceftolozane/tazobactam 2 g/1 g q8h for 7 days as monotherapy and in combination with either tobramycin or fosfomycin. P. aeruginosa strains with MICs of 4–64 mg/L were employed and the primary endpoints were reduction in bacterial load and emergence of resistance as measured by changes in population profile.
This is the first use of an in vitro pharmacokinetic model to study the antibacterial effect of ceftolozane/tazobactam alone or in combination against P. aeruginosa strains with MICs at or above the clinical breakpoint.
Materials and methods
Pharmacokinetics
Mean free-drug serum concentrations of each drug were modelled based on free fractions of 0.8 for ceftolozane and tazobactam, >0.97 for fosfomycin and 0.9 for tobramycin. For 2 g ceftolozane/1 g tazobactam, the Cmax at 1 h of infusion was 112 mg/L for ceftolozane and 32 mg/L for tazobactam, and the t1/2values were ceftolozane 2.5 h and tazobactam 1 h. Fosfomycin concentrations modelled were those associated with 8 g q8h as a bolus (i.e. Cmax 400 mg/L and t1/2 2.5 h) and tobramycin was simulated at a dose of 7 mg/kg q24h Cmax 22 mg/L, t1/22.5 h.10–14
In vitro pharmacokinetic model
An in vitro one-compartment pharmacokinetic model (Electrolab, Tewkesbury, UK) was used to simulate the mean free-drug serum concentrations associated with clinically used doses of ceftolozane/tazobactam, fosfomycin and tobramycin. The apparatus, which has been described many times before,15 consists of a central culture chamber for infusion of ceftolozane, tazobactam, fosfomycin or tobramycin, ensuring the correct t1/2, connected via aluminium and silicone tubing to a reservoir containing broth. The central culture chamber is also connected to a waste vessel via silicone tubing. Owing to the differing serum t1/2values of ceftolozane and tazobactam (2.5 and 1 h, respectively) the model was supplemented with ceftolozane throughout each dosing period via a separate dosing chamber to achieve the required concentration–time profiles for both ceftolozane and tazobactam.10,13 The temperature was maintained at 37°C and the broth constantly agitated, with an initial inoculum target of 1–3 × 10⁶ cfu/mL.
Antimicrobials
Ceftolozane and tazobactam were supplied by Merck and Co. Inc., Kenilworth, NJ, USA. Fosfomycin and tobramycin were sourced from Kent Pharmaceuticals and Flynn Pharma LTD, respectively, and solutions were prepared according to the manufacturers’ instructions.
Medium
Unsupplemented Mueller–Hinton broth II (MHB), Millipore was used for all experiments.
Bacteria
Eight strains of P. aeruginosa were used (Table 1). All the strains studied were clinical strains. Ceftolozane/tazobactam MICs were measured in the presence of a fixed 4 mg/L concentration of tazobactam and ranged from 4 to 64 mg/L, fosfomycin MICs ranged from 4 to 1024 mg/L and tobramycin MICs from 0.25 to 8 mg/L. Mechanisms of resistance to ceftolozane/tazobactam where MICs were at or above the EUCAST clinical breakpoints were not studied.3
MICs of the P. aeruginosa strains to ceftolozane/tazobactam, fosfomycin and tobramycin
| Strain number | MIC (mg/L) | ||
|---|---|---|---|
| Ceftolozane/tazobactam | Fosfomycin | Tobramycin | |
| 93171 | 4 | 4 | 0.5 |
| 93176 | 4 | 8 | 0.25 |
| 93169 | 8 | 4 | 1 |
| 93174 | 8 | 4 | 2 |
| 77609 | 8 | 1024 | 1 |
| 93167 | 16 | 4 | 0.5 |
| 77611 | 32 | 96 | 2 |
| 77612 | 64 | 16 | 8 |
| Strain number | MIC (mg/L) | ||
|---|---|---|---|
| Ceftolozane/tazobactam | Fosfomycin | Tobramycin | |
| 93171 | 4 | 4 | 0.5 |
| 93176 | 4 | 8 | 0.25 |
| 93169 | 8 | 4 | 1 |
| 93174 | 8 | 4 | 2 |
| 77609 | 8 | 1024 | 1 |
| 93167 | 16 | 4 | 0.5 |
| 77611 | 32 | 96 | 2 |
| 77612 | 64 | 16 | 8 |
Bacterial killing curves
Viable counts were determined using a spiral plater (Don Whitley, Shipley, UK). Aliquots were plated onto nutrient agar plates after neutralization with β-lactamase for determination of viable counts. Phosphocellulose P81 paper was used to neutralize tobramycin. Fosfomycin was not neutralized prior to counting. The minimum level of detection was 102 cfu/mL. Aliquots were taken hourly from time 0 to 8 , at 12 and 24 h then every 24 h until 168 h (7 days). All experiments were performed in triplicate.
Antibiotic assays
Samples were taken throughout the 7-day simulations for drug assay and stored at −70°C. When samples were stored at −70°C there was a loss of <10% over the storage period. Ceftolozane and tazobactam and concentrations were measured using HPLC methodology. The stationary phase for ceftolozane and tazobactam was Gemini-NX SuC18 (100% 4.6 mm) (Phenomenex, Macclesfield, UK). Mobile phase composition was 98% phosphate buffer, 1% acetonitrile and 1% orthophosphoric acid. The HPLC column was at room temperature. The wavelength was 254 nm for ceftolozane and 220 nm for tazobactam; detection was by UV absorbance using a Dionex UltiMate 3000 variable wavelength detector (Thermo Fisher, Hemel Hempstead, UK) and a flow rate of 1.8 mL/min. Aqueous samples of 10 µL were injected, and retention was 5–6 min for ceftolozane and 3–4 min for tazobactam. The standard curve concentration ranged from 0 to 50 mg/L for both compounds and the lower limit of detection was 1.0 mg/L. Third party internal quality control was employed and assay specificity was determined by performing peak locators runs (analyte plus water only).7
Fosfomycin concentration were measured using bioassay, using Mueller–Hinton agar plus 25 mg/L glucose 6 phosphate. E. coli ATCC 25922 was used as the indicator organism. Fosfomycin calibrators were 4, 8, 16, 32 and 64 mg/L; all test samples, calibrators and internal controls (5 mm wells) were used in triplicate. All levels falling outside calibrator levels were subsequently diluted to fall within the calibration curve. Plates were incubated at 37°C for 18 h. Zone diameters were measured and the line of best fit calculated using the method of Bennett et al.16; test results were extrapolated from the line.
Tobramycin concentrations were measured by competitive inhibition immunoassay using the Indiko Plus QMS System (Thermo Fisher, Hemel Hempstead, UK); the lower limit of detection was 0.4 mg/L.
Measurement of antibacterial effects
Antibacterial effect was measured by log change in viable count over the duration of simulations (log cfu/mL). The antibacterial endpoints were log change in viable count from initial inoculum (time 0) at 24, 48, 72, 96, 120, 144 and 168 h as well as the area-under-the-bacterial kill curve (AUBKC; log cfu/mLh) between time 0 and 24 h and 0 and 168 h. The AUBKC between time 0 and 168 h (AUBKC168) was the co-primary endpoint along with emergence of resistance measured by growth on 4 × MIC plates. Emergence of resistance was assessed using population profiles at time zero (pre-exposure) and every 24 h subsequently up to 168 h.12 Samples were plated onto agar containing no antibiotic and antibiotic × 2, ×4 and × 8MIC to quantify resistant sub-populations; in population studies for ceftolozane, tazobactam was added at a fixed concentration of 4 mg/L. The limit of detection was 2 × 10² cfu/mL, strains from 4 × MIC plates recovered at 168 h were stored and MICs were measured using CLSI agar dilution methodology.
Statistical analysis
Analysis was performed using a paired t-test for two comparators and one-way ANOVA for two or more comparators (Graph Pad Prism v.9.0, Graph Pad Software, CA, USA).
Results
MICs and strains
The eight strains of P. aeruginosa used were isolated from clinical material and had ceftolozane/tazobactam MICs in the range 4–64 mg/L (Table 1). MICs were performed in two different laboratories and in triplicate. Two strains were ceftolozane-tazobactam susceptible with MICs on the EUCAST clinical breakpoint of 4 mg/L, while six were resistant (MIC >4 mg/L). Using CLSI breakpoints, two strains were susceptible (MIC 4 mg/L), three were intermediate (MIC 8 mg/L) and three resistant (MIC ≥16 mg/L). Neither EUCAST nor CLSI have set clinical breakpoints for fosfomycin against P. aeruginosa, however, seven of the strains would be regarded to be in the wild-type MIC distribution using EUCAST epidemiological cut of values (ECOFF), which is ≤128 mg/L. Most strains were tobramycin susceptible with two strains being resistant by EUCAST (MIC > 2 mg/L) criteria and one by CLSI clinical breakpoints (MIC ≥ 8 mg/L).
Pharmacokinetics
There was good correlation between target and measured ceftolozane, tazobactam, osfomycin and tobramycin concentrations. Scatter plots of predicted and observed concentrations for each agent were linear (data not shown) and the measured profiles were described by the following equations: ceftolozane y = (141.2) × exp(−0.24x) – 4.99, R2 = 0.9712; tazobactam y = (60.3) × exp(−0.61x) – 0.6, R2 = 0.9889; osfomycin y = (557.2) × exp(−0.3x) – 5.3, R2 = 0.9599 and tobramycin y = (23.8) × exp(−0.2x) – 1.3, R2 = 0.9748. In all cases x = time in hours and y = drug concentration in mg/L. The simulated concentration–time profiles for each drug are shown in the Supplementary material (Figure S1, available as Supplementary data at JAC Online). The measured pharmacokinetic parameters were: ceftolozane Cmax 114.4 ± 2.5 (95%CI 108.9–119.9) mg/L, t1/22.7 h; tazobactam Cmax 32.0 ± 1.2 (95% CI 28.2–35.7) mg/L, t1/21.1 h; osfomycin Cmax 413 ± 20.0 (95%CI 358.4–469.5), t1/22.5 h and tobramycin Cmax 21.8 ± 0.4 (95% CI 20.9–21.7), t1/23.1 h. The sizes of the dominant pharmacodynamic driver for each strain are shown on Table 2. fT > MIC for ceftolozane ranged from 40% to 100%, osfomycin fAUC/MICs from 3.7 to 937.5 and tobramycin fAUC/MIC from 10.3 to 331.0.
Pharmacodynamic index values for each P. aeruginosa strain for ceftolozane/tazobactam, fosfomycin and tobramycin
| Strain number | Pharmacodynamic index | ||||
|---|---|---|---|---|---|
| Ceftolozane/tazobactam | Fosfomycin | Tobramycin | |||
| fT > MIC(%) | fAUC/MIC | fCmax/MIC | fAUC/MIC | fCmax/MIC | |
| 93171 | 100 | 937.5 | 100 | 165.5 | 40 |
| 93176 | 100 | 468.8 | 50 | 331.0 | 80 |
| 93169 | 100 | 937.5 | 100 | 82.8 | 20 |
| 93174 | 100 | 937.5 | 100 | 41.4 | 10 |
| 77609 | 100 | 3.7 | 0.4 | 27.6 | 6.7 |
| 93167 | 100 | 937.5 | 100 | 165.5 | 40 |
| 77611 | 71 | 39.1 | 4.2 | 41.4 | 10 |
| 77612 | 40 | 234.4 | 25 | 10.3 | 2.5 |
Changes in bacterial load comparisons of monotherapy simulations to combination simulations
Changes in viable count of representative P. aeruginosa strains with ceftolozane/tazobactam MICs of 4, 8, 16, 32 and 64 mg/L are shown on Figure 1(a) (strain 93171, MIC 4 mg/L), Figure 1(b) (strain 93174, MIC 8 mg/L), Figure 1(c) (strain 93167, MIC 16 mg/L), Figure 1(d) (strain 77611, MIC 32 mg/L) and Figure 1e (strain 77612, MIC 64 mg/L). Graphs of the kill kinetics with the other three strains is shown in the Supplementary material (Figure S2). All strains were exposed to ceftolozane/tazobactam alone and the combinations of ceftolozane/tazobactam plosfomycincin and ceftolozane/tazobactam plus tobramycin for 7 days (168 h). Changes in viable count for all eight strains at 3, 6, 12, 24, 72, 120 and 168 h and the AUBKCs 0–24, 0–72, 0–120 and 0–168 h are shown on Table 3—ceftolozane/tazobactam alone, Table 4 ceftolozane/tazobactam plosfomycincin and Table 5—ceftolozane/tazobactam plus tobramycin.
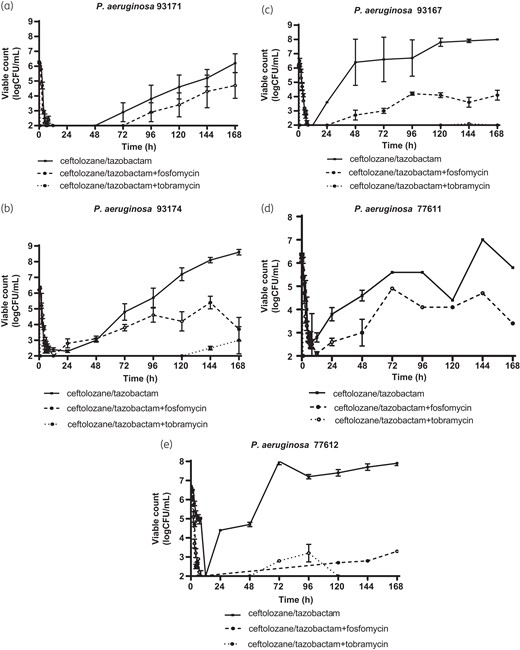
Changes in bacterial load over 7-day ceftolozane/tazobactam (C/T) alone, ceftolozane/tazobactam plus fosfomycin and ceftolozane/tazobactam plus tobramycin simulations with (a) P. aeruginosa 93171 (C/T MIC 4 mg/L), (b) P. aeruginosa 93174 (C/T MIC 8 mg/L), (c) P. aeruginosa 93167 (C/T MIC 16 mg/L), (d) P. aeruginosa 77611 (C/T MIC 32 mg/L) and (e) P. aeruginosa 77612 (C/T MIC 64 mg/L).
Changes in bacterial load over the time of simulations with ceftolozane/tazobactam alone
| Antibacterial effect measure | Strain (ceftolozane/tazobactam MIC mg/L) | |||||||
|---|---|---|---|---|---|---|---|---|
| 93171 (4 mg/L) | 93176 (4 mg/L) | 93169 (8 mg/L) | 93174 (8 mg/L) | 77609 (8 mg/L) | 93617 (16 mg/L) | 76611 (32 mg/L) | 77612 (64 mg/L) | |
| log change in viable count (logCFU/mL) at: | ||||||||
| 3 h | −1.6 ± 0.5 | −1.4 ± 0.4 | −1.4 ± 0.2 | −2.1 ± 0.6 | −0.6 ± 0.1 | −1.3 ± 0.4 | −1.5 ± 0.9 | −0.9 ± 0.1 |
| 6 h | −4.3 ± 0.1 | −3.4 ± 0.6 | −3.7 ± 0.1 | −3.8 ± 0.4 | −3.8 ± 0.1 | −3.5 ± 0.2 | −3.5 ± 0.3 | −1.5 ± 0.3 |
| 12 h | −4.3 ± 0.1 | −4.1 ± 0.2 | −3.6 ± 0.1 | −3.9 ± 0.2 | −4.7 ± 0.1 | −4.1 ± 0.1 | −3.5 ± 0.5 | −4.7 ± 0.1 |
| 24 h | −4.3 ± 0.1 | −3.0 ± 1.1 | −2.3 ± 1.0 | −3.2 ± 0.3 | −4.6 ± 0.1 | −2.5 ± 0.8 | −2.4 ± 0.6 | −2.4 ± 0.3 |
| 72 h | −3.4 ± 1.1 | +0.6 ± 2.2 | +2.1 ± 0.4 | −0.5 ± 1.6 | −4.1 ± 0.1 | +0.5 ± 2.7 | −0.8 | +1.3 ± 0.3 |
| 120 h | −1.7 ± 1.4 | +1.1 ± 1.9 | +2.4 ± 0.1 | +1.0 ± 1.0 | −4.7 ± 0.1 | +1.7 ± 0.4 | −2.0 | +0.8 ± 0.3 |
| 168 h | −0.2 ± 1.1 | +2.2 ± 0.4 | +2.4 ± 0.1 | +2.5 ± 0.3 | −4.7 ± 0.1 | +1.9 ± 0.2 | −0.7 | +1.2 ± 0.2 |
| Area-under-the-bacterial-kill-curve (logCFU/mL.h) between: | ||||||||
| 0–24 h | 14.3 ± 1.1 | 24.4 ± 8.0 | 29.5 ± 9.9 | 23.7 ± 4.1 | 17.9 ± 0.6 | 26.5 ± 3.3 | 34.6 ± 11.1 | 49.0 ± 0.8 |
| 0–72 h | 30.8 ± 22.8 | 114.3 ± 51.6 | 255.9 ± 60.4 | 147.4 ± 47.1 | 31.6 ± 9.1 | 98.7 ± 42.6 | 96.8 ± 16.2 | 213.7 ± 8.7 |
| 0–120 h | 115.9 ± 89.4 | 355.6 ± 131.5 | 561.7 ± 75.3 | 352.7 ± 109.4 | 45.8 ± 9.0 | 444.7 ± 196.1 | 336.9 | 489.3 ± 14.7 |
| 0–168 h | 272.9 ± 139.0 | 632.5 ± 172.5 | 878.6 ± 75.3 | 744.3 ± 51.9 | 57.8 ± 18.9 | 727.5 ± 199.2 | 542.7 | 762.3 ± 19.3 |
Changes in bacterial load over the time of simulations with ceftolozane/tazobactam plus fosfomycin
| Antibacterial effect measure | Strain (fosfomycin MIC mg/L) | |||||||
|---|---|---|---|---|---|---|---|---|
| 93171 (4 mg/L) | 93176 (8 mg/L) | 93169 (4 mg/L) | 93174 (8 mg/L) | 77609 (1024 mg/L) | 93617 (4 mg/L) | 76611 (96 mg/L) | 77612 (16 mg/L) | |
| log change in viable count (logCFU/mL) at: | ||||||||
| 3 h | −3.2 ± 0.1 | −1.6 ± 0.5 | −2.9 ± 0.3 | −1.6 ± 0.2 | −1.6 ± 0.3 | −1.4 ± 0.5 | −2.6 ± 0.6 | −1.7 ± 0.3 |
| 6 h | −3.9 ± 0.6 | −3.4 ± 0.3 | −3.9 ± 0.5 | −3.4 ± 0.2 | −3.5 ± 0.2 | −3.2 ± 0.2 | −3.5 ± 0.7 | −3.9 ± 0.7 |
| 12 h | −4.2 ± 0.1 | −3.9 ± 0.3 | −4.0 ± 0.4 | −4.1 ± 0.2 | −4.4 ± 0.5 | −4.1 ± 0.1 | −4.1 ± 0.4 | −4.5 ± 0.1 |
| 24 h | −4.2 ± 0.1 | −3.0 ± 0.4 | −3.1 ± 0.4 | −3.5 ± 0.7 | −4.7 ± 0.1 | −4.1 ± 0.1 | −3.7 ± 0.4 | −4.3 ± 0.2 |
| 72 h | −3.6 ± 1.1 | −3.6 ± 0.6 | −2.8 ± 0.2 | −2.4 ± 0.6 | −4.7 ± 0.1 | −3.0 ± 0.3 | −1.6 ± 0.1 | −4.3 |
| 120 h | −2.9 ± 1.4 | −4.1 ± 0.1 | −1.5 ± 1.1 | −2.0 ± 1.5 | −4.7 ± 0.1 | −2.1 ± 0.3 | −2.5 | −4.0 |
| 168 h | −1.6 ± 1.5 | −4.1 ± 0.1 | +0.6 ± 0.7 | −2.5 ± 1.3 | −4.7 ± 0.1 | −2.0 ± 0.7 | −3.1 | −3.7 |
| Area-under-the-bacterial-kill-curve (logCFU/mL.h) between: | ||||||||
| 0–24 h | 13.1 ± 1.8 | 18.7 ± 4.1 | 19.4 ± 4.4 | 23.0 ± 6.7 | 10.7 ± 3.8 | 16.6 ± 0.7 | 19.5 ± 4.8 | 16.5 ± 1.1 |
| 0–72 h | 29.3 ± 27.6 | 22.4 ± 9.1 | 85.5 ± 7.8 | 78.8 ± 26.7 | 12.5 ± 5.5 | 24.8 ± 8.0 | 38.7 ± 20.7 | 16.5 ± 1.1 |
| 0–120 h | 73.8 ± 82.3 | 34.2 ± 25.7 | 2.4.8 ± 48.1 | 188.8 ± 55.2 | 17.6 ± 10.5 | 134.4 ± 16.1 | 213.8 | 17.9 |
| 0–168 h | 177.3 ± 138.4 | 38.2 ± 23.9 | 388.2 ± 103.5 | 362.1 ± 31.6 | 40.0 ± 28.6 | 222.8 ± 17.2 | 319.6 | 45.6 |
Changes in bacterial load over the time of simulations with ceftolozane/tazobactam plus tobramycin
| Antibacterial effect measure | Strain (tobramycin MIC mg/L) | |||||||
|---|---|---|---|---|---|---|---|---|
| 93171 (0.5 mg/L) | 93176 (0.25 mg/L) | 93169 (1 mg/L) | 93174 (2 mg/L) | 77609 (3 mg/L) | 93617 (0.5 mg/L) | 76611 (2 mg/L) | 77612 (8 mg/L) | |
| log change in viable count (logCFU/mL) at: | ||||||||
| 3 h | −1.6 ± 0.5 | −1.4 ± 0.4 | −1.4 ± 0.2 | −2.1 ± 0.6 | −0.6 ± 0.1 | −1.3 ± 0.4 | −1.5 ± 0.9 | −0.9 ± 0.1 |
| 6 h | −4.3 ± 0.1 | −3.4 ± 0.6 | −3.7 ± 0.1 | −3.8 ± 0.4 | −3.8 ± 0.1 | −3.5 ± 0.2 | −3.5 ± 0.3 | −1.5 ± 0.3 |
| 12 h | −4.3 ± 0.1 | −4.1 ± 0.2 | −3.6 ± 0.1 | −3.9 ± 0.2 | −4.7 ± 0.1 | −4.1 ± 0.1 | −3.5 ± 0.5 | −4.7 ± 0.1 |
| 24 h | −4.3 ± 0.1 | −3.0 ± 1.1 | −2.3 ± 1.0 | −3.2 ± 0.3 | −4.6 ± 0.1 | −2.5 ± 0.8 | −2.4 ± 0.6 | −2.4 ± 0.3 |
| 72 h | −3.4 ± 1.1 | +0.6 ± 2.2 | +2.1 ± 0.4 | −0.5 ± 1.6 | −4.1 ± 0.1 | +0.5 ± 2.7 | −0.8 | +1.3 ± 0.3 |
| 120 h | −1.7 ± 1.4 | +1.1 ± 1.9 | +2.4 ± 0.1 | +1.0 ± 1.0 | −4.7 ± 0.1 | +1.7 ± 0.4 | −2.0 | +0.8 ± 0.3 |
| 168 h | −0.2 ± 1.1 | +2.2 ± 0.4 | +2.4 ± 0.1 | +2.5 ± 0.3 | −4.7 ± 0.1 | +1.9 ± 0.2 | −0.7 | +1.2 ± 0.2 |
| Area-under-the-bacterial-kill-curve (logCFU/mL.h) between: | ||||||||
| 0–24 h | 14.3 ± 1.1 | 24.4 ± 8.0 | 29.5 ± 9.9 | 23.7 ± 4.1 | 17.9 ± 0.6 | 26.5 ± 3.3 | 34.6 ± 11.1 | 49.0 ± 0.8 |
| 0–72 h | 30.8 ± 22.8 | 114.3 ± 51.6 | 255.9 ± 60.4 | 147.4 ± 47.1 | 31.6 ± 9.1 | 98.7 ± 42.6 | 96.8 ± 16.2 | 213.7 ± 8.7 |
| 0–120 h | 115.9 ± 89.4 | 355.6 ± 131.5 | 561.7 ± 75.3 | 352.7 ± 109.4 | 45.8 ± 9.0 | 444.7 ± 196.1 | 336.9 | 489.3 ± 14.7 |
| 0–168 h | 272.9 ± 139.0 | 632.5 ± 172.5 | 878.6 ± 75.3 | 744.3 ± 51.9 | 57.8 ± 18.9 | 727.5 ± 199.2 | 542.7 | 762.3 ± 19.3 |
When all eight strains were exposed to ceftolozane/tazobactam alone there was a marked early clearance of bacteria such that 3.5–4.5 log reductions in count occurred by 6 h with strains with MIC ≤32 mg/L. A 1.5 log drop in bacterial count was observed with strain 77612, which has a ceftolozane/tazobactam MIC of 64 mg/L (Table 3, Figure 1). In vitro activity was related to strain MIC in the first 24 h of drug exposure being greatest with strains with lower MICs (Table 3 and Figure 2). Subsequently, regrowth occurred with seven strains, the exception being strain 77609 where bacterial burden was suppressed below 3 logs until 168 h. Regrowth started to occur between 12 to 72 h reaching 6–8 logs of growth by the end of the simulations at 168 h with the other strains.
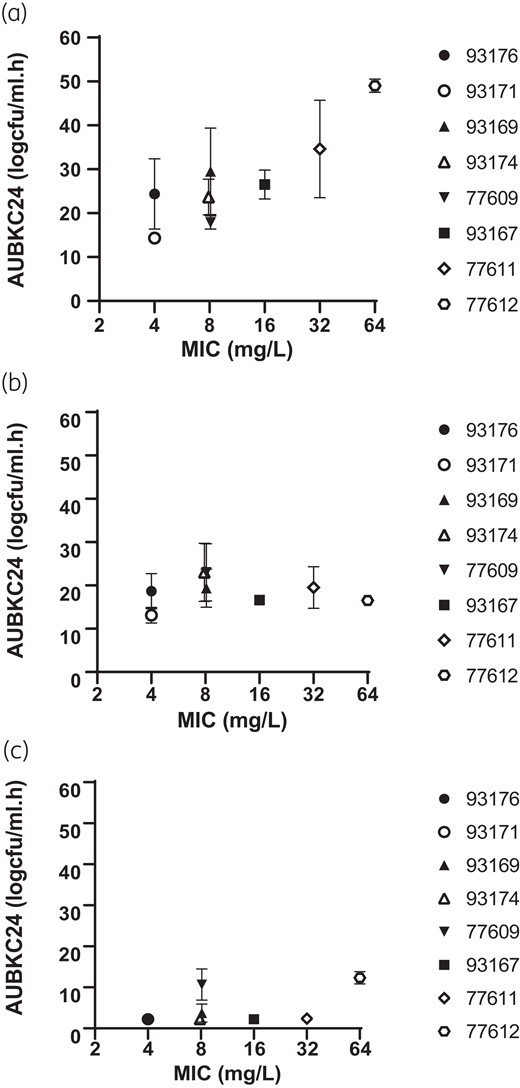
Ceftolozane/tazobactam MIC versus AUBKC24(mg/L.h) for (a) ceftolozane/tazobactam alone, (b) ceftolozane/tazobactam plus fosfomycin and (c) ceftolozane/tazobactam plus tobramycin.
Addition of fosfomycin to ceftolozane/tazobactam had little or no additional effect compared to ceftolozane/tazobactam alone on bacterial clearance during the first 24 h of exposures for the five strains with ceftolozane/tazobactam MICs of ≤8 mg/L (Tables 3 and 4, Figure 1). For the three strains with ceftolozane/tazobactam MICs of 16, 32 and 64 mg/L addition of fosfomycin increased bacterial clearance as measured by log drop in viable count at 24 h and AUBKC0–24 (Tables 3 and 4). Bacterial regrowth also occurred with some strains exposed to the ceftolozane/tazobactam plus fosfomycin combination. With five strains regrowth occurred between 24 and 96 h but consistently reached lower final bacterial burdens at 168 h than with ceftolozane/tazobactam alone with bacterial counts of between 3 and 6 logs. With three strains (93176, 77609 and 77612) no regrowth occurred and final bacterial counts were <2logs (Figure 1, Table 4). The effect of the addition of fosfomycin on bacterial clearance did not seem to be related to the fosfomycin MIC of the strains (Figure 2).
Addition of tobramycin has a notable effect on bacterial burden compared to either ceftolozane or tazobactam alone, or the combination with fosfomycin. Bacterial counts for all strains were reduced by >4 logs with all eight strains by 3 h exposure and remined low for all strains throughout the simulations. Bacterial counts at 168 h were <2 logs with four stains (93171, 93176, 93167, 77611) and <3–4 logs with the remainder (93169, 93174, 77609, 77612) (Table 5, Figure 1) Tobramycin MIC did not have an obvious effect on reduction of bacterial counts with the combination of ceftolozane plus tobramycin (Figure 2).
Changes in population profiles and emergence of resistance comparisons of monotherapy simulations to combination simulations
Population profiles for each strain for ceftolozane/tazobactam alone and the two combinations are shown after 24, 96 and 168 h of drug exposure on Table 6. Counts on MIC × 2 plates are not shown for reasons of clarity. Exposure to ceftolozane/tazobactam alone resulted in bacteria able to grow on ceftolozane/tazobactam 4 × MIC and 8 × MIC containing media after 96 h exposure for five strains and after 168 h for 6 strains. No changes in population profiles were observed with strains 77611 (ceftolozane/tazobactam MIC 32 mg/L) or 77609 (ceftolozane/tazobactam MIC 8 mg/L). Addition of fosfomycin suppressed changes in population profiles with only one strain showing growth on 4 × MIC and 8 × MIC plates after 96 h and two strains with growth on 4 × MIC plates after 168 h. Strain 77612 (ceftolozane/tazobactam MIC 64 mg/L) showed the greatest changes in ceftolozane/tazobactam population profiles. Only one strain (93169, ceftolozane/tazobactam MIC 8 mg/L, tobramycin MIC 1.0 mg/L) showed any changes in population profiles after exposure to ceftolozane/tazobactam plus tobramycin exhibiting growth on ceftolozane/tazobactam 4 × MIC plates after 168 h.
Ceftolozane/tazobactam (C/T) population profiles at 24, 96 and 168 h drug exposure for ceftolozane/tazobactam alone, ceftolozane plus fosfomycin and ceftolozane plus tobramycin
| Bacterial counts on recovery media at: | |||||||
|---|---|---|---|---|---|---|---|
| Strain (ceftolozane MIC mg/L) | Drugs | 24 h | 96 h | 168 h | |||
| MIC × 4 | MIC × 8 | MIC × 4 | MIC × 8 | MIC × 4 | MIC × 8 | ||
| 93171 (4) | C/T alone | <2 | <2 | <2 | <2 | 3.6(n = 2) | 3.2(=2) |
| C/T + fosfomycin | <2 | <2 | <2 | <2 | <2 | <2 | |
| C/T + tobramycin | <2 | <2 | <2 | <2 | <2 | <2 | |
| 93176 (4) | C/T alone | <2 | <2 | 7.7(n = 2) | 7.2(n = 2) | 6.8 ± 0.9 | 6.9 ± 0.9 |
| C/T + fosfomycin | <2 | <2 | <2 | <2 | <2 | <2 | |
| C/T + tobramycin | <2 | <2 | <2 | <2 | <2 | <2 | |
| 93169 (8) | C/T alone | <2 | <2 | 6.0 ± 0.1 | 5.4 ± 0.2 | 7.8 ± 0.1 | 5.4 ± 0.1 |
| C/T + fosfomycin | <2 | <2 | <2 | <2 | 3.3 ± 1.5 | <2 | |
| C/T + tobramycin | <2 | <2 | <2 | <2 | 3.8(n = 2) | <2 | |
| 93174 (8) | C/T alone | <2 | <2 | 4.2 ± 1.6 | 3.5 ± 2.0 | 7.3 ± 0.3 | 5.7 ± 3.0 |
| C/T + fosfomycin | <2 | <2 | <2 | <2 | <2 | <2 | |
| C/T + tobramycin | <2 | <2 | <2 | <2 | <2 | <2 | |
| 77609 (8) | C/T alone | <2 | <2 | <2 | <2 | <2 | <2 |
| C/T + fosfomycin | <2 | <2 | <2 | <2 | <2 | <2 | |
| C/T + tobramycin | <2 | <2 | <2 | <2 | <2 | <2 | |
| 93167 (16) | C/T alone | 8.4(n = 2) | 4.8(n = 4) | 8(n = 2) | 4(n = 2) | 8.0(n = 2) | 7.9(n = 2) |
| C/T + fosfomycin | <2 | <2 | <2 | <2 | <2 | <2 | |
| C/T + tobramycin | <2 | <2 | <2 | <2 | <2 | <2 | |
| 77611 (32) | C/T alone | <2 | <2 | <2 | <2 | <2 | <2 |
| C/T + fosfomycin | <2 | <2 | <2 | <2 | <2 | <2 | |
| C/T + tobramycin | <2 | <2 | <2 | <2 | <2 | <2 | |
| 77612 (64) | C/T alone | 4.2 ± 0.2 | 3.5 ± 0.2 | 6.7 ± 1.8 | 6.5 ± 1.5 | 7.9 ± 0.1 | 7.2 ± 0.9 |
| C/T + fosfomycin | <2 | <2 | 2.6(n = 1) | 2.2(n = 1) | 2.8(n = 1) | 2.8(n = 1) | |
| C/T + tobramycin | <2 | <2 | <2 | <2 | <2 | <2 | |
Discussion
Although in vitro pharmacokinetic models are widely used in pre-clinical development of anti-infectives they also have useful role in in later development and after licencing as they are easily able to simulate human drug pharmacokinetics, drug concentration profiles, combination therapy and durations of drug exposure up to 14 days or longer.17 While clinically prescribed dosing regimens can be simulated to support Phase 2 clinical trials it is more common to use in vitro models to simulate drug treatment of pathogens that are likely to be difficult to perform clinical studies on, often because they are rare or cause infection syndromes not easily amenable to clinical trials.
Ceftolozane/tazobactam resistance among P. aeruginosa remains rare but has been reported in epidemiological surveys in both North America and Europe.4,18 Given the incidence of such strains is less than 5% it is not practicable to perform well designed clinical studies hence use of an in vitro model offers a practical option to define the antibacterial effect of ceftolozane/tazobactam against P. aeruginosa strains with MICs above the clinical breakpoint. Ceftolozane fT > MIC were 100% for stains with MICs in the range 4–16 mg/L and was effective at suppressing growth initially but subsequent regrowth occurred to densities higher than the initial inoculum and changes in population profiles occurred in five out of six stains. The ceftolozane/tazobactam MIC was predictive of bacterial clearance at 24 h but even fT > MIC of 100% were insufficient to suppress growth over 168 h: previously, we have shown that greater drug exposures up to fT > MIC values of 100% are required to suppress P. aeruginosa loads over periods of 72 h with ceftolozane/tazobactam.7
Addition of a second agent to ceftolozane/tazobactam produced increased bacterial clearance and prevented population profile changes with all P. aeruginosa strains except that with a ceftolozane/tazobactam MIC of 64 mg/L. The improvement of antibacterial effect of the combination was most marked with the addition of tobramycin. The ability of aminoglycosides to increase kill and reduce the risk of emergence of resistance when added to β-lactams has been shown a number of times when in vitro models have been used to assess human dosing regimens including with ceftolozane/tazobactam plus amikacin.9,19–21 Pharmacodynamic data on the use of fosfomycin in combination with a β-lactam are far more limited despite it being known for many years that B lactam plus fosfomycin combinations have benefit in terms of killing P. aeruginosa.22 More recently, meropenem plus fosfomycin was shown to be synergistic in chequerboard and pharmacodynamic simulations against P. aeruginosa.23 In our study, fosfomycin also showed benefit having modest but reproducible effects on the reduction bacteria load and suppressing changes in population profiles but other data from pharmacokinetic models with fosfomycin combinations against P. aeruginosa are lacking.
The translational value of data from in vitro pharmacokinetic models to clinical practice needs careful evaluation. Despite the obvious in vitro benefit of B lactam—aminoglycoside combinations clinical evidence of improved outcome in P. aeruginosa blood stream infection or pneumonia is lacking: however, in these situations most of the strains treated will have been susceptible to both agents.24 In contrast with multidrug resistant pathogens, some evidence does support the use of combination therapies6,25 although clinical evidence for the therapy of borderline resistant strains is limited. There are also technical limitations to the study in that fosfomycin could not be neutralized in a similar way to tobramycin and the potential impact of tazobactam on the antibacterial effect of ceftolozane alone and in combination with the other two active agents was not assessed.
In conclusion, this study, which simulated human mean drug concentrations associated with ceftolozane/tazobactam alone and in combination with fosfomycin or tobramycin against strains with ceftolozane/tazobactam MICs higher than the clinical breakpoint, indicated benefit for the combination drug regimens in terms of increased bacterial kill and reduced risk of emergence of resistance. Such data should help therapeutic decision making when treating such strains.
Funding
This study was supported by Merck and Company, Inc., USA.
Transparency declarations
A.P.M. provides consultancy or other services to GSK, Shionogi and Roche.
All other authors: none to declare.
The Bristol Centre for Antimicrobial Research & Evaluation (BCARE) holds research grants from EU IMI (with Evotec, Nosopharm and GSK), MRC, INHR, Merck and Co., InfectoPharm, Roche and BioVersys.
Supplementary data
Figures S1 and S2 are available as Supplementary data at JAC Online.
