


Abstract
Listeriosis is an orphan disease, which is nevertheless fatal in immunocompromised people. CRS0540 is a novel PolC DNA polymerase inhibitor that has demonstrated good in vitro and in vivo activity against Listeria monocytogenes.
Rodent-to-human allometry projection-based human population pharmacokinetics of CRS0540 were used for all studies. CRS0540 pharmacokinetics/pharmacodynamics studies in an intracellular hollow-fibre system model of disseminated listeriosis (HFS-Lister) examined the effect of eight treatment doses, administered daily over 7 days, in duplicate units. Total bacterial burden versus AUC/MIC exposures on each day were modelled using the inhibitory sigmoid Emax model, while CRS0540-resistant bacterial burden was modelled using a quadratic function. Ten thousand-subject Monte Carlo simulations were used to predict an optimal clinical dose for treatment.
The mean CRS0540 intracellular/extracellular AUC0–24 ratio was 34.07 (standard error: 15.70) as measured in the HFS-Lister. CRS0540 demonstrated exposure-dependent bactericidal activity in the HFS-Lister, with the highest exposure killing approximately 5.0 log10 cfu/mL. The free drug AUC0–24/MIC associated with 80% of maximal kill (EC80) was 36.4. Resistance emergence versus AUC/MIC was described by a quadratic function, with resistance amplification at an AUC/MIC of 54.8 and resistance suppression at an AUC/MIC of 119. Monte Carlo simulations demonstrated that for the EC80 target, IV CRS0540 doses of 100 mg/kg achieved PTAs of >90% at MICs up to 1.0 mg/L.
CRS0540 is a promising orphan drug candidate for listeriosis. Future PK/PD studies comparing it with penicillin, the standard of care, could lead to this drug as a new treatment in immunocompromised patients.
Introduction
Listeria monocytogenes causes sporadic outbreaks of infection globally, via contaminated food.1–10 Listeriosis is considered a rare or orphan disease by the FDA (https://rarediseases.info.nih.gov/diseases/6915/listeriosis). During experimental listeriosis in mice, bacteria are internalized by liver and splenic macrophages in which most bacteria are killed.11 However, surviving bacteria regrow in the macrophages and spread to hepatocytes due to uptake by CD8α+ dendritic cells and Kupffer cells, to causes necrosis and inflammation; the bacterial burden in liver and spleen is in the range of 5–9 log10 cfu per organ.12,13 In patients, bacteria cross the intestinal wall at Peyer’s patches to invade the mesenteric lymph nodes and the blood, and then to the liver. The bacteria multiply inside hepatocytes, leading to hepatocyte death by necrosis when bacterial cell burden becomes high, resulting in septicaemia and meningoencephalitis. Immunocompromised people, including pregnant women, infants and the elderly, have a high risk of the septicaemia and meningoencephalitis. The intracellular nature of the infection in monocytes, identified in the first description of the bacteria by Murray et al. 100 years ago and its namesake,1,2 requires novel drugs that can penetrate different infected immune cells, the liver and CNS, and can have a high bactericidal effect. Currently, the disease is treated with IV ampicillin or penicillin G, but no randomized controlled trials have been performed.4,14,15 No pharmacokinetics/pharmacodynamics (PK/PD) studies of disseminated listeriosis have ever been published. As such, optimal treatment for this disease remains unclear.
The hollow-fibre system infection model (HFS) for intracellular infections recapitulates the concentration–time profiles of drugs predicted to occur in patients; in the case of disseminated infection the concentration–time profiles reflect those in the serum. The HFS allows repetitive sampling, which allows time-to-extinction calculations and identification of drug exposures that suppress resistance. Here, we used a model of a monocyte cell line infected with L. monocytogenes (HFS-Lister) to reflect this intracellular nature of listeriosis, and the high bacterial burden achieved by the infection, in PK/PD studies with CRS0540. CRS0540 (Crestone, Inc.) is a thiadiazole urea compound that represents a novel class of small-molecule antibiotics targeting PolC, the replicative DNA polymerase in Gram-positive bacteria. The compound is currently in late-stage preclinical development as an IV and oral antibiotic candidate. CRS0540 has good in vitro and in vivo activity against Staphylococcus species.16 CRS0540 has also demonstrated activity against L. monocytogenes, with MICs of around 1.0 mg/L (unpublished data; C. Mason and U. A. Ochsner). Rodent studies have demonstrated good serum PK, which were used to predict the human CRS0540 PK for HFS-Lister PK/PD studies, even prior to human dosing. The rodent PK were also used to predict human population PK that were used in Monte Carlo simulations to predict human doses for both IV and oral formulations.
Methods
Materials, bacteria and cell lines
A vial of freeze-dried lyophilized powder of the L. monocytogenes (Cat# 15313) was purchased from ATCC (Manassas, VA, USA), rehydrated, inoculated onto brain-heart infusion (BHI) agar and cultured overnight. Colonies were selected, cultured in BHI broth to a log-phase growth, and stored as stock cultures at −80°C either in BHI broth (for short-term use) or BHI broth with 10% glycerol (for long-term storage). The stock culture was quantitated by inoculating on BHI agar plates. The THP-1 human monocytic cell line was purchased from ATCC (TIB-202). THP-1 monocytes were stored at −150°C and habituated for the HFS growth conditions. Cellulosic hollow-fibre cartridges were purchased from FiberCell Systems (Frederick, MD, USA). CRS0540 (Lot number: KLS-102-065) was provided by Crestone Pharma.
CRS0540 MICs
Each MIC assay was performed using broth microdilution and agar dilution methods with Mueller–Hinton Broth (MHB), following EUCAST guidelines for microbroth dilution assay. We used (1) BHI broth and CAMHB fortified with 5% defibrinated horse blood and supplemented with 20 mg/L β-NAD for microbroth dilutions assays; (2) BHI agar; and (3) Mueller–Hinton agar (MHA) fortified with 5% defibrinated horse blood and 20 mg/L β-NAD for agar dilution assays. All media were made fresh. The following CRS0540 concentrations were tested: 0, 0.125, 0.25, 0.5, 1, 2, 4, 8 and 16 mg/L. The microbroth dilution and agar dilution MIC assays were repeated thrice.
PK assumptions
PK studies have been performed in rodents in which 100 mg/kg oral dose achieves a peak concentration of 18.2 mg/L. The human PK parameter estimates used in the HFS-Lister were based on allometry of these animal data since CRS0540 has not been dosed in humans, with a predicted human half-life of 6.74 h. Protein binding in humans is 79%; since free drug concentrations are the pharmacologically active fraction in treatment of bloodstream infections, HFS-Lister studies utilized free drug concentrations.17–19
HFS-Lister model
THP-1 monocytes were grown as described in numerous publications in the past.20–28 With regard to L. monocytogenes, fresh frozen stock prepared at a specific cfu/mL and stored at −80°C, was thawed and then diluted with RPMI with 10% FBS and co-incubated with 1 × 10⁵ cfu/mL of L. monocytogenes with 106 THP-1 cells in a flask for 1 h at 37°C. Non-phagocytosed and non-firmly adherent bacteria were removed by washing and the infected THP-1 cells were added in to the peripheral compartment of the HFS-Lister that had RPMI plus 2% FBS circulating, and placed in the incubator at 37°C. CRS0540 treatment started 1 h after inoculation of peripheral compartments. Eight doses were administered once each day in two HFS-Lister replicates to achieve target AUC targets shown in Table 1, at a half-life of 6.7 h. The central compartments were sampled at 0 (pre-dose), 1, 6, 12, 18 and 23.5 h after the first two doses, then daily for peak and trough for 7 days. After the Day 7 dose, the central compartment was sampled at 0 (pre-dose), 1, 6, 12, 18 and 24 h simultaneously with peripheral compartment for THP-1 counts, THP-1 cell volume and measurement of intracellular CRS0540 concentration. CRS0540 concentration assays are described in the Supplementary Methods, available as Supplementary data at JAC Online. Peripheral compartments were sampled for THP-1 cell counts and bacterial burden, on Days 0, 1, 2, 3, 4, 5, 6 and 7. THP-1 cells were ruptured using 0.5% Triton X-100, and then spread on BHI agar for cfu counts. The cultures were also spread on BHI agar plates supplemented with 4× CRS0540 MIC (4 mg/L) and CRS0540-resistant colonies counted.
Intended (target) versus observed (measured) CRS0540 AUCs in the HFS-Lister study
| Regimen | Intended AUC0–24 (mg·h/L) | Observed AUC0–24 (mg·h/L) | % Bias |
|---|---|---|---|
| 1 | 0 | 0 | 0 |
| 2 | 1.563 | 1.8 | 15.16 |
| 3 | 3.125 | 3.339 | 8.48 |
| 4 | 6.25 | 6.27 | 0.32 |
| 5 | 12.5 | 12.2 | −2.4 |
| 6 | 25 | 24.0 | −4 |
| 7 | 50 | 54.8 | 9.6 |
| 8 | 100 | 106.0 | 6 |
| Summary (95% CI) | (−1.46 to +9.75) |
PK/PD modelling
Monte Carlo simulations
An initial assessment of target attainment was investigated using a one-compartment model for an oral dose as well as for an IV bolus dose. The allometry projections and human plasma PK parameters were a clearance of 0.36 L/h/kg, volume of 3.5 L/kg and an absorption rate constant (Ka) of 1.44 per h. These parameters, and a between-subject coefficient of variation set at 40%, were entered into ADAPT software subroutine PRIOR. For per oral dosing, the bioavailability of 50% identified in rodents was assumed. Ten thousand-subject Monte Carlo experiments of patients treated with 10, 20, 40, 80 and 100 mg/kg each day for 7 days were performed.
Results
MICs
A representative of microbroth dilution MIC assay plate images from three independent MIC studies is shown in Figure S1A. Based on microbroth dilution assays, CRS0540 MICs were 0.5–1.0 mg/L. Representative images of agar dilution MIC assays are shown in Figure S1B and S1C. MIC was consistently 1 mg/L irrespective of the type of agar used.
Drug concentrations achieved in the HFS-Lister
The concentration–time profiles of CRS0540 achieved in the HFS-Lister are shown in Figure 1. The concentrations of CRS0540 were modelled using non-compartmental analyses (NCA), and the AUCs achieved were compared side by side versus the intended (Table 1). Table 1 shows high levels of accuracy, demonstrating that what was intended was achieved, with a % bias CI that crosses zero, meaning that there was no bias. Observed CRS0540 intracellular concentration–time profiles versus extracellular concentration–time profiles based on monocyte volumes measured in infected cells in each HFS-Lister unit were as shown in Figure 2. In all instances, at all sampling times, the intracellular concentration was multiple-fold those in the extracellular compartment. The intracellular-to-extracellular AUC0–24 ratios for each system were as shown in Figure 3(g). There was a tendency for higher penetration ratios for lower extracellular AUCs based on an exponential decline model of AUC/penetration ratio (r2 = 0.95). The mean intracellular/extracellular AUC ratio was 34.07 (standard error: 15.70).
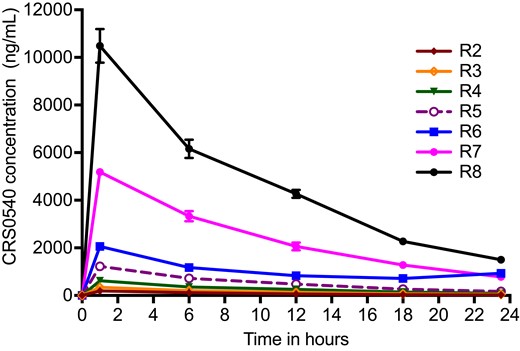
CRS0540 concentration–time profiles achieved in the HFS-Lister. Symbols are mean concentrations while error bars are standard deviations; where no error bars can be seen it is because error bars are narrower than the symbol. R1 is non-treated controls; R2 to R8 are eight doses administered to two HFS-Lister units. The small error bars mean good concordance between HFS-Lister units treated with the same dose, which meets quality control criteria. The average half-life ± standard deviation in all systems was 7.84 ± 0.50 h.
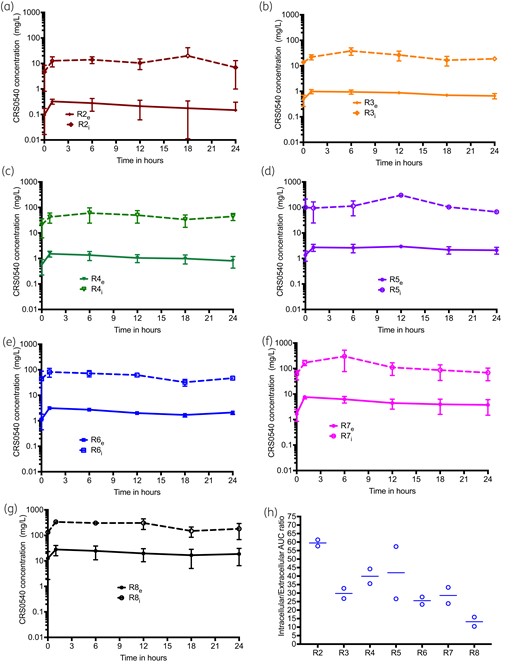
CRS0540 intracellular versus extracellular concentration–time profiles. Error bars are standard deviation and symbols are mean log10 cfu/mL. Concentrations are on a log scale. Shown are the regimens (R1 to R8), subscript e is for extracellular concentration and i is for intracellular. (a–g) Intracellular and extracellular concentration–time profiles for R2 to R8 regimens, showing that the curves are basically parallel for each regimen, with intracellular concentrations >10-fold higher. This means that the clearance of the drugs did not differ, and the high intracellular concentration was driven by drug penetration. (h) Intracellular/extracellular AUC0–24 ratios for each regimen were highest at the lowest extracellular AUCs and were described by an exponential function with a rate constant that was a ratio of 0.19 (r2 = 0.95).
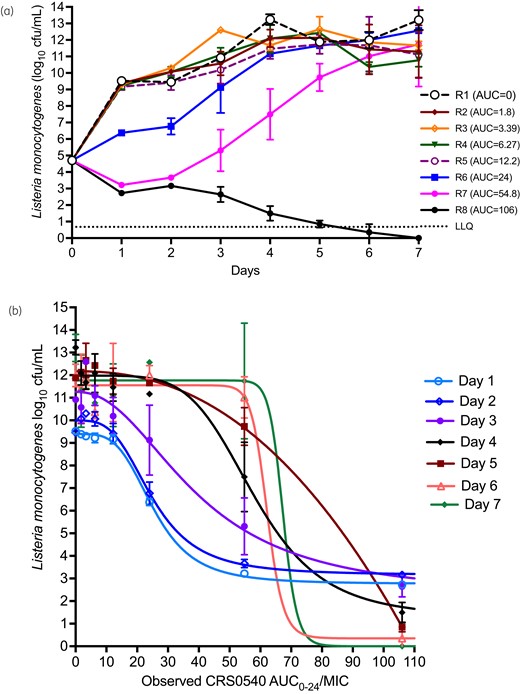
Microbial kill and PK/PD in the HFS-Lister. Error bars are standard deviation and symbols are mean log10 cfu/mL. (a) Non-treated systems grew from just under 5 to 13 log10 cfu/mL, which means THP-1 cells were very permissive of L. monocytogenes growth. Starting at AUCs of 24 mg·h/L, there was considerable microbial effect, and AUCs of 54.8 and 106 mg·h/L killed below Day 0 (stasis) but the former exposure soon demonstrated regrowth, with the highest exposure wiping out the entire bacterial burden. (b) Inhibitory sigmoid Emax model for each sampling day demonstrates adequate exposure-based responses throughout the experiment. LLQ, lower limit of quantification.
HFS-Lister growth and CRS0540 kill kinetics
Figure 3(a) shows that L. monocytogenes grew rapidly in the HFS-Lister, demonstrating that THP-1 cells were very permissive to bacterial growth. The lowest CRS0540 AUCs demonstrated no effect 24 h after the first daily dose, intermediate exposures slowed down the bacterial growth but ultimately failed, while the AUC0–24 of 54.8 mg·h/L killed 2.5 log10 cfu/mL and was thus highly bactericidal. The highest exposure killed below limits of detection by Day 5. Inhibitory sigmoid Emax modelling AUC0–24/MIC versus bacterial burden on each sampling day revealed results shown in Figure 3(b), and parameter estimates shown in Table 2. Day 1 regressions had both the highest r2 and best Akaike information criterion scores, and were thus used to calculate the exposure mediating 80% of maximal kill (EC80), considered optimal since EC100 is on an asymptote. The EC80 was an AUC0–24/MIC of 36.40 (95% CI: 34.85–38.27).
Inhibitory sigmoid Emax parameter estimates
| Day 1 | Day 2 | Day 3 | Day 4 | Day 5 | Day 6 | Day 7 | |
|---|---|---|---|---|---|---|---|
| Mean parameter | |||||||
| Econ log10 cfu/mL | 9.39 | 9.99 | 11.26 | 11.98 | 11.92 | 11.55 | 11.77 |
| Emax log10 cfu/mL | 6.63 | 6.84 | 9.09 | 10.70 | 10.13 | 11.20 | 11.77 |
| H | 3.84 | 3.36 | 2.24 | 5.15 | 24.34 | 23.73 | 29.65 |
| EC50 AUC0–24/MIC | 25.36 | 24.92 | 39.67 | 58.10 | 57.78 | 62.16 | 67.32 |
| 95% CI | |||||||
| Econ log10 cfu/mL | 9.28–9.52 | 9.74–10.24 | 10.55–12.04 | 11.45–12.54 | 11.77–12.39 | 11.00–12.10 | 11.09–12.51 |
| Emax log10 cfu/mL | 6.409–6.863 | 6.392–7.310 | 7.532–11.67 | 9.461–12.53 | 10.41–12.05 | 10.10–12.66 | Imprecise |
| H | 3.154–5.188 | 2.508–5.531 | 1.279–4.124 | 2.282–imprecise | 17.59–34.82 | Imprecise | Imprecise |
| EC50 AUC0–24/MIC | 24.28–26.66 | 22.73–27.69 | 28.79–58.08 | 51.35–67.10 | 56.58 to 59.53 | Imprecise | Imprecise |
| R2 | >0.99 | 0.99 | 0.94 | 0.97 | 0.99 | 0.95 | 0.92 |
| AIC | −49.62 | −22.65 | 9.97 | 3.457 | −9.62 | 9.684 | 19.86 |
AIC, corrected Akaike information criteria score; Econ, effect in non-treated controls, EC50, exposure mediating 50% of maximal kill; Emax, maximal effect; H, Hill slope.
Emergence of resistance
The percentages of CRS0540-resistant population (cfu/mL) on each sampling day were as shown in Figure 4. The figure illustrates a system of ‘U’ curves that change with time in the ‘antibiotic resistance arrow of time’,30 with increased proportion of resistance with time at the vertex of the parabola abscissa coordinate that was an AUC0–24/MIC of 54.8 mg·h/L for all sampling days after Day 2, with maximum rate of 22.5% on Day 7 (Figure 4). This means that this exposure, despite excellent microbial kill, also amplified for resistance emergence. There was no detectable resistance on Day 1. On the other hand, while the EC80 was on the ascending limb of the parabola, the proportion of CRS0540-resistant L. monocytogenes was always below 0.01% (i.e. <0.0001). The roots of this quadratic function, which are the exposures associated with suppression of resistance, were AUC0–24/MIC of 3.64 and 119.16 mg·h/L; since the lower exposure is below that associated with microbial kill, the higher value is considered the true resistance suppression target.
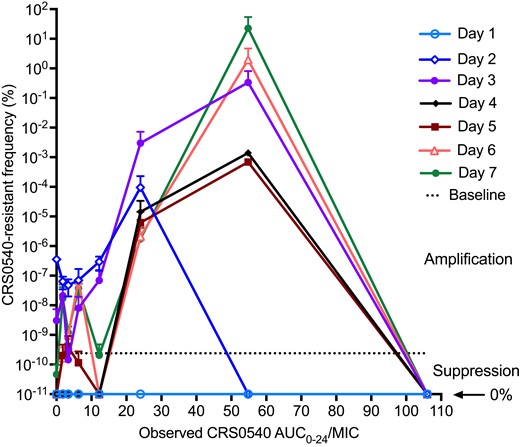
Change in CRS0540-resistant proportion with time and exposure. Symbols are mean and error bars are standard deviation. The y-axis is on a log10 scale, so that 0% is undefined. Day 0, which had the best kill curves, demonstrated no resistance. However, by Day 2 the resistant subpopulation began to increase in proportion and got to above 1% by Day 6 and 22.5% by Day 7, thus trending towards complete replacement of drug-susceptible by drug-resistant population at suboptimal exposures.
Monte Carlo experiments
Monte Carlo experiment PK parameter output is shown in Table 3. The concentration–time profiles achieved in the simulations for 10 mg/kg/day with daily oral and IV dosing were as shown in Figure 5(a and b). The PTAs at each MIC to achieve or exceed a plasma free-drug EC80 or fAUC/MIC ratio of 36.4 (assuming 79% protein binding) were as shown in Figure 5. It was predicted that IV doses of 100 mg/kg would attain PTAs of >90% at MICs up to 1.0 mg/L. We also calculated PTAs for resistance suppression, with results shown in Figure S2.
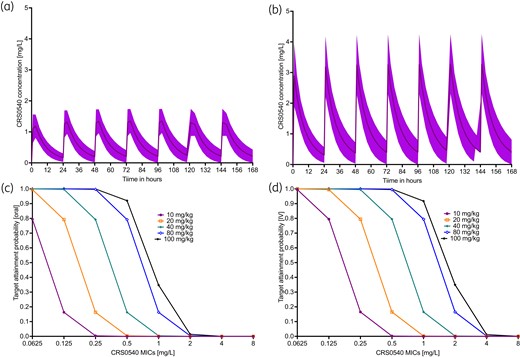
Monte Carlo simulations in 10 000 virtual patients treated with CRS0540. (a) and (c) are for oral doses, while (b) and (d) are for IV doses. All doses were administered on a once-a-day schedule. (a) and (b) Lines are mean concentrations and shaded area is 95% CI after receiving 10 mg/kg/day dose for 1 week. (c) and (d) PTA, which is the proportion of patients achieving or exceeding the EC80 at each MIC, was better with IV dosing, mainly driven by the assumption of 50% bioavailability with oral dosing.
Mean PK parameters and coefficient of variation (%)
| Parameter | Domain of input | IV 10 000 simulated subjects PK | Oral 10 000 simulated subjects PK |
|---|---|---|---|
| Clearance (L/h/kg) | 0.36 (40) | 0.359 (39.94) | 0.362 (39.51) |
| Volume (L/kg) | 3.50 (40) | 3.49 (39.99) | 3.51 (39.70) |
| Ka (h−1) | 1.44 (40) | 1.43 (39.87) |
| Parameter | Domain of input | IV 10 000 simulated subjects PK | Oral 10 000 simulated subjects PK |
|---|---|---|---|
| Clearance (L/h/kg) | 0.36 (40) | 0.359 (39.94) | 0.362 (39.51) |
| Volume (L/kg) | 3.50 (40) | 3.49 (39.99) | 3.51 (39.70) |
| Ka (h−1) | 1.44 (40) | 1.43 (39.87) |
Discussion
Penicillin or ampicillin, sometimes combined with gentamicin, remain the treatment of listeriosis. In patients with β-lactam allergies, trimethoprim/sulfamethoxazole, erythromycin and the fluoroquinolones are used.31 However, these considerations are based mainly on MIC results, case series and reviews of reviews.31,32 This is because listeriosis is a rare disease so that large randomized controlled trials are unlikely. Thus, orphan drugs will need to be tested using PK/PD models. Here, we found that CRS0540 achieved high intracellular concentrations in infected monocytes, with AUCs 34-fold higher than extracellular. For comparison, we have also measured benzylpenicillin intracellular concentrations in the HFS; penicillin intracellular concentrations were much lower than extracellularly.21 Thus, CRS0540 could have PK advantages compared with penicillins. CRS0540 was demonstrated to be effective against intracellular L. monocytogenes, making it one of the first contributions to treatment of this disease in several decades. Future studies would include a head-to-head comparison of CRS0540 versus penicillin, as well as combination with penicillin or trimethoprim/sulfamethoxazole in the HFS-Lister.
CRS0540 was highly bactericidal against L. monocytogenes, in a dose-dependent fashion. Indeed, the highest exposures wiped out the entire bacterial burden in the HFS-Lister. In suboptimal exposures, microbial kill was upended by resistance emergence. CRS0540 resistance versus time was reminiscent of the ‘antibiotic resistance arrow of time’ model, described by a system of parabolas that change with time. We have proposed that perhaps this is due to a resistance process within the path of the ‘arrow of time’ in which efflux pumps and the higher levels of resistance due to chromosomal mutations are merely differently ordered molecular events in a single process (i.e. the middle and end of the same arrow).30 However, we did not test for efflux pumps and mutations in this study, so there could be different explanations for these observations. We also identified CRS0540 AUC/MIC exposures at which all resistance was suppressed. Given that the shape is a parabola, the EC80 for microbial kill while on the ascending limb of the shape nevertheless led to minimal resistance emergence (proportion of 0.0001) while the AUC0–24/MIC of 54.8 mg·h/L was at the vertex. The later exposure is interesting because it initially killed up to 2.5 log10 cfu/mL but then failed on Day 2, so that a large portion of the bacterial burden was drug resistant on Day 7. Thus, dosing strategies should keep drug exposures below this exposure in patients.
Once the optimal exposures are identified, preliminary identification of doses likely to work in patients can be identified using Monte Carlo simulations. This is particularly important in orphan disease whereby testing several doses to find the best dose is limited by numbers of patients, and the undesirability of testing potentially suboptimal doses in patients with potentially fatal disease. We used the EC80 to identify the dose likely to work best in patients. This simulation was based on allometry-predicted human PK and will need to be updated after human population PK data are available.
The HFS-Lister is a platform that can allow for testing of new drugs such as CRS0540, and could be especially useful for orphan diseases. While it does not replicate all features of the disease, it is nevertheless attractive for several reasons. First, it allows testing of large bacterial burdens; resistance emergence is proportional to bacterial burden achieved. Second, it allows repetitive sampling, in a similar fashion to daily blood cultures in patients, so that the time to extinction of the bacterial population can be precisely documented. Third, repetitive sampling is also important in documenting the evolution of resistance. Fourth, these systems faithfully recapitulate the PK expected in patients, allowing a more direct translation. Thus, it is a highly tractable model for drug development for treatment of disseminated listeriosis.
CRS0540 has been evaluated in a murine septicaemia study with the objective of evaluating efficacy against a systemic L. monocytogenes infection (unpublished data; U. A. Ochsner). Mice were acclimatised for 5 days prior to being infected with L. monocytogenes strain ATCC #19111 via IV tail vein injection. Treatment groups (n = 6) were administered CRS0540 doses ranging from 25 to 300 mg/kg at 1 and 5 h post infection. The positive control groups were administered linezolid or azithromycin at 25, 50 or 100 mg/kg. Mice were monitored for survival over 7 days and the dose required to protect 50% of the infected animals (PD50) was calculated using a joint probit non-linear regression analysis. Non-treated control mice had a 3 day median survival and 0% survival at 7 days. Mice receiving CRS0540 at a dose of 100 mg/kg or greater demonstrated 100% survival over the 7 days; the PD50 value was 70.7 mg/kg. Positive controls, linezolid- and azithromycin-treated mice, demonstrated both reduced median and overall survival compared with those treated with CRS0540. The CRS0540 efficacy in mice as well as in the HFS-Lister at exposures achieved by similar doses means that the drug has demonstrated potency in two orthogonal models.
There are some limitations to our studies. First, we used a single strain of L. monocytogenes in our HFS-Lister. Several different strains, especially with different MICs, will be needed for a more robust estimate of the AUC/MIC associated with optimal effect. However, while S. aureus is a different pathogen from L. monocytogenes, murine S. aureus thigh infection and pneumonia models identified CRS0540 target exposures (fAUC0–24/MICs) of 35.9 and 36.2,16 which is virtually identical to the listeriosis fAUC0–24/MICs of 36.40 identified here. Moreover, the murine study of listeriosis utilized a different strain from the one used in the HFS-Lister, and still identified a similar protective final dose. Second, we did not perform dose-fractionation studies in the HFS-Lister. We assumed the PK/PD index linked to efficacy would be similar to that seen with S. aureus infections.16 Finally, the human PK we used were allometrically derived from animal studies, and thus the final doses may change when human population PK data become available.
In summary, here we demonstrate that CRS0540 is highly bactericidal in treatment of disseminated listeriosis. The predicted optimal dose in patients is 100 mg/kg. Thus, CRS0540 is a promising agent for testing in the clinic.
Funding
This work was supported by Crestone, Inc., Boulder, CO, USA.
Transparency declarations
S.P., M.C., S.A., D.H. and T.G. are employees of Praedicare Inc. C.M., M.G., W.R., T.H., J.D., X.S., T.J. and U.A.O. are employees of Crestone, Inc.
Author contributions
U.A.O., C.M., J.D., D.H.: design of experiments and protocol and execution of experiments. S.P., M.C., S.A.: HFS and MIC experiments. D.H.: LC-MS/MS analysis, PK modelling and simulations. T.G.: study design, PK/PD modelling and dose-finding Monte Carlo experiments. T.G., U.A.O. and C.M. wrote the first draft, after which all authors contributed to writing the manuscript, edited it, and approved the final version of the manuscript. All authors took part in the revision of the manuscript in response to reviewer comments.
Supplementary data
Supplementary Methods and Figures S1 to S3 are available as Supplementary data at JAC Online.
