


Abstract
Numerous studies have characterized the 13-valent pneumococcal conjugate vaccine (PCV13) programme’s beneficial effects on acute otitis media (AOM) and acute sinusitis (AS) rates in children; however, few studies have examined the impact on adults.
This retrospective cohort study evaluates the overall effect of the PCV13 immunization programme on the incidence of AOM and AS at the population level.
Health administrative databases were linked to assess outpatient visits, hospitalizations and antibiotic utilization from 2000 to 2018. Multivariable Poisson regression was used to evaluate the impact of the PCV13 vaccine programme (2011–18) compared with the pre-PCV13 era (2000–10), overall and by age.
From 2000 to 2018, the incidence of AOM decreased by 50% (62 to 31 per 1000 population) while sinusitis decreased by 18% (33 to 27 per 1000 population). In the PCV13 era, the incidence of AOM declined [incidence rate ratio (IRR): 0.70; 95% CI: 0.70–0.70], in parallel with decreased incidence of antibiotic utilization (IRR: 0.65; 95% CI: 0.64–0.65). A reduction was also observed in the incidence of AS during the PCV13 era compared with the pre-PCV13 era (IRR: 0.88; 95% CI: 0.88–0.88), mainly driven by declines among those younger than 65 years of age. In contrast, an increase in AS incidence was noted in individuals aged ≥65 years (IRR: 1.03; 95% CI: 1.02–1.03). A decrease in antibiotic prescription rates for sinusitis was observed for those under 65 years of age.
The PCV13 immunization programme is associated with a reduction in the incidence of AOM and AS. Moreover, the associated use of antibiotics for these diagnoses has comparably decreased across paediatric, as well as adult populations.
Introduction
Annually, 709 million acute otitis media (AOM) cases occur worldwide. Of these, 51% are recorded in children under 5 years of age.1 Moreover, an estimated 80% of children experience their first episode of AOM before their third birthday.2 As such, AOM is a common reason for physician visits and antibiotic prescriptions among children and, in some instances, for hospitalizations.3 In contrast, acute sinusitis (AS) commonly afflicts adults, with approximately one in every eight adults affected.4 AS results in 17 million outpatient visits and 12% of adult antibiotic prescriptions in the USA, making it one of the top 10 reasons for physician visits among adults prior to the advent of the pneumococcal conjugate vaccine (PCV) and resulting in substantial direct and indirect costs to the healthcare system.5–7
While the underlying aetiology of AOM and AS infections is mainly viral, these infections can also be caused by common bacteria, namely Streptococcus pneumoniae, non-typeable Haemophilus influenzae and Moraxella catarrhalis.8,9 Currently, no vaccines are available for protection against non-typeable H. influenzae10 or M. catarrhalis.11 The 23-valent pneumococcal polysaccharide vaccine (PPV23), targeting S. pneumoniae, has been used for high-risk persons older than 2 years and those 65 years of age and older since the 1980s globally, including British Columbia (BC), Canada. In the early 2000s, the 7-valent PCV (PCV7), containing serotypes 4, 6B, 9V, 14, 18C, 19F and 23F, was added to infant immunization programmes worldwide. In BC, PCV7 was introduced into our childhood immunization programmes in 2003, and in 2010, the 13-valent PCV (PCV13), containing six additional serotypes (1, 3, 5, 6A, 7F and 19A), replaced PCV7. The PCV7 vaccine was introduced mainly for protection against invasive pneumococcal disease, but post-marketing studies found that it also resulted in a decline of AOM episodes in children12–15 and AS episodes in children and adults.16–18
Few studies have reported on rates of AOM and AS after the introduction of a PCV13 vaccine programme, with most showing a decline in infection rates following the introduction.3,19–22 As AOM and AS often lead to antibiotic prescriptions, the impact of PCV13 on associated antibiotic use, at the population level, is also of high interest.21,22 We have previously published a study on the impact of the PCV13 immunization programme on rates of invasive pneumococcal disease.23 In this retrospective population-based cohort study, we have examined the annual trends in the incidence of non-invasive pneumococcal diseases, specifically AOM and AS, along with antibiotic utilization for these infections, within the population of BC, before and after the introduction of the PCV13 vaccine, using healthcare administrative databases.
Methods
Data sources
Longitudinal data on BC residents were obtained from: the Discharge Abstract Database (DAD) for hospital separations; Medical Services Plan (MSP) payment information for outpatient physician visits; the PharmaNET database for dispensed outpatient prescriptions and vaccines; and the consolidation file for demographic data (e.g. age and sex), as well as vital statistics.24–27 Vaccine coverage was estimated based on vaccine doses recorded in immunization registries and the PharmaNET database.28 Data were assembled and de-identified by Population Data BC (PopData-BC). Denominator data on population estimates were obtained from Statistics Canada and BC Statistics.29
Antibiotics were defined by the Anatomical Therapeutic Chemical (ATC) classification system developed by the WHO and included six major classes: tetracyclines (J01A), penicillins (J01C), cephalosporins (J01D), sulphonamides and trimethoprim (J01E), macrolides (J01F) and quinolones (J01M).30 A prescription was linked to AOM or AS based on the international classification of diseases (ICD)-9 or -10 diagnostic codes using an algorithm that matched the date on which the medication was dispensed to a practitioner service date within 5 days prior.
Study population
Our study cohort consisted of individuals that resided in BC from 1st January 2000 to 31st December 2018; BC residents with MSP public health insurance coverage can access physicians, specialists, pharmacy and hospital care for their needs. Tourists, short-term visitors or residents from a different Canadian province without MSP coverage are not included in this cohort. AOM was defined by the ICD-9 codes 381 and 382 and ICD-10 codes H65 and H69, while AS was defined by the ICD-9 code 461 and the ICD-10 code J01. Primary and secondary diagnostic codes were used to identify a case.12,14 For each episode of infection, the date of the first medical visit was considered the index date.21 As a single infection can result in multiple physician visits, a 14 day period following an index date was defined as a single episode. Following this 14 day period, the next physician visit defined the index date of a subsequent episode.
PCV13 vaccine coverage
From 2003 to 2010, the PCV7 vaccine was routinely used in the BC provincial infant immunization programme with a 3 + 1 dosing schedule at 2, 4, 6 and 12–18 months. The schedule was adapted to a 2 + 1 dosing schedule in 2007, given at 2, 4 and 12–15 months, based on emerging global data on vaccine effectiveness.31 In 2010, the PCV7 vaccine was replaced by the PCV13 vaccine with a 2 + 1 dosing schedule. Those residing in BC who received at least one dose of the PCV13 vaccine were accounted for in the PCV13 vaccine coverage. PCV7 and PCV13 coverage was high, reaching 79%–83% in the vaccine-eligible population.
Outcomes
The primary study outcome was to evaluate the incidence of AOM and AS infections after introduction of the PCV13 vaccine in the childhood immunization programme in 2010. The secondary objective was to evaluate associated antibiotic utilization for these two infections.
Statistical analysis
Annual crude and age-specific incidence for all outcomes were calculated by dividing cases by population size, obtained from Statistics Canada. For age-specific reporting, cases were grouped according to the following categories: 0–2 years, 3–5 years, 6–17 years, 18–49 years, 50–64 years and 65 years and above. Overall and age-specific incidence rate ratios (IRRs) were calculated using the formula listed in Appendix S1, available as Supplementary data at JAC Online, comparing before (2000–10) and after (2011–18) the PCV13 vaccine programme introduction. Rates of antibiotic utilization were calculated per 1000 population for overall use, and further stratified by class and age group across the two time periods of interest. Changes in the annual rates from 2000 to 2018 were evaluated using the Cochran–Armitage test by age group and outcome.
IRRs for all outcomes (overall and by age, i.e. dependent variable) were estimated using univariate and multivariable Poisson regression to assess the impact of the vaccine programme (i.e. independent variable). Models were adjusted for the PCV7 vaccine. Missing data were accounted for by simple imputation.
Confounder adjustment
As previously noted, the PCV7 vaccine was the first pneumococcal conjugate vaccine introduced in BC’s infant immunization programme. When PCV7 was replaced by PCV13, six additional pneumococcal serotypes were included in the infant immunization programme. As such, it is important to adjust for the effect of the seven serotypes from PCV7 included in PCV13 to ascertain the effect of the additional six serotypes in the PCV13 programme. Therefore, we included a dichotomous variable with 0 for the years in the absence of the PCV7 programme (2000–03) and 1 for the presence of the PCV7 programme (2004–10) in BC’s infant immunization programme.32 This is a population-level analysis and individual-level factors did not change over time and were not accounted for.
Sensitivity analyses
For the sensitivity analyses, we assessed the impact of the annual proportion of individuals with PCV13 vaccination on AOM and AS trends. Data analyses were performed using SAS® 9.4 (SAS Institute Inc., Cary, NC, USA) and R v4.0.2.
Ethics
The study was approved by the University of British Columbia Institutional Review Board (IRB) and the BC Ministry of Health (Ethics Number: H15-01114). No patient consent was required as we used de-identified administrative billing data.
Results
In 2000, 4 million individuals resided in BC (49.6% of whom were male), with ages 0–2 years (3%), 3–5 years (3%), 6–17 years (15%), 18–49 years (48%), 50–64 years (16%) and 65 years and above (12%). In 2018, BC’s population had increased to 5 million (49.6% male), with ages 0–2 years (3%), 3–5 years (3%), 6–17 years (12%), 18–49 years (43%), 50–64 years (21%) and 65 years and above (18%). Median age increased from 37.5 years in 2000 to 42.2 years in 2018.
AOM
During the 19 year study period, a total of 3 629 811 AOM episodes were reported from 1 550 192 individuals. AOM episodes were most common among individuals aged 6–17 years (25.6%), followed by 18–49 years (24.1%), 3–5 years (17.1%), 0–2 years (15.5%), 50–64 years (10.0%) and 65 years and above (7.8%). Approximately 28% of episodes had received at least one age-appropriate pneumococcal vaccine dose (Table 1). Median age increased from 8 years in 2000 to 17 years in 2018 (Table S1 and Figure S1) for episodes treated within the outpatient setting; in contrast, hospitalization median age remained the same (6 years) for the study duration (Figure S1). Over time, declines in recurrent AOM infections and mean visits were noted across outpatient and inpatient settings after the PCV13 introduction (Figures S2 to S5).
Characteristics of the AOM and AS cohorts in BC, Canada (2000–18)
| Case details | AOM (N = 3 629 811) | AS (N = 2 725 014) | ||
|---|---|---|---|---|
| n | % | n | % | |
| Sex | ||||
| Female | 1 854 225 | 51.08 | 1 721 777 | 63.18 |
| Male | 1 775 442 | 48.91 | 1 003 131 | 36.81 |
| Unknown | 144 | 0.00 | 106 | 0.00 |
| Age groups (years) | ||||
| 0–2 | 561 317 | 15.46 | 37 686 | 1.38 |
| 3–5 | 620 381 | 17.09 | 47 846 | 1.76 |
| 6–17 | 928 482 | 25.58 | 215 218 | 7.90 |
| 18–49 | 872 863 | 24.05 | 1 420 148 | 52.12 |
| 50–64 | 364 535 | 10.04 | 660 629 | 24.24 |
| ≥65 | 282 224 | 7.78 | 343 482 | 12.60 |
| Neighbourhood income quintile | ||||
| Low | 712 982 | 19.64 | 524 049 | 19.23 |
| 2 | 736 665 | 20.29 | 554 948 | 20.36 |
| 3 | 745 074 | 20.53 | 562 416 | 20.64 |
| 4 | 751 229 | 20.70 | 569 157 | 20.89 |
| High | 677 062 | 18.65 | 511 186 | 18.76 |
| Missing | 7836 | 0.19 | 3258 | 0.12 |
| Residency type | ||||
| Urban | 3 190 797 | 87.91 | 2 413 272 | 88.56 |
| Rural | 432 043 | 11.90 | 307 927 | 11.30 |
| Missing | 6971 | 0.19 | 3815 | 0.14 |
| Vaccination | ||||
| At least one dose | 1 005 362 | 27.70 | 192 731 | 7.07 |
| PCV7 | 637 970 | 17.50 | 64 691 | 2.37 |
| PCV13 | 366 630 | 10.10 | 27 660 | 1.02 |
| Presence of any Charlson comorbidity | 147 832 | 4.07 | 221 621 | 7.53 |
| Mortality (one year) | 3976 | 0.16 | 1417 | 0.05 |
As seen in Figure 1, the AOM incidence rate declined by 50% from 62 per 1000 people in 2000 to 31 per 1000 people in 2018 (P < 0.0001). From 2000 to 2018, a 61% reduction was seen in those aged 0–2 years, followed by a 50% reduction in those aged 3–5 years and a 48% reduction in those 6–17 years. A decline in the adult population was also seen: a 36% reduction in those aged 18–49 years, followed by a 28% decrease in those aged 50–64 years and a 27% decline in individuals 65 years and older.
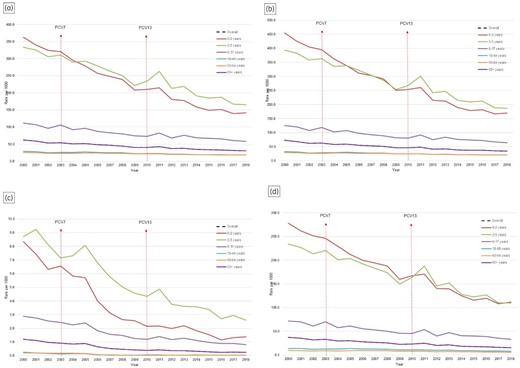
AOM incidence from 2000 to 2018 in BC, Canada. (a) All episodes; (b) outpatient setting; (c) inpatient setting; (d) antibiotic utilization.
Following the PCV13 introduction in the infant immunization programme, a relative reduction (IRR: 0.70; 95% CI: 0.70–0.70) was observed in the rate ratios at the population level compared with the pre-PCV13 era (Table 2). Children aged 0–2 years experienced the highest decline in outpatient (IRR: 0.57; 95% CI: 0.57–0.58) and inpatient (IRR: 0.34; 95% CI: 0.33–0.36) settings, followed by 3–5-year-olds in outpatient (IRR: 0.68; 95% CI: 0.68–0.69) and inpatient (IRR: 0.50; 95% CI: 0.48–0.52) settings and 6–17-year-olds in outpatient (IRR: 0.73; 95% CI: 0.73–0.74) and inpatient (IRR: 0.52; 95% CI: 0.50–0.53) settings. Significant reductions were observed among adults aged 18–49 years in outpatient (IRR: 0.77; 95% CI: 0.77–0.78) and inpatient (IRR: 0.34; 95% CI: 0.31–0.37) settings, followed by 50–64-year-olds in outpatient (IRR: 0.82; 95% CI: 0.81–0.82) and inpatient (IRR: 0.34; 95% CI: 0.30–0.38) settings and among those 65 years and older in outpatient (IRR: 0.85; 95% CI: 0.85–0.86) and inpatient (IRR: 0.40; 95% CI: 0.35–0.45) settings.
Overall and age-specific case counts and incidence of AOM by all episodes and settings and antibiotic utilization before and after introduction of PCV13 in BC, Canada
| Age group (years) | 2000 | 2018 | Decline in rates (%) | P valuea | IRR (95% CI) | ||||
|---|---|---|---|---|---|---|---|---|---|
| Cases | Rate per 1000 | Cases | Rate per 1000 | PCV13 programme | Adjusted for PCV7 programme | PCV13 vaccine coverageb | |||
| All episodes | |||||||||
| Overall | 250 797 | 62.09 | 154 042 | 30.80 | 50.39 | <0.0001 | 0.70 (0.70–0.70) | 0.76 (0.76–0.76) | 0.90 (0.89–0.90) |
| 0–2 | 46 191 | 362.79 | 19 226 | 141.99 | 60.86 | <0.0001 | 0.59 (0.58–0.59) | 0.66 (0.66–0.67) | 0.99 (0.99–0.99) |
| 3–5 | 47 354 | 333.48 | 23 430 | 165.29 | 50.44 | <0.0001 | 0.70 (0.70–0.70) | 0.76 (0.75–0.76) | 0.99 (0.99–0.99) |
| 6–17 | 70 247 | 111.52 | 34 455 | 58.34 | 47.68 | <0.0001 | 0.74 (0.74–0.75) | 0.81 (0.81–0.82) | 0.98 (0.97–0.98) |
| 18–49 | 56 862 | 29.03 | 39 656 | 18.49 | 36.29 | <0.0001 | 0.78 (0.78–0.78) | 0.81 (0.80–0.81) | — |
| 50–64 | 16 667 | 25.55 | 19 771 | 18.37 | 28.09 | <0.0001 | 0.83 (0.82–0.83) | 0.84 (0.84–0.85) | 0.06 (0.06–0.07) |
| ≥65 | 13 475 | 26.37 | 17 502 | 19.17 | 27.30 | <0.0001 | 0.86 (0.86–0.87) | 0.87 (0.87–0.88) | 0.17 (0.15–0.19) |
| All outpatient visits | |||||||||
| Overall | 292 488 | 72.41 | 174 173 | 34.83 | 51.91 | <0.0001 | 0.69 (0.69–0.69) | 0.75 (0.75–0.75) | 0.89 (0.89–0.89) |
| 0–2 | 57 969 | 455.30 | 22 979 | 169.70 | 62.73 | <0.0001 | 0.57 (0.57–0.58) | 0.65 (0.65–0.66) | 0.99 (0.99–0.99) |
| 3–5 | 55 950 | 394.01 | 26 501 | 186.95 | 52.55 | <0.0001 | 0.68 (0.68–0.69) | 0.75 (0.74–0.75) | 0.99 (0.99–0.99) |
| 6–17 | 79 128 | 125.61 | 37 912 | 64.20 | 48.89 | <0.0001 | 0.73 (0.73–0.74) | 0.81 (0.80–0.81) | 0.97 (0.97–0.97) |
| 18–49 | 64 458 | 32.90 | 44 452 | 20.73 | 37.00 | <0.0001 | 0.77 (0.77–0.78) | 0.80 (0.80–0.81) | — |
| 50–64 | 19 291 | 29.57 | 22 344 | 20.76 | 29.79 | <0.0001 | 0.82 (0.81–0.82) | 0.83 (0.83–0.84) | 0.05 (0.05–0.06) |
| ≥65 | 15 691 | 30.71 | 19 983 | 21.89 | 28.71 | <0.0001 | 0.85 (0.85–0.86) | 0.87 (0.86–0.87) | 0.15 (0.14–0.17) |
| All inpatient visits | |||||||||
| Overall | 4848 | 1.20 | 1212 | 0.24 | 79.81 | <0.0001 | 0.42 (0.41–0.43) | 0.53 (0.52–0.54) | 0.76 (0.75–0.76) |
| 0–2 | 1064 | 8.36 | 186 | 1.37 | 83.56 | <0.0001 | 0.34 (0.33–0.36) | 0.46 (0.44–0.49) | 0.98 (0.98–0.98) |
| 3–5 | 1237 | 8.71 | 368 | 2.60 | 70.20 | <0.0001 | 0.50 (0.48–0.52) | 0.57 (0.55–0.60) | 0.99 (0.99–0.99) |
| 6–17 | 1821 | 2.89 | 485 | 0.82 | 71.59 | <0.0001 | 0.52 (0.50–0.53) | 0.62 (0.60–0.64) | 0.95 (0.94–0.95) |
| 18–49 | 406 | 0.21 | 78 | 0.04 | 82.45 | <0.0001 | 0.34 (0.31–0.37) | 0.50 (0.45–0.55) | — |
| 50–64 | 173 | 0.27 | 40 | 0.04 | 85.98 | <0.0001 | 0.34 (0.30–0.38) | 0.49 (0.43–0.56) | — |
| ≥65 | 147 | 0.29 | 55 | 0.06 | 79.06 | <0.0001 | 0.4 (0.35–0.45) | 0.56 (0.49–0.65) | — |
| All antibiotic prescriptions | |||||||||
| Overall | 151 180 | 37.43 | 77 793 | 15.55 | 58.44 | <0.0001 | 0.65 (0.64–0.65) | 0.71 (0.71–0.71) | 0.87 (0.87–0.87) |
| 0–2 | 35 413 | 278.14 | 15 149 | 111.88 | 59.78 | <0.0001 | 0.60 (0.59–0.60) | 0.67 (0.67–0.68) | 0.99 (0.99–0.99) |
| 3–5 | 33 203 | 233.82 | 15 601 | 110.06 | 52.93 | <0.0001 | 0.68 (0.68–0.69) | 0.75 (0.74–0.75) | 0.99 (0.99–0.99) |
| 6–17 | 45 100 | 71.60 | 19 518 | 33.05 | 53.84 | <0.0001 | 0.70 (0.70–0.71) | 0.78 (0.77–0.78) | 0.97 (0.97–0.97) |
| 18–49 | 27 745 | 14.16 | 17 261 | 8.05 | 43.17 | <0.0001 | 0.74 (0.74–0.75) | 0.76 (0.75–0.76) | — |
| 50–64 | 6322 | 9.69 | 6400 | 5.95 | 38.63 | <0.0001 | 0.77 (0.76–0.78) | 0.78 (0.77–0.79) | 0.01 (0.01–0.02) |
| ≥65 | 3396 | 6.65 | 3864 | 4.23 | 36.31 | <0.0001 | 0.83 (0.81-0.84) | 0.84 (0.83-0.86) | 0.07 (0.06-0.09) |
—, could not compute.
P value is reported from Cochran–Armitage test.
Sensitivity analysis.
Over the study period, a decrease was observed in antibiotic utilization for AOM across all ages. At the population level, a 59% decline was found in utilization rates from 2000 to 2018, with the paediatric population accounting heavily for this trend. A negative association was found to underlie this decreasing trend whereby as age increased, the magnitude of decline in antibiotic use reduced (i.e. 60% decrease in children aged 0–2 years; 36% in adults aged 65 years and older) (Figure 1). In the PCV13 era, significant reductions were noted in rates of antibiotic use across different age groups compared with the pre-PCV13 era (IRR: 0.65; 95% CI: 0.64–0.65) at the population level, with the same negative association underlying increasing age and decreasing reduction in magnitude of utilization (Table 2). Similar declines were noted across antibiotic classes of macrolides, sulphonamides, quinolones and cephalosporins (Table S2 and Figure S6). In contrast, significant increases in use were observed with tetracycline use in the PCV13 era compared with the pre-PCV13 era. The utilization trends of penicillins varied across different age groups in the PCV13 era; reduced utilization was observed for those aged under 50 years and a slight increase in use was recorded among those aged 50 years and older.
Sensitivity analysis
After adjusting for the effects of the PCV7 programme and PCV13 vaccine coverage, results of this analysis were attenuated but remained in the same direction for both the incidence of AOM infections (IRR: 0.76; 95% CI: 0.76–0.76) and associated antibiotic utilization (IRR: 0.71; 95% CI: 0.71–0.71) (Table 2).
AS
From 2000 to 2018, 2 725 014 AS episodes were reported from 1 296 262 individuals (Table 1). AS episodes by age group comprised those aged 0–2 years (1.4%), 3–5 years (1.8%), 6–17 years (8.0%), 18–49 years (52.1%), 50–64 years (24.2%) and 65 years and above (12.6%). AS mostly affected the adult population (89%) and the highest burden was experienced by those aged 18–49 years (Table 1). Female patients were predominantly affected (63%) compared with male patients. Nearly 7% of AS cases had received at least one age-appropriate pneumococcal vaccine dose. For AS, the median age increased from 40 years in 2000 to 47 years in 2018 for the outpatient setting and ranged from 42 years in 2000 to 58 years in 2018 for hospitalization (Table S3 and Figure S7).
Although no significant changes in sex distribution were noted in the outpatient setting, male patients were more likely to be hospitalized from AS in the PCV13 era compared with the pre-PCV13 period (data not shown). Over time, significant declines in recurrent AS infections and mean visits were noted in all ages, including those 65 years and older, across outpatient and inpatient settings after the introduction of PCV13 (Figures S8 to S11).
Figure 2 demonstrates a modest reduction in the incidence of AS for all episodes between 2000 (33 per 1000 people) and 2018 (27 per 1000 people) (P < 0.0001), largely driven by significant reductions among children. Incidence rates declined by 66% in those aged 0–2 years, followed by a 54% reduction in those aged 3–5 years and a 46% decline among those aged 6–17 years. Modest declines were observed in those aged 18–49 years (21%) and in the 50–64 years age group (13%). In contrast, a small increase of 5% was observed among elderly patients.
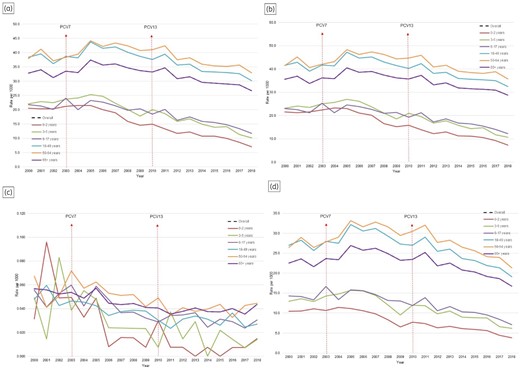
AS incidence from 2000 to 2018 in BC, Canada. (a) All episodes; (b) outpatient setting; (c) inpatient setting; (d) antibiotic utilization.
In the PCV13 era, a modest reduction (IRR: 0.88; 95% CI: 0.88–0.88) was observed at the population level compared with the pre-PCV13 era (Table 3). All age groups among children and adults aged 18–64 years primarily drove these declines. Among children, those aged 0–2 years experienced the highest decline in outpatient (IRR: 0.55; 95% CI: 0.54–0.56) and inpatient (IRR: 0.21; 95% CI: 0.10–0.45) settings, followed by 3–5-year-olds in outpatient (IRR: 0.64; 95% CI: 0.63–0.66) and inpatient (IRR: 0.50; 95% CI: 0.29–0.84) settings and 6–17-year-olds in outpatient (IRR: 0.68; 95% CI: 0.56–0.83) and inpatient (IRR: 0.68; 95% CI: 0.56–0.83) settings. Modest declines were observed in those aged 18–49 years in outpatient (IRR: 0.86; 95% CI: 0.86–0.86) and inpatient (IRR: 0.69; 95% CI: 0.62–0.78) settings and 50–64-year-olds in outpatient (IRR: 0.89; 95% CI: 0.88–0.89) and inpatient (IRR: 0.73; 95% CI: 0.64–0.85) settings. While a small significant increase was noted in elderly patients in the outpatient setting (IRR: 1.03; 95% CI: 1.02–1.03), no significant changes (IRR: 1.03; 95% CI: 0.91–1.19) were observed in the inpatient setting.
Overall and age-specific case counts and incidence of AS by all episodes and settings and antibiotic utilization before and after introduction of 13-valent pneumococcal conjugate vaccines in BC, Canada
| Age group (years) | 2000 | 2018 | Decline in rates (%) | P valuea | IRR (95% CI) | ||||
|---|---|---|---|---|---|---|---|---|---|
| Cases | Rate per 1000 | Cases | Rate per 1000 | PCV13 programme | Adjusted for PCV7 programme | PCV13 vaccine coverageb | |||
| All episodes | |||||||||
| Overall | 132 251 | 32.74 | 133 671 | 26.73 | 18.37 | <0.0001 | 0.88 (0.88–0.88) | 0.86 (0.86–0.86) | 0.96 (0.96–0.96) |
| 0–2 | 2613 | 20.52 | 953 | 7.04 | 65.71 | <0.0001 | 0.55 (0.54–0.57) | 0.58 (0.57–0.60) | 0.99 (0.99–0.99) |
| 3–5 | 3135 | 22.08 | 1441 | 10.17 | 53.95 | <0.0001 | 0.65 (0.64–0.66) | 0.66 (0.64–0.67) | 0.99 (0.99–0.99) |
| 6–17 | 13 724 | 21.79 | 6915 | 11.71 | 46.25 | <0.0001 | 0.74 (0.73–0.74) | 0.75 (0.74–0.76) | 0.97 (0.97–0.97) |
| 18–49 | 75 201 | 38.39 | 64 871 | 30.25 | 21.19 | <0.0001 | 0.86 (0.86–0.87) | 0.85 (0.85–0.85) | 0.02 (0.01–0.02) |
| 50–64 | 24 709 | 37.87 | 35 436 | 32.92 | 13.07 | <0.0001 | 0.89 (0.89–0.90) | 0.87 (0.87–0.88) | 0.12 (0.11–0.13) |
| ≥65 | 12 864 | 25.18 | 24 055 | 26.35 | −4.67 | <0.0001 | 1.03 (1.02–1.04) | 1.00 (0.99–1.01) | 1.03 (0.94–1.12) |
| All outpatient visits | |||||||||
| Overall | 143 226 | 35.46 | 144 090 | 28.81 | 18.75 | <0.0001 | 0.88 (0.87–0.88) | 0.86 (0.86–0.86) | 0.96 (0.96–0.96) |
| 0–2 | 2742 | 21.54 | 992 | 7.33 | 65.98 | <0.0001 | 0.55 (0.54–0.56) | 0.58 (0.56–0.59) | 0.99 (0.99–0.99) |
| 3–5 | 3294 | 23.20 | 1513 | 10.67 | 53.99 | <0.0001 | 0.64 (0.63–0.66) | 0.65 (0.64–0.66) | 0.99 (0.99–0.99) |
| 6–17 | 14 470 | 22.97 | 7269 | 12.31 | 46.42 | <0.0001 | 0.74 (0.73–0.74) | 0.75 (0.74–0.76) | 0.97 (0.97–0.97) |
| 18–49 | 81 371 | 41.54 | 69 573 | 32.44 | 21.89 | <0.0001 | 0.86 (0.86–0.86) | 0.85 (0.84–0.85) | 0.01 (0.01–0.01) |
| 50–64 | 27 072 | 41.49 | 38 416 | 35.69 | 13.98 | <0.0001 | 0.89 (0.88–0.89) | 0.87 (0.86–0.87) | 0.11 (0.10–0.12) |
| ≥65 | 14 271 | 27.93 | 26 327 | 28.84 | −3.26 | <0.0001 | 1.03 (1.02–1.03) | 1.00 (0.99–1.01) | 1.00 (0.92–1.09) |
| All inpatient visits | |||||||||
| Overall | 228 | 0.06 | 218 | 0.04 | 22.78 | <0.0001 | 0.79 (0.74–0.84) | 0.85 (0.79–0.91) | 0.94 (0.92–0.96) |
| 0–2 | <5 | 0.03 | <5 | 0.01 | 52.99 | <0.0001 | 0.21 (0.10–0.45) | 0.33 (0.15–0.75) | 0.97 (0.95–0.98) |
| 3–5 | 7 | 0.05 | <5 | 0.01 | 71.38 | <0.0001 | 0.5 (0.29–0.84) | 0.60 (0.34–1.09) | 0.98 (0.97–0.99) |
| 6–17 | 35 | 0.06 | 18 | 0.03 | 45.14 | <0.0001 | 0.68 (0.56–0.83) | 0.75 (0.60–0.94) | 0.97 (0.95–0.99) |
| 18–49 | 94 | 0.05 | 58 | 0.03 | 43.63 | <0.0001 | 0.69 (0.62–0.78) | 0.77 (0.68–0.87) | 0.00 (0.00–0.01) |
| 50–64 | 44 | 0.07 | 48 | 0.04 | 33.87 | <0.0001 | 0.73 (0.64–0.85) | 0.76 (0.65–0.89) | 0.06 (0.01–0.60) |
| ≥65 | 44 | 0.09 | 90 | 0.10 | −14.49 | <0.0001 | 1.03 (0.91–1.17) | 1.04 (0.90–1.19) | 3.75 (0.77–18.3) |
| All antibiotic prescriptions (PharmaNET) | |||||||||
| Overall | 90 703 | 22.46 | 83 868 | 16.77 | 25.32 | <0.0001 | 0.85 (0.85–0.86) | 0.83 (0.83–0.83) | 0.94 (0.94–0.95) |
| 0–2 | 1332 | 10.46 | 519 | 3.83 | 63.36 | <0.0001 | 0.59 (0.57–0.61) | 0.62 (0.60–0.64) | 0.99 (0.99–0.99) |
| 3–5 | 1841 | 12.96 | 875 | 6.17 | 52.39 | <0.0001 | 0.66 (0.65–0.68) | 0.66 (0.65–0.68) | 0.99 (0.99–0.99) |
| 6–17 | 9011 | 14.30 | 4209 | 7.13 | 50.18 | <0.0001 | 0.72 (0.71–0.73) | 0.73 (0.72–0.74) | 0.97 (0.96–0.97) |
| 18–49 | 52 934 | 27.02 | 40 956 | 19.10 | 29.32 | <0.0001 | 0.83 (0.83–0.83) | 0.81 (0.80–0.81) | — |
| 50–64 | 17 274 | 26.48 | 22 976 | 21.35 | 19.37 | <0.0001 | 0.87 (0.87–0.88) | 0.84 (0.83–0.84) | 0.04 (0.04–0.04) |
| ≥65 | 8309 | 16.26 | 14 333 | 15.70 | 3.44 | <0.0001 | 1.02 (1.01–1.03) | 0.98 (0.97–0.99) | 0.44 (0.40–0.50) |
—, could not compute.
P value is reported from Cochran–Armitage test.
Sensitivity analysis.
A significant reduction in rates was observed in the use of antibiotics for AS from 2000 to 2018 across most age groups: 26% at the population level, 63% in those aged 0–2 years, 52% in the 3–5 years age group, 50% among 6–17-year-olds, 29% in the 18–49 year age group and 19% among 50–64-year-olds, in contrast to a small increase of 3% noted among those aged 65 years and older (Figure 2 and Table 3). In the PCV13 era, significant reductions were noted in rates of antibiotic use across different age groups compared with the pre-PCV13 era, at the population level (IRR: 0.85; 95% CI: 0.85–0.86), in the 0–2 year age group (IRR: 0.59; 95% CI: 0.57–0.61), for 3–5-year-olds (IRR: 0.66; 95% CI: 0.65–0.68), 6–17-year-olds (IRR: 0.72; 95% CI: 0.71–0.73), in the 18–49 years age group (IRR: 0.83; 95% CI: 0.83–0.83) and for those 50–64 years old (IRR: 0.87; 95% CI: 0.87–0.88), whereas a small yet significant increase (IRR: 1.02; 95% CI: 1.01–1.03) was seen in individuals 65 years and older (Table 3). Similar declines were noted across antibiotic classes like macrolides, sulphonamides, quinolones and cephalosporins (Table S4 and Figure S12). In contrast, significant increases were observed in tetracycline use in the PCV13 era compared with the pre-PCV13 era (Table S4 and Figure S12). Interestingly, penicillin utilization varied in different age groups in the PCV13 era; decreased use was seen in the paediatric population whereas a significant increase was noted in the adult population (Table S4 and Figure S12).
Sensitivity analysis
After adjusting for the introduction of the PCV7 programme, PCV13 benefits on the incidence of AS infections and associated antibiotic utilization diminished slightly but the direction remained the same (Table 3). When assessing the impact of PCV13 coverage, the impact was in the same direction as the pre-and-post comparison of the PCV13 programme.
Discussion
To the best of our knowledge, this is the first large retrospective population-based cohort study reporting on the epidemiology of AOM and AS infections using outpatient and inpatient data in the post-PCV13 era. We found significant reductions in the incidence of both AOM and AS, as well as associated antibiotic utilization among all children following the introduction of PVC13 to the infant immunization programme.
We observed a 41% reduction in AOM and a 45% reduction in AS in the vaccine target population, that is, those under 2 years of age, after the introduction of PCV13; these declining rates and magnitude are in line with other studies.19,21 Moreover, results remained robust after adjusting for the introduction of the PCV7 vaccine, indicating a beneficial effect of long-term use of PCVs in the infant immunization programme. Along with substantial reductions in the incidence of infection, we identified a significant decline in associated antibiotic utilization in the PCV13 era, when compared with the pre-PCV13 era. Similar declines in AOM incidence and associated antibiotic use were reported in a UK-based outpatient setting study in the paediatric population.21 However, our study was ecological in nature and although it has merits in terms of the large population size, this is balanced by the fact that we cannot draw conclusions about individual patients from population data.
The use of a conjugate pneumococcal vaccine is thought to reduce nasopharyngeal acquisition of vaccine serotypes, leading to a decline in their transmission.33 Following the introduction of PCV7 to the infant immunization programme, several studies reported reduction in AOM and AS in the paediatric population.12–18 In a study by De Wal et al.,14 a 13.2% reduction in AOM cases was observed in Quebec, Canada after 3 years of the PCV7 childhood immunization programme. Furthermore, Brook et al.16,17 reported that elimination of vaccine-serotype AS after the PCV7 vaccine introduction was followed by an increase in non-vaccine PCV7-serotype AS along with H. influenzae in children and adults.
Our study corroborates data from global studies reporting similar reductions in AOM and AS in paediatric populations, as well as the adult population, after PCV13 programme implementation.18,19,21,34 For instance, in a study by Mendes et al.,34 authors reported reductions in the proportion of PCV13 vaccine-serotype S. pneumoniae isolates of middle ear fluid and sinus secretion among adults following the PCV13 introduction. We have observed comparable reduction in AOM and AS rates in adults, post-PCV13 introduction, in this study. Recent reports indicate an increase in AOM and AS among children and adults from H. influenzae in the PCV13 era.35,36 It is important to monitor the incidence rates of AOM and AS; if they increase like in other jurisdictions it necessitates the microbial surveillance of these syndromes.
Immunization programmes for measles and pertussis have demonstrated that they have not only reduced the infections in the population but also delayed the onset of the first episode by increasing the median age of these vaccine-preventable infections.37 Likewise, we observed an increase in the median age of AOM and AS infections in outpatient settings over time, demonstrating the impact of the PCV7 and PCV13 immunization programme on non-invasive pneumococcal infections within the younger population.37
Our study has several limitations. First and foremost is the ecological nature of the study, which requires cautious interpretation of the data. Secondly, all of our cases are based on ICD-9 or -10 diagnostic codes from administrative databases such as physician billing and hospital discharge databases, which means there is a chance of misclassifying the diagnosis, resulting in an underestimation of the magnitude of AOM and AS rates. However, as these diagnostic codes are highly specific, we would not have incorrectly included non-cases when defining episodes. In addition, no diagnostic code changes were observed during the study duration, so our case definition has remained stable during the study, allowing for the before-and-after PCV13 programme comparisons. Also, we could have missed AOM and AS cases, if they did not seek physician or hospital care or they went to pharmacists or natural health practitioners (i.e. non-physicians). Thirdly, we did not have access to laboratory data for these cases, so we are unable to confirm the aetiology. However, the reductions observed in our study are similar to other studies where laboratory data were used in case definition.19,38 Fourthly, we only adjusted for one confounder (PCV7 vaccine programme) in our sensitivity analysis, thus there may be other residual confounders we may have missed. Our final limitation concerns the use of the PharmaNET system to extract antibiotic prescription data; as this index only contains records of dispensation, these analyses may underestimate the number of prescriptions. Furthermore, levels of compliance to prescribed antibiotics are unknown.
Despite these limitations, our study provides long-term estimates—observed in real-world settings—on the impact of conjugate pneumococcal vaccines, which are in line with the other global laboratory surveillance studies.20,35,39,40 The incidence of AOM and AS infections, as well as their associated antibiotic use, have significantly reduced in the PCV13 era, demonstrating the health advantages of the PCV13 childhood vaccination programme at the population level. As laboratory surveillance-based studies have reported on the impact of PCV13 vaccine on the change in microbial spectrum causing AOM and AS, including these syndromes in the provincial surveillance programme will have an immense impact on understanding the need for a higher-valence pneumococcal vaccine.
Conclusions
Both AOM and AS are common infections resulting in a high number of outpatient visits and antibiotic utilization. Sequential introduction of PCV7 and PCV13 vaccines in the infant immunization programme led to significant reductions in AOM and AS infections in the vaccine target population, as well as in other age groups in the paediatric population, but only a small decline was seen in the older age groups.
Acknowledgements
N.K.V. thanks Dr Mawuena Binka (BC Centre for Disease) and Ross Duncan (BC Academic Health Science Network) for their review and valuable feedback to improve this paper. All inferences, opinions and conclusions drawn in this research are those of the authors and do not reflect the opinions or policies of the Data Steward(s) from PopData-BC.
Funding
This study was funded by an independent investigator grant (WI204518) from Pfizer, Canada. The funders had no role in the data analyses and interpretation.
Transparency declarations
Population Data BC subsidized funding for the data that was required for N.K.V.’s doctoral thesis project. The remainder of the data acquisition costs and a portion of N.K.V.’s salary were covered by an independent investigator grant (WI204518) from Pfizer, Canada to Dr Marra. The funders had no role in the data analyses and interpretation. All other authors: none to declare.
Author contributions
N.K.V. conceptualized the study under the guidance of F.M., conducted the literature review, data cleaning, analysis and interpretation and wrote the initial draft. A.S. drafted antibiotic case capture codes and reviewed the manuscript. C.R. and M.S. provided guidance on confounding adjustment and sensitivity analyses. C.R., M.S., D.M.P. and F.M. provided critical feedback on data interpretation and the final draft of the manuscript.
Supplementary data
Tables S1 to S4, Figures S1 to S12 and Appendix S1 are available as Supplementary data at JAC Online.
References
British Columbia Vital Statistics Agency. Vital Statistics Deaths. V2. In: Population Data BC. British Columbia Ministry of Health. Data Extract. BC Vital Statistics Agency;
British Columbia Ministry of Health. Medical Services Plan (MSP) Payment Information File. V2. In: Population Data BC. British Columbia Ministry of Health. Data Extract. MOH;
Canadian Institute for Health Information. Discharge Abstract Database (Hospital Separations). V2. In: Population Data BC. British Columbia Ministry of Health. Data Extract. MOH;
British Columbia Ministry of Health. Consolidation File (MSP Registration & Premium Billing). V2. In: Population Data BC. British Columbia Ministry of Health. Data Extract. MOH;
British Columbia Ministry of Health. PharmaNET. V2. In: BC Ministry of Health. British Columbia Ministry of Health. Data Extract. Data Stewardship Committee;
Statistics Canada. Canadian Demographics at a Glance;
WHO Collaborating Centre for Drug Statistics Methodology. ATC/DDD index. https://www.whocc.no/atc_ddd_index/.
