


Abstract
The use of (val)ganciclovir is complicated by toxicity, slow response to treatment and acquired resistance.
To evaluate a routine therapeutic drug monitoring (TDM) programme for ganciclovir in a transplant patient population.
An observational study was performed in transplant recipients from June 2018 to February 2020. Dose adjustments were advised by the TDM pharmacist as part of clinical care. For prophylaxis, a trough concentration (Cmin) of 1–2 mg/L and an AUC24h of >50 mg·h/L were aimed for. For treatment, a Cmin of 2–4 mg/L and an AUC24h of 80–120 mg·h/L were aimed for.
Ninety-five solid organ and stem cell transplant patients were enrolled. Overall, 450 serum concentrations were measured; with a median of 3 (IQR = 2–6) per patient. The median Cmin and AUC24h in the treatment and prophylaxis groups were 2.0 mg/L and 90 mg·h/L and 0.9 mg/L and 67 mg·h/L, respectively. Significant intra- and inter-patient patient variability was observed. The majority of patients with an estimated glomerular filtration rate of more than 120 mL/min/1.73 m2 and patients on continuous veno-venous haemofiltration showed underexposure. The highest Cmin and AUC24h values were associated with the increase in liver function markers and decline in WBC count as compared with baseline.
This study revealed that a standard weight and kidney function-based dosing regimen resulted in highly variable ganciclovir Cmin and under- and over-exposure were observed in patients on dialysis and in patients with increased renal function. Clearly there is a need to explore the impact of concentration-guided dose adjustments in a prospective study.
Introduction
Cytomegalovirus (CMV) and human herpesvirus 6 (HHV-6) are both debilitating viruses that can cause significant morbidity and mortality in those undergoing solid organ transplantation (SOT) and HSCT.1 The prevalence of latent CMV infection is reported to be between 40% and 80% in adults.2 CMV reactivation/infection is defined when CMV DNA is detected in blood or other tissues.3 CMV reactivation and subsequent disease is a common complication in SOT patients.4 CMV disease can manifest as hepatitis, colitis, nephritis, pneumonitis, encephalitis or retinitis and is potentially life-threatening.5,6 HHV-6 can cause a similar range of symptoms, yet these are usually limited to HSCT patients.
Ganciclovir (IV administered) and its prodrug valganciclovir [orally (PO) administered] are used for (pre-emptive) therapy in HSCT and for prophylaxis and therapy in SOT.7,8 By using (val)ganciclovir prophylaxis, reactivations and severe disease are largely prevented.4,9–11 Ganciclovir is known for its myelosuppression: neutropenia, anaemia, leucopenia and thrombocytopenia.4,12–14 More severe toxicity may occur in patients with renal impairment as the elimination of the drug is prolonged.15–17 The rates of myelotoxicity vary between specific patient groups; in HSCT the rates seem to be 50% and higher, while in SOT much lower rates of around 10% have been reported.4,18,19 Granulocyte colony-stimulating factor (‘G-CSF’) has been used to compensate for the myelotoxicity caused by ganciclovir.20,21 Still, the occurrence of myelotoxicity can lead to clinician-directed dose reduction. However, underdosing and subtherapeutic ganciclovir trough concentration (Cmin) may lead to drug-acquired resistance (mutations in genes UL97 and UL54), which can result in the use of the more toxic foscarnet.13,22–24 For these reasons, adequate (val)ganciclovir exposure is necessary and therapeutic drug monitoring (TDM) has therefore been proposed.23,25
Ganciclovir has low protein binding (1%–2%) and the majority is eliminated via glomerular filtration. Cases have been reported where therapy supported by TDM has been considered beneficial.26–29 However, evidence from well-designed studies to support either concentration-based and/or AUC24h-based dosing is scarce.30 Recently, in a study on the therapeutic use of (val)ganciclovir in children, a range of 80–120 mg·h/L was suggested.31 Simulations showed low target attainment in this patient group for treatment.31 For prevention, the dose seemed sufficient to reach 40–60 mg·h/L.31 In another study, evaluating (val)ganciclovir TDM in a tertiary care hospital, a high variability of ganciclovir concentrations was observed and peak concentrations lower than 8.47 mg/L and higher than 11.86 mg/L were connected to poorer outcomes.32 No in vitro/in vivo studies presenting pharmacokinetic/pharmacodynamic targets have been published to date. It has been suggested to monitor ganciclovir exposure in specific patient groups, where variable exposure is expected, in a recent review.33 Due to the lack of data, there is a need for observational studies to collect data on drug concentration, toxicity and treatment outcome to guide the design of a randomized trial on dose optimization of ganciclovir.
The aim of this observational study was to evaluate TDM of ganciclovir and to describe the inter- and intra-individual variability in Cmin and AUC24h, and also analyse their potential association with toxicity in those undergoing SOT and HSCT.
Materials and methods
Study design
An observational cohort study was conducted at the University Medical Center Groningen (UMCG; Groningen, The Netherlands) in the Departments of Nephrology, Internal Medicine, Lung Diseases and Tuberculosis, Cardiology and Haematology. This study was evaluated and approved by the Medical Ethics Review Board of the UMCG (METc 2018/020).
Patients
Patients were included if they met all of the following inclusion criteria: age ≥18 years; had undergone SOT or HSCT; and were receiving ganciclovir IV or valganciclovir PO as prophylaxis or treatment, having had TDM performed as a part of routine care.
For all patients, the following data were collected: sex, age, weight, height, underlying disease, type of transplantation, if applicable concomitant dialysis [continuous veno-venous haemofiltration (CVVH) or intermittent haemodialysis (IHD)], administration route, dosing, timing and start and stop dates of (val)ganciclovir medication. Laboratory values, such as ganciclovir concentration, WBC, red blood cell, platelet and neutrophil counts, total bilirubin, AST, ALT, alkaline phosphatase (ALP), GGT, creatinine and estimated glomerular filtration rate (eGFR) (calculated with CKD-EPI), were recorded at regular patient visits. If applicable, adverse events (anaemia, diarrhoea, neutropenia and bone marrow suppression) and cause of death were recorded.
TDM of ganciclovir
TDM was routinely performed in the laboratory of the Department of Clinical Pharmacy and Pharmacology (UMCG). The hospital guidance was to start TDM for all patients receiving (val)ganciclovir after 24 h from start of therapy. A single concentration before the next dose was recommended and, if possible, a concentration 1 h after the administration. After ganciclovir concentrations were measured, the attending TDM pharmacist recommended further dosage changes and follow-up TDM if needed. Ganciclovir concentrations were measured three times weekly (Mondays, Wednesdays and Fridays) in the laboratory of the Department of Clinical Pharmacy and Pharmacology.
Ganciclovir serum concentration was determined using a validated LC-MS/MS method. The method was based on a published ganciclovir LC-MS/MS assay and was modified to increase sensitivity.34 For sample preparation, 500 μL of precipitation reagent (including the stable isotope-labelled internal standard 0.05 mg/L ganciclovir[2H5] in methanol; Alsachim, Illkirch, France) was added to 100 μL of serum. After vortexing (1 min) and centrifugation (5 min at 9500 rcf), 0.2 μL of supernatant was injected into the LC-MS/MS system (Thermo Fisher Scientific triple quadrupole Quantiva MS/MS system with a Thermo Fisher Scientific Vanquish UPLC system, Waltham, MA, USA). The mobile phase consisted of 0.1% formic acid in water and acetonitrile. The analytical range was 0.1–16 mg/L (r2 = 0.9966, lower limit of quantification = 0.1 mg/L and upper limit of quantification = 16 mg/L). Accuracy and precision ranged from −1% to 3% and from 1% to 12.6%, respectively. The within-run precision ranged from 1.3% to 3.6% and the between-run precision ranged from 0.5% to 3.0%.
For AUC24h calculation, patient age, weight, height, eGFRs, (val)ganciclovir doses and times of administration and ganciclovir concentrations were used. This was done by performing Bayesian simulations in MW/Pharm++ (Version 1.8, Mediware, Prague, Czech Republic), which used ganciclovir population pharmacokinetic parameters: volume of distribution of 0.74 ± 0.15 L/kg (lean body mass), elimination rate constant of 0.023 ± 0.1 h−1, renal elimination rate constant of 0.0021 ± 0.001 h−1/(mL/min/1.73 m2) and, for valganciclovir PO, bioavailability of 0.6 ± 0.15, absorption rate constant of 0.895 ± 4.64 h−1 and lag time of 0.825 ± 1.54 h.35
During clinical care, serum concentrations mainly in the elimination phase were obtained. If a mid-level was obtained, MW/Pharm++ was used to estimate the Cmin value; Cmax was only used to calculate AUC24h. For this study, Cmin targets of 1–2 mg/L for prophylaxis and 2–4 mg/L for treatment were defined. An AUC24h of >50 mg·h/L for prophylaxis and 80–120 mg·h/L for treatment was aimed for. These targets were defined using available evidence and expert opinion.30,36 For prophylaxis, only a lower bound for AUC was defined as this has been shown to be connected to viral suppression.30 For treatment, an upper range was defined to prevent potential toxicity.4,18,19 Ganciclovir initial Cmin and AUC24h were included to examine the correlation between Cmin and AUC24h.
Ganciclovir-associated adverse effects
For the dependent variables ALP, ALT, AST, GGT, total bilirubin and creatinine, the increase was calculated in every patient: highest concentration minus baseline (i.e. first concentration). To evaluate myelosuppression, the drop in WBC and platelet count was calculated (absolute value): lowest measurement minus the first measurement (baseline). For the independent variables, highest ganciclovir AUC24h and Cmin during the treatment period, age, weight, sex and transplant type were used. Linear regression was used for univariable and multivariable analysis and only variables giving a significant association (P ≤ 0.25) with dependent variables in the univariable analysis were included in the multivariable model as Cmin was used to calculate AUC24h. Highest Cmin and AUC24h were included separately into the multivariable analysis. A P value of <0.05 was considered statistically significant in the multivariable analysis. For the description of occurrence of adverse events, a 20% decrease in WBC count, a 50% decrease in platelet count and an increase up to twice the upper limit of normal for liver function markers ALP, ALT, AST, GGT and bilirubin were considered to be adverse drug effects in the absence of other explanations.
Antimicrobial stewardship audit evaluating therapy with (val)ganciclovir
An audit was performed for the initial (val)ganciclovir dosing regimen obtained from patient notes to verify adherence to the hospital guideline. An inappropriate dose of (val)ganciclovir was defined as any dose of more than 15% higher or lower than the recommended dose as specified in the guideline. The dosing guideline was based on the combination of handbooks, expert opinion and an international guideline and is presented in Supplement S1 (available as Supplementary data at JAC Online).37–39
Statistical analysis
Numerical variables were summarized using medians and IQRs and categorical variables were summarized using frequencies and percentages. Data normality was analysed prior to the correlation test to determine whether parametric (Pearson test) or non-parametric (Spearman test) analysis had to be performed. The data were analysed using IBM SPSS Statistics 23 (IBM SPSS, Chicago, IL, USA) and R 3.6.2 (RStudio, Inc., Boston, MA, USA).
Results
From June 2018 to February 2020, 95 patients were enrolled (SOT = 64 and HSCT = 31). (Val)ganciclovir was used for prophylaxis in 47 patients and for treatment in 48 patients who were diagnosed with CMV or HHV-6 infection or reactivation. Patient characteristics are presented in Table 1. Overall, 450 (234 for prophylaxis and 216 for treatment) ganciclovir serum samples were obtained.
Patient characteristics
| Variable | Prophylaxis patients (N = 47) | Treatment patients (N = 48) |
|---|---|---|
| Age (years), median (IQR) | 55 (40–62) | 61 (49.0–66.8) |
| Male, n (%) | 28 (60) | 28 (58) |
| Weight (kg), median (IQR) | 71.3 (60.5–80.9) | 74 (62.5–87.7) |
| Height (cm), median (IQR) | 175 (167–182) | 174 (169.3–180.8) |
| BMI (kg/m2), median (IQR) | 23.1 (20.6–25.9) | 23.7 (21.4–27.8) |
| Transplant type | ||
| HSCT | 31 | |
| allogeneic stem cell transplant | 29 | |
| autologous stem cell transplant | 2 | |
| SOT | 47 | 17 |
| kidney | 6 | 10 |
| lung | 19 | 1 |
| liver | 8 | 5 |
| heart | 7 | 1 |
| small intestine | 3 | |
| multiple solid organs | 4 | |
| Treatment | ||
| SOT | ||
| primary CMV infection, therapy | 12 | |
| CMV reactivation, therapy | 5 | |
| HSCT | ||
| CMV pre-emptive therapy | 11 | |
| HHV-6 reactivation, therapy | 17 | |
| CMV pre-emptive therapy and HHV-6 therapy in the same time period | 3 | |
| Therapy duration in study (days), median (IQR) | 18 (5–37) | 14 (10–33) |
| Route of administration | ||
| PO | 24 | 14 |
| IV | 10 | 17 |
| IV and PO | 13 | 17 |
TDM of ganciclovir
From the 390 concentrations obtained (timepoints, in some cases both trough and peak concentration are taken into account), in 369 cases (95%) a pharmacist gave advice and in 29% of the cases the suggestion was to either increase (n = 90, 24%) or decrease (n = 17, 5%) the dose. The dose recommendations were accepted by the physicians for 66/107 and not accepted for 22/107; there was no follow-up information for 19/107. Subsequent dose change resulted in an adequate Cmin and AUC24h in 39/66 cases and in 42/66 cases, respectively. Specific details regarding dose changes and drug concentrations in patients with six or more measurements are shown in Figure S1.
A total of 182 Cmin and AUC24h datasets in the treatment group and 206 Cmin and AUC24h datasets in the prophylaxis group were analysed. A range of 1–15 samples was taken per patient with a median of 3 (IQR = 2–6) measurements. The median Cmin in the treatment group and the prophylaxis group was 2.0 and 0.9 mg/L, respectively. The median AUC24h was 90 mg·h/L in the treatment group (80–120 mg·h/L target) and 67 mg·h/L in the prophylaxis group (>50 mg·h/L target). The subset of samples where the Cmin and AUC24h were repeated while the patient remained on the same dose included 85 Cmin and 86 AUC24h (Table 2). The majority of the Cmin samples (31/46) were <1 mg/L in the prophylaxis group and almost half of the Cmin (19/39) were <2 mg/L in the treatment group; for AUC24h, 15/47 were <50 mg·h/L in the prophylaxis group and 12/39 were <80 mg·h/L in the treatment group.
Target obtainment in samples measured with no dose changes
| Cmin (mg/L) | Number of samples | AUC24h (mg·h/L) | Number of measurements |
|---|---|---|---|
| Prophylaxis samples | |||
| 0–1 | 31 | 0–50 | 15 |
| 1–4 | 11 | 50–80 | 12 |
| >4 | 4 | >80 | 20 |
| Treatment samples | |||
| 0–2 | 19 | 0–80 | 12 |
| 2–4 | 14 | 80–120 | 9 |
| >4 | 6 | >120 | 18 |
| Cmin (mg/L) | Number of samples | AUC24h (mg·h/L) | Number of measurements |
|---|---|---|---|
| Prophylaxis samples | |||
| 0–1 | 31 | 0–50 | 15 |
| 1–4 | 11 | 50–80 | 12 |
| >4 | 4 | >80 | 20 |
| Treatment samples | |||
| 0–2 | 19 | 0–80 | 12 |
| 2–4 | 14 | 80–120 | 9 |
| >4 | 6 | >120 | 18 |
We observed significant intra- and inter-individual variability within both the prophylaxis group and the treatment group. The Cmin and AUC24h over time are shown for 25 patients with six or more measurements in Figure S1(A and B). In Figure S1, 5 patients (16, 17, 19, 24 and 25) underwent HSCT, while the remaining 15 patients underwent SOT. In the five HSCT patients there is less variability than in the SOT group and after an initial low concentration the subsequent concentrations stabilize. In the SOT subjects more variability is observed, even when dosage changes are not done. It can be observed that variability is higher in the Cmin (Figure S1A) values than in the AUC24h values (Figure S1B). Furthermore, despite dosage changes done and drug formulation (PO versus IV), the inter- and intra-individual variability remains high.
Target attainment was also affected by renal function. In Figure 1(a and b) it can be observed that a significant proportion of Cmin and AUC24h are below the predefined targets for an eGFR >90 mL/min/1.73 m2. Fewer measurements were observed to be over the target. Figure 1(a and b) shows the variability of Cmin and AUC24h within different eGFR ranges.
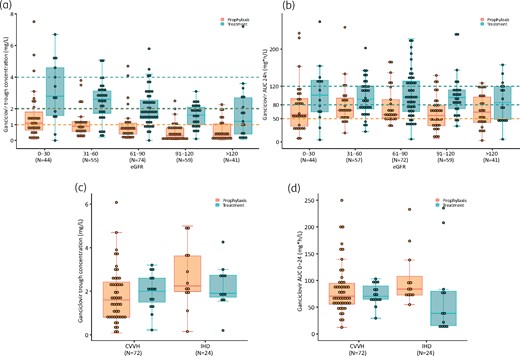
Cmin (a) and AUC24h (b) variability in different eGFR ranges and Cmin (c) and AUC24h (d) variability in patients treated with CVVH or IHD. The horizontal broken lines represent the target ranges. This figure appears in colour in the online version of JAC and in black and white in the print version of JAC.
In CVVH 63 Cmin and 66 AUC24h and in IHD 23 Cmin and 24 AUC24h were obtained. Similarly, as in the higher eGFR ranges, in CVVH more than half of Cmin and AUC24h were below the predefined targets. During IHD the lowest rate of target obtainment was seen in the treatment group. Figure 1(c and d) shows the extreme variability of Cmin and AUC24h values during dialysis. It could be observed that more patients reached the predefined therapeutic ranges during dialysis as compared with patients with eGFR >90 mL/min/1.73 m2. Still, during both IHD and CVVH, the inter- and intra-individual variability of Cmin and AUC24h remained large.
Both Cmin and AUC0–24h were not normally distributed. The correlation coefficient using the Spearman test was 0.59 (P < 0.0001), showing that there was a moderate positive correlation between Cmin and AUC0–24h. The regression analysis resulted in moderate positive correlation as well as when the outlier was removed (Figures S2 and S3).
Ganciclovir-associated adverse effects
Approximately half of the patients had a documented 20% WBC count decrease and 11% of the patients had a 50% decrease in platelet count compared with baseline values. The safety outcomes for the population are presented in Table 3.
Safety outcomes
| Toxicity | Prophylaxis patients N = 47, n (%) | Treatment patients N = 48, n (%) |
|---|---|---|
| Leucopenia | ||
| WBC count <3.5 × 10⁹/L | 8 (17); 8 SOT | 27 (56); 7 SOT and 20 HSCT |
| WBC count >20% decrease from baseline | 24 (51); 24 SOT | 24 (50); 7 SOT and 17 HSCT |
| Thrombocytopenia | ||
| platelet count <100 × 109/L | 17 (36); 17 SOT | 31 (65); 3 SOT and 28 HSCT |
| platelet count >50% decrease from baseline | 4 (9); 4 SOT | 9 (19); 1 SOT and 8 HSCT |
WBC count normal range = 4–10 × 109/L.
Platelet count normal range = 150–400 × 109/L.
For the univariable and multivariable analysis, total bilirubin values were log-transformed as these were not normally distributed. The highest AUC24h value had a significant association with WBC count decrease (P = 0.001), creatinine increase (P = 0.008), ALT increase (P = 0.001) and AST increase (P = 0.032) compared with baseline. The highest Cmin had a significant association with WBC count decrease (P = 0.007), creatinine increase (P = 0.023), ALT increase (P = 0.004), AST increase (P = 0.023) and GGT increase (P = 0.044) compared with baseline (Tables S1 to S4).
Antimicrobial stewardship audit evaluating therapy with (val)ganciclovir
Thirty patients (32%) in the prophylaxis group and 30 patients (32%) in the treatment group received the appropriate initial dose (after the loading dose) according to the guideline. From these, 8 patients (27%) in the prophylaxis group and 12 patients (40%) in the treatment group were within the Cmin target range. On the other hand, 23 (77%) of prophylaxis patients had an AUC over 50 mg·h/L and 6 (20%) of the treatment patients had an AUC in the 80–120 mg·h/L target. Figure 2(a and b) shows the variability of the first Cmin and AUC24h. In the prophylaxis group, appropriate dosing still results in Cmin lower than the defined target in 17/30 and in AUC24h lower than the defined target in 7/30. In the treatment group, the corresponding numbers are 16/30 and 14/30, respectively.
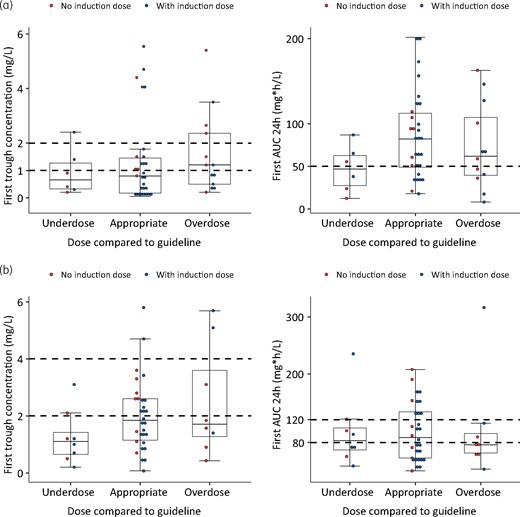
Initial (val)ganciclovir Cmin and AUC24h attainment in patients with lower, appropriate and higher dose according to the hospital guideline. (a) Prophylaxis group. (b) Treatment group. The horizontal broken lines represent the target ranges. This figure appears in colour in the online version of JAC and in black and white in the print version of JAC.
Discussion
Our study showed significant variability of Cmin and AUC24h values despite appropriate dosing based on the hospital guideline. The majority of patients (63%) received the appropriate initial dose, which leaves room for improvement. The patients on the appropriate dose and inappropriate dose showed significant variability in both Cmin and AUC24h. This did not seem to be associated with loading dose or administering higher or lower doses upfront. AUC24h target attainment was higher than for Cmin. This could be explained due to the fact that the pharmacokinetic model for calculating AUC24h values might have been more accurate as multiple samples could have been used for the calculations. We observed a moderate correlation (r2 = 0.6) between Cmin and AUC24h values. Previously, it has been suggested that Cmin is not indicative of AUC24h and a weak correlation (r2 = 0.3) between these parameters was reported.36 Our study is in line with the suggestion to obtain multiple ganciclovir concentrations to determine AUC24h.36 The use of AUC24h has been suggested instead of Cmin as higher AUC24h values have been associated with fewer breakthrough infections and better viral suppression.30,36 Studies looking into relationships between efficacy outcomes and trough concentrations are based on heterogeneous data and non-systematic measurements.40,41 In a study by Fishman et al.,41 a few underexposed (low ganciclovir concentrations) patients were shown to develop breakthrough infections. However, this study did not have enough power to specify exact targets and suggest Cmin supported therapy.
Our data suggest that, in patients with an eGFR of >90 mL/min/1.73 m2 and during CVVH, Cmin and AUC24h targets were not reached in a large proportion of the observed measurements. This could be expected as ganciclovir is predominantly cleared by the kidneys.42 Patients with a good or augmented renal function showed the lowest target attainment and therefore can be considered a population that may potentially benefit from TDM to prevent underexposure. Based on Monte Carlo simulations, higher dosages have been suggested in paediatric patients with augmented renal clearance.31
Besides variability and drug-induced resistance, another reason to conduct ganciclovir TDM is its myelotoxicity. The development of leucopenia and neutropenia have been associated with the AUC24h in a previous study, where, 4 months after transplantation, development of neutropenia was associated with values of 39 mg·h/L (neutropenia of 15%) and 61 mg·h/L (neutropenia of 20%).30 In the multivariable analysis, we could see that the highest AUC24h was correlated with a decrease in WBC count, creatinine increase and increase in liver function markers. This was observed also, to a lesser extent, with the highest Cmin values. Both AUC24h and Cmin could be indicative of development of toxicity. However, the increase in liver function markers is an uncommon side effect of (val)ganciclovir. Furthermore, these patients were immunocompromised and the increase in liver function could also be explained by hepatotoxic CMV disease, graft-versus-host disease of the liver or comedication. Based on our study, we would recommend to obtain multiple ganciclovir concentrations to calculate AUC24h. Moreover, ganciclovir concentrations could be measured for eGFR >90 mL/min/1.73 m2 as low exposure can be expected. During CVVH and IHD, both low and high exposure can occur, thus TDM could also be considered to avoid toxicity and underexposure.
We acknowledge that this study has limitations. The biggest challenge of missing exposure targets in ganciclovir therapy remains and to observe underexposure linked with failure of therapy requires analysis of a wider patient population. Still, ganciclovir remains a drug that is hindered by toxicity and, as mentioned before, TDM-guided therapy has been shown to be valuable in clinical care.26 Due to the lack of clinical follow-up data, we could not assess the clinical outcomes. This became clear when we attempted to analyse the impact of ganciclovir exposure on the viral response. Due to the limited data, we were not able to assess the results by correlation analysis.
As data on dose optimization of ganciclovir are lacking, our study is an important first step in specifying which patients show low or high drug exposure, i.e. patients with increased renal clearance, renal failure or receiving renal replacement therapy. By showing the high variability in drug exposure, our study supports further exploration of TDM of ganciclovir. If TDM is considered in clinical care, according to our study, it would be most beneficial to include AUC24h determination and focus on patients with extremes of kidney function. In vitro studies are needed to define pharmacokinetic/pharmacodynamic targets for ganciclovir therapy. Following these studies, we suggest combining AUC24h determination alongside Cmin and Cmax measurements in a robust prospective study to find out which strategy would best suit ganciclovir treatment optimization in daily practice.
Funding
This study was conducted as part of our routine work. A.-G.M. was funded by Marie Skłodowska-Curie Actions (grant agreement no. 713660—PRONKJEWAIL—H2020-MSCA-COFUND-2015). A.E.E. reports funding from the Indonesian Endowment Fund for Education.
Transparency declarations
None to declare.
Supplementary data
Supplement S1, Figures S1 to S3 and Tables S1 to S4 are available as Supplementary data at JAC Online.
References
TDM Monography for Ganciclovir. https://tdm-monografie.org/monografie/ganciclovir. Accessed 12 April 2021.
Author notes
Marieke G. G. Sturkenboom, Marjolein Knoester and Jan W. C. Alffenaar contributed equally.
