


Abstract
HIV-1 group O (HIV-1/O) is one of the four HIV-1 groups and is endemic in Cameroon, representing 1% of HIV-1 infections in the population. Around 50% of the strains of this group naturally show a mutation (Y181C) providing them with resistance to NNRTIs and making therapeutic management more difficult. Today, the WHO recommends the use of integrase strand transfer inhibitors (INSTIs) as first-line treatment. Bictegravir and cabotegravir are the two most recent INSTIs. Because of the genetic polymorphism of HIV-1/O, studies are required to evaluate their phenotypic susceptibility to these two drugs.
We performed a phenotypic study on a large panel including 41 HIV-1/O clinical isolates and other rare non-group M HIV-1 (2 HIV-1/N and 1 HIV-1/P) to evaluate in vitro susceptibility to bictegravir and cabotegravir.
The results showed an overall susceptibility of non-group M strains to the two drugs compared with HIV-1 group M. There was no difference between the mean (min–max) IC50 of HIV-1/M [1.86 (0.93–4.12) and 5.24 (1.76–12.41) nM for bictegravir and cabotegravir, respectively] and HIV-1/non-M [2.17 (0.03–9.47) and 4.88 (0.02–15.64) nM for bictegravir and cabotegravir, respectively]. However, we found a significant difference between IC50 values for bictegravir and cabotegravir in the whole panel (P value < 0.001).
This study has shown encouraging results regarding the clinical use of these drugs in HIV-1/non-M-infected patients, which will need to be confirmed with clinical data.
Introduction
Due to the high genetic diversity among HIV-1, four subgroups have been defined: group M (pandemic, includes 10 subtypes);1 group O (includes two subgroups, H and T); group N; and group P.2,3 Non-M variants are responsible for a small number of infections worldwide; however, HIV-1/O prevalence reaches almost 1% of HIV-1 infections in Cameroon, where this group is endemic.4
Regarding the treatment of HIV-1/O infection, phenotypic and genotypic studies have highlighted the natural resistance of this group to NNRTIs in the presence of the Y181C mutation associated with resistance.5 Today, the WHO recommends dolutegravir (i.e. a second-generation INSTI) in first- and second-line antiretroviral regimens.
Because of the genetic polymorphism of HIV-1/O, studies are required to evaluate the phenotypic susceptibility to INSTIs. Previous studies showed HIV-1/non-M susceptibility in vitro to raltegravir, elvitegravir and dolutegravir, revealing a slightly different response for elvitegravir for 17 of the 39 clinical strains tested, possibly in relation to a genotypic pattern of four mutations (V72I, I200L, N222K and R224Q).6 Bictegravir and cabotegravir are the most recent INSTIs. Bictegravir is already marketed as a single tablet regimen (STR) with emtricitabine and tenofovir alafenamide (Biktarvy®, Gilead). Cabotegravir was developed as a long-acting treatment (injection every 4 weeks in combination with rilpivirine) in switch regimens for patients with controlled viral replication and has recently been approved by the FDA. The encouraging results of Phase III clinical trials for cabotegravir and the efficacy of Biktarvy® make them two promising molecules for the therapeutic management of HIV-1/O-infected patients. However, a previous study on HIV-1/non-M phenotypic susceptibility to raltegravir, elvitegravir and dolutegravir showed the impact of genetic diversity, both from a genotypic and a phenotypic point of view.
To the best of our knowledge, no study has yet evaluated the phenotypic susceptibility of HIV-1/non-M to bictegravir and cabotegravir, thus we aimed to provide in vitro data, from a large panel of HIV-1/non-M variants representative of genetic diversity, on these two drugs.
Materials and methods
Strains
Forty-one HIV-1/O (27 from subgroup H and 14 from subgroup T), 2 HIV-1/N and 1 HIV-1/P clinical isolates, representative of HIV-1/non-M genetic diversity, were obtained from INSTI treatment-naive HIV-infected patients. Five HIV-1/M (four B subtype and one D subtype) were also used as controls. The clinical isolates were from cell culture with plasma samples (spinoculation) or from cell culture with viral supernatant (isolate amplification). Briefly, 20 × 106 PBMCs isolated from healthy donors were incubated for 2 h with 80 μL of infected plasma or 500 pg virus stock supernatant reverse transcriptase (RT) activity (assessed by Lenti RT activity assay; Cavidi, Uppsala, Sweden) then washed with RPMI medium containing 50 μg/mL gentamicin. The cells were resuspended at 1 × 10⁶ cells/mL (in RPMI, 10% heat-inactivated FBS, 50 μg/mL gentamicin, 2 μg/mL polybrene, 450 UI/mL IL-2r). During the 21 days of culture, half of the medium was replaced twice weekly while dosing with RT. The collected supernatant was stored at −80°C when the RT reached its maximal activity.
Phenotypic assay
The PBMCs used for the infection were derived for each new experiment from three buffy coats provided by the French Institute of Blood and freshly removed from healthy donors, to avoid any special characteristic relative to one donor. As previously described, the isolation of the PBMCs was performed separately by Ficoll-Plaque Plus solution (GE Healthcare, Velizy-Villacoublay, France).6,7 They were then pooled to increase cellular density and placed at 1 × 10⁶ cells/mL in culture medium (RPMI, 10% heat-inactivated FBS, 50 μg/mL gentamicin) and PHA-stimulated at 0.2 μg/mL. After 72 h in the incubator (37°C, 5% CO2), the cells were activated with 450 UI/mL IL-2r and 2 μg/mL polybrene for at least 2 h before being infected with 100 TCID50 of infected supernatants for 2 h. Finally, the infected PBMCs were washed and seeded in a 96-well plate at 2 × 10⁵ cells/well for 48 to 96 h according to the strain (37°C, 5% CO2) in the presence of five serial dilutions of bictegravir and cabotegravir separately (from 0.1 to 1000 nM, dilutions performed in RPMI with 50 μg/mL gentamicin). Each drug concentration was tested in quadruplicate. The collection was created by pooling 50 μL from the four wells from each condition before freezing the samples for storage (−80°C).
qRT–PCR
Inhibition of replication in cell co-culture was measured by quantifying viral RNA in the collected viral supernatants. RNA was extracted with the EZ1 DSP Virus Kit (QIAGEN, Courtaboeuf, France) followed by amplification and specific quantification with qRT–PCR according to the virus group.6,8 For HIV-1/O, an UltraSense™ One-Step Quantitative RT–PCR system RNA kit (Invitrogen, Cergy-Pontoise, France) on a CFX96 Deep-Well instrument (BioRad) was used. The primers and probe, targeting the integrase region were (5′–3′) forward TCTATTACAGAGACAGCAGAGAYC, reverse CTACTGCTCCYTCACCTTTCC and FAM-ACAGGAGYTGKGCCGGTCCTTTC-Eclipse Dark Quencher, respectively. The initial step was 5 min at 50°C then 2 min at 95°C followed by 50 cycles of amplification (95°C for 15 s then 60°C for 30 s). A group O reference strain (YBF32) at an initial concentration of 2 ×10⁶ copies/mL was diluted to obtain a standardization curve to further determine the viral RNA concentration starting from their cycle threshold (Ct) values. For HIV-1/M and HIV-1/N, the LTR region was targeted using the Generic HIV Viral Load kit (Biocentric, Bandol, France) from previous known detection in those groups,6 again on the CFX96 Deep well (50°C 10 min; 95°C 5 min; 50 cycles of amplification of 95°C for 15 s then 60°C for 60 s). Finally, the phenotypic assay for the single HIV-1/P strain was performed with the Xpert HIV-1 Viral Load kit (Cepheid, Sunnyvale, CA, USA).9
Statistical analyses
Ct values were converted into concentrations in log10 copies/mL and normalized (100% for the highest, 0% for the lowest) before using a sigmoidal regression equation. We determined, for each drug, the concentrations to inhibit 50% of the HIV-1 integrase (IC50) and the fold change (FC), corresponding to the ratio between the IC50 of the tested strain and the mean IC50 of the five HIV-1/M strains. Results are represented as mean (±SD). Statistical analyses (Mann–Whitney tests) and graphics were performed with GraphPad Prism version 8.0 (P < 0.05).
Results
Five HIV-1/M strains were used as controls and showed a mean IC50 (±SD) of 1.86 (±1.29) and 5.24 (±4.70) nM for bictegravir and cabotegravir, respectively (Tables 1 and 2). The IC50 ranges (min–max) we obtained were 0.03–9.47 nM for bictegravir and 0.02–15.64 nM for cabotegravir. The mean IC50 (±SD) values obtained for the 41 HIV-1/O strains were 2.24 (±2.15) and 4.94 (± 4.11) nM for bictegravir and cabotegravir, respectively (Figure 1 and Table S1, available as Supplementary data at JAC Online). Regarding HIV-1/O, no significant differences were found between subgroups H and T (means of 2.32 and 2.09 nM, respectively, for bictegravir, and 5.09 and 4.66 nM, respectively, for cabotegravir; Table 3). The IC50 values for the two HIV-1/N isolates were 2.54 and 0.04 nM for bictegravir and 7.87 and 0.02 nM for cabotegravir. The IC50 values for the unique HIV-1/P strain were 0.81 and 4.26 nM for bictegravir and cabotegravir, respectively.
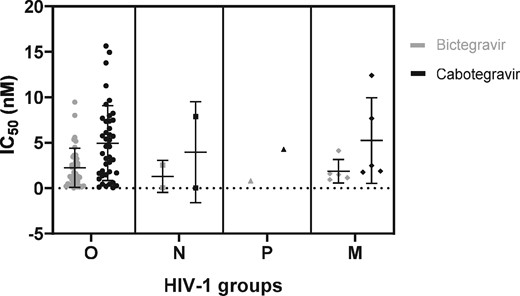
Dot plot representation of IC50 values (nM; mean and SD) of HIV-1 strains (N = 49) according to the subgroup: O (circles), N (squares), P (triangles) and M (diamonds). Values for bictegravir and cabotegravir are represented in grey and black, respectively. Details of IC50 values are displayed in Table S1.
Phenotypic assays for bictegravir
| HIV-1 group | N | Bictegravir IC50 (nM) | Bictegravir FC | ||||||
|---|---|---|---|---|---|---|---|---|---|
| mean | median | SD | min–max | mean | median | SD | min–max | ||
| M | 5 | 1.86 | 1.50 | 1.29 | 0.93–4.12 | — | — | — | — |
| non-M | |||||||||
| O | 41 | 2.24 | 1.59 | 2.15 | 0.03–9.47 | 1.21 | 0.85 | 1.15 | 0.01–5.09 |
| N | 2 | 1.29 | 1.29 | 1.77 | 0.04–2.54 | 0.69 | 0.69 | 0.95 | 0.02–1.37 |
| P | 1 | 0.81 | — | — | — | 0.44 | — | — | — |
Phenotypic assays for cabotegravir
| HIV-1 group | N | Cabotegravir IC50 (nM) | Cabotegravir FC | ||||||
|---|---|---|---|---|---|---|---|---|---|
| mean | median | SD | min–max | mean | median | SD | min–max | ||
| M | 5 | 5.24 | 2.48 | 4.70 | 1.76–12.41 | — | — | — | — |
| non-M | |||||||||
| O | 41 | 4.94 | 4.59 | 4.11 | 0.04–15.64 | 0.94 | 0.88 | 0.79 | 0.01–2.99 |
| N | 2 | 3.95 | 3.95 | 5.55 | 0.02–7.87 | 0.75 | 0.75 | 1.06 | 0.004–1.50 |
| P | 1 | 4.26 | — | — | — | 0.81 | — | — | — |
Statistical analysis of the results of the phenotypic study
| Drug/HIV-1 group | N | IC50 (nM) | P value | |
|---|---|---|---|---|
| mean | median | |||
| Bictegravir | ||||
| M | 5 | 1.86 | 1.50 | 0.89 |
| non-M | 44 | 2.17 | 1.46 | |
| O subgroup H | 27 | 2.32 | 1.28 | 0.73 |
| O subgroup T | 14 | 2.09 | 2.02 | |
| Cabotegravir | ||||
| M | 5 | 5.24 | 2.48 | 0.84 |
| non-M | 44 | 4.88 | 4.42 | |
| O subgroup H | 27 | 5.09 | 3.81 | 0.70 |
| O subgroup T | 14 | 4.66 | 4.59 | |
| Bictegravir, whole panel | 49 | 2.14 | 1.50 | 0.0002* |
| Cabotegravir, whole panel | 49 | 4.92 | 4.26 | |
Mann–Whitney tests were performed. * denotes significant difference.
All the non-M strains showed susceptibility to the two drugs without any significant difference between HIV-1/non-M and HIV-1/M (Table 3). Bictegravir and cabotegravir mean IC50 values were, however, significantly different across the whole panel (P value < 0.001). Besides, results showed a higher variability for cabotegravir than for bictegravir, which was a tendency also observed for the HIV-1/M strains. Regarding the FC, a ratio higher than 1 was found for 20 strains (45%) in the cabotegravir group and 20 (45%) in the bictegravir group. Eighteen out of these 20 strains were common to both groups. Five strains showed an FC of >2.5 for bictegravir, with one having an FC of >5 (5.09 for BCF112); only three strains showed an FC of >2.5 for cabotegravir (YBF16, YBF26 and BCF100) and none of them were >5.
Discussion
The aim of this study was to evaluate the phenotypic susceptibility of a large panel of HIV-1/non-M strains, including strains from groups N and P, to bictegravir and cabotegravir. We showed that there were no significant differences between the IC50 values for all 44 divergent strains from groups O, N and P, and the IC50 value of the reference strains from group M. All the strains were thus susceptible to bictegravir and cabotegravir, although IC50 values were significantly different between the two drugs.
Interestingly, based on our global data on INSTIs,6 we observed that the mean IC50 obtained from these strains depended on the drug tested: <1 nM for raltegravir, dolutegravir and elvitegravir, compared with 2.17 and 4.88 nM for bictegravir and cabotegravir, respectively. The distribution of the IC50 values for bictegravir and cabotegravir was also homogeneous throughout the range of values with medians of 1.46 nM and 4.42 nM, respectively. The literature indicates susceptibility to bictegravir for both HIV-1 (groups M, N and O) and HIV-2 in PBMCs ranging from <0.05 to 6.6 nM from the Summary of product characteristics (SmPC) of Biktarvy®. Another study, including 14 clinical HIV-1 isolates and one HIV-2 isolate, showed susceptibility in the range of 0.04 to 1.7 nM.10 For cabotegravir, antiviral activity against 24 HIV-1 clinical isolates, including 3 HIV-1/O, was measured from 0.02 to 1.06 nM cabotegravir in PBMCs according to the Cabenuva® SmPC. Thus, different technical phenotypic protocols might explain difficulties in comparing antiviral susceptibilities. IC50 values must be carefully compared when technical conditions are not strictly the same. The use of FC allowed us to avoid this technical variability. In our study, we observed that the entire panel, except one strain (BCF112), had an FC of <5. From a previous study, this reflected a good indicator of natural susceptibility of the non-M strains. The establishment of an FC clinical cut-off for bictegravir or cabotegravir-experienced patients would help to complete these data.11
We decided here to perform the assay on fresh PBMCs to remain as close as possible to the conditions of infected patients. A similar response was found for each assay regarding the two drugs with, however, a larger distribution of data for cabotegravir. To be administered to the patient, different galenic forms are available using different administration sites. When administered per os (like bictegravir), a first-pass effect in the liver causes a powerful reduction of drug concentration. This effect is avoided with cabotegravir because of its injectable galenic form. Its higher variability between the clinical isolates might reflect the importance of the dosage for the injectable molecule to be both efficient and not toxic.
Despite different routes of administration, the structures of bictegravir, cabotegravir and dolutegravir are very similar compared with those of raltegravir and elvitegravir. Bictegravir, cabotegravir and dolutegravir are linked to a higher barrier to resistance and improved antiviral activity against INSTI-resistant strains. Previous biochemical assays showed that bictegravir had weaker activity in the 3′-processing of HIV-1/M integrase while its activity on strand transfer was comparable with that of dolutegravir,10 meaning that the main inhibitory effect of bictegravir was due to the inhibition of strand transfer. Despite the fact that HIV-1/O integrase displayed a lower strand-transfer activity compared with HIV-1/M, we did not observe a significant difference in IC50 values obtained with bictegravir from non-group M (mainly O) compared with group M. This difference has not yet been explored for the other rare strains from groups P and N.
In conclusion, each strain of this large panel of HIV-1/non-M variants showed phenotypic susceptibility to bictegravir and cabotegravir, with a higher variability for the latter. More in vivo data are required but these results are promising regarding the clinical use of these two drugs in HIV-1/O-infected patients.
Acknowledgements
We are grateful to: the Department of Virology of Bichat-Claude Bernard Hospital (Paris), supported by Gilead and the ANRS (France Recherche Nord&Sud SIDA-VIH Hépatites) for kindly providing drugs; RES-O (French national network for HIV-1/O infection) for the constitution of the clinical strains collection; the virology laboratory team, Rouen University Hospital, for their support; and Nikki Sabourin-Gibbs, Rouen University Hospital, for her help in editing the manuscript.
Funding
This work was supported by Santé Publique France.
Transparency declarations
None to declare.
Supplementary data
Table S1 is available as Supplementary data at JAC Online.
