


Abstract
The CD4/CD8 ratio is an indicator of immunosenescence and a predictor of all-cause mortality in HIV-infected patients. The effects of different ART regimens on CD4/CD8 ratio recovery remain unclear.
Clinical cohort study of ART-treated patients from the CFAR Network of Integrated Clinical Systems (CNICS). We included ART-naive adults with HIV infection who achieved undetectable HIV RNA during the first 48 weeks of treatment and had additional follow-up 48 weeks after virological suppression (VS). Primary endpoints included increase in CD4/CD8 ratio at both timepoints and secondary endpoints were CD4/CD8 ratio recovery at cut-offs of ≥0.5 or ≥1.0.
Of 3971 subjects who met the study criteria, 1876 started ART with an NNRTI, 1804 with a PI and 291 with an integrase strand transfer inhibitor (INSTI). After adjusting for age, sex, race, year of entry, risk group, HCV serostatus, baseline viral load and baseline CD4/CD8 ratio, subjects on an NNRTI showed a significantly greater CD4/CD8 ratio gain compared with those on a PI, either 48 weeks after ART initiation or after 48 weeks of HIV RNA VS. The greater CD4/CD8 ratio improvement in the NNRTI arm was driven by a higher decline in CD8 counts. The INSTI group showed increased rates of CD4/CD8 ratio normalization at the ≥1.0 cut-off compared with the PI group.
NNRTI therapy was associated with a greater increase in the CD4/CD8 ratio compared with PIs. NNRTI- and INSTI-based first-line ART were associated with higher rates of CD4/CD8 ratio normalization at a cut-off of 1.0 than a PI-based regimen, which might have clinical implications.
Introduction
Since the introduction of ART for the treatment of HIV in the early 1990s, the clinical scenario of the infection has dramatically changed. Far from the situation in the early 1980s, subjects receiving ART now benefit from a relatively normal life. ART regimens are assumed to indefinitely suppress the virus in plasma and restore the CD4 lymphocyte count. However, it has been demonstrated that HIV-infected patients have greater immune activation, resulting in higher rates of non-HIV events such as cardiovascular disease, renal disease, liver disease, neurocognitive disorders and non-AIDS malignancies in the long term despite adequate viral suppression.1
For historical reasons, the focus of immune recovery has been given to the CD4 T cell count. In recent years, a new marker has emerged as an indicator of immunosenescence and a predictor of all-cause mortality in HIV-infected patients: the CD4/CD8 ratio.2–4 Several studies have shown that the CD4/CD8 ratio correlates with higher levels of T cell activation leading to the aforementioned persistent immune activation with its deleterious long-term consequences.2,3,5 The CD4/CD8 ratio is therefore being increasingly recognized as a marker of immune recovery and prognosis during treatment of HIV. Current guidelines recommend starting ART as soon as a patient is diagnosed with HIV and this strategy of early initiation of therapy is known to improve the CD4/CD8 ratio.6 So far, very few studies have attempted to assess the performance of different ART regimens on the normalization and increase of the CD4/CD8 ratio. Small retrospective cohorts and a post hoc analysis of larger clinical trials seem to place INSTI-based regimens as the most powerful regimen to achieve this effect,7–10 whereas post hoc analysis of other smaller studies11,12 has found a better effect of NNRTI-based regimens on the normalization of the CD4/CD8 ratio.
We believe that first-line ART regimens might differ in their impact on restoration of the CD4/CD8 ratio and that this field has yet to be explored adequately. The aim of our study was to evaluate whether initial ART regimens show different effects on the rate of CD4/CD8 ratio recovery in ART-suppressed patients.
Methods
This was a clinical cohort study where we used data from ART-treated patients from the CFAR Network of Integrated Clinical Systems (CNICS), including patients from 1997 to 2015.
We included adults with confirmed HIV infection, ART naive, who achieved HIV RNA below the limit of detection during the first 48 weeks (± 8 weeks) of ART initiation. ART regimens included were: 2NRTI + integrase strand transfer inhibitor (INSTI); 2NRTI + NNRTI; and 2NRTI + PI. We excluded other drug combinations.
We excluded patients with undetectable viral load at entry into CNICS, those starting on regimens that did not include triple therapy or those who stopped or changed ART regimen during the first 48 weeks, as well as patients that had been exposed to ART previously. We also excluded patients with missing data, such as CD4/CD8 ratio and viral load at baseline or follow-up, or who did not complete the follow-up visit at Week 48. Covariates included age, sex, race, mode of HIV transmission (MSM, drug users, heterosexual or other), date of HIV diagnosis, date of ART initiation, ART regimen, baseline pre-ART CD4 and CD8 count, baseline pre-ART CD4/CD8 ratio, baseline viral load and HCV serostatus. The CD4/CD8 ratio had to be available at 48 weeks (±8 weeks) after initiation of ART or after 48 weeks (±8 weeks) of virological suppression (VS).
The primary endpoints included increase in CD4/CD8 ratio at 48 weeks after initiation of ART and increase in CD4/CD8 ratio at 48 weeks after VS. Additionally, we explored the effects of the type of ART regimen on the rate of CD4/CD8 normalization. CD4/CD8 ratio normalization was defined as a CD4/CD8 ratio ≥0.5 or ≥1.0. The rationale for this categorization was that: (i) values of <1.0 correlate with immunosenescence in the general population13 and HIV-infected individuals with CD4/CD8 ratio above this cut-off show levels of immunosenescence similar to those of healthy controls;13 and (ii) a value of 0.4 (in a range of 0.3 to 0.5) appears to be the best cut-off to predict adverse outcomes in ART-treated HIV patients.2,3,14 The level of HIV RNA to define viral undetectability varied across CNICS sites and was defined by the limit of detection according to the type of assay used at each site.
This study was approved by the CNICS network scientific board (IRB study number CNICS107) and by the Ethics Committee of Hospital Universitario Ramón y Cajal (approval 283/15, [email protected]).
Statistical analysis
Demographic and clinical characteristics at baseline were summarized with means and SDs, medians and IQRs or percentages. We used linear regression analysis with robust methods to compare the mean changes in CD4 count, CD8 count and CD4/CD8 ratio changes across treatment groups. The analyses were adjusted for age, sex, race, year, risk group for HIV acquisition, HCV serostatus, baseline plasma HIV RNA and baseline CD4/CD8 ratio. We used logistic regression analysis to assess the effect of treatment groups on the risk of CD4/CD8 normalization at different cut-offs (0.5 and 1.0), adjusted for the similar covariates listed before. Because of the multicentre origin of the data, we used robust methods to produce robust variance estimates and relax the assumption of independence of observations. We reproduced the analyses at two timepoints: (i) 48 weeks after ART initiation; and (ii) 48 weeks after HIV RNA suppression. We performed sensitivity analyses to exclude patients with detectable HIV RNA at the last timepoint. Assumptions for these analyses were checked by exploring regression residuals. We explored the potential effect of CNICS site on the outcomes using multilevel mixed models, including as fixed-effects the independent variables included in the multivariate logistic regression models, and considering the site as a random effect. The post-estimation intraclass correlation coefficient indicated that only 0.04% of the variability was attributable to the site. Statistical analyses were performed using Stata version 16 (StataCorp LP, College Station, TX, USA). Figures were generated using Prism version 7.0 (GraphPad, La Jolla, CA, USA).
Results
During the study period, 25 523 participants were followed in CNICS. Major reasons for exclusion included ART initiation with regimens other than those listed in the inclusion criteria (e.g. pre-HAART treatments) and missing HIV RNA, CD4 count or CD8 count data, either at baseline or at the follow-up timepoints. A total of 3971 met the study criteria (Figure 1). Of the participants included in the analyses, 1876 (46%) were started on an NNRTI-based regimen, 1804 (45%) on a PI-based regimen and 291 (7%) on an INSTI-based regimen. A total of 3213 patients completed a follow-up visit at 48 weeks (±8 weeks) after ART initiation and 2757 completed a follow-up visit at 48 weeks (±8 weeks) after VS. The majority of participants were male (3392, 85.4%), of white race (2550, 64.2%) and had a mean (SD) age of 38.9 years (10.1). The most prevalent risk group, with 2609 patients (65.7%), was MSM and most of the patients had an initial viral load of less than 100 000 copies (2370, 59.7%) (Table 1). The list of ART regimens included in the analyses, grouped by the third drug, is provided in Table 2. Mean (SD) follow-up for the cohort was 217.6 weeks (180.8): 232.2 weeks (176.7) in the NNRTI group; 221.4 weeks (192.6) in the PI group; and 117.6 weeks (78.1) in the INSTI group. Mean (SD) time to VS was 17.2 weeks (11.3) in the NNRTI group, 19.8 weeks (12.0) in the PI group and 13.6 weeks (11.5) in the INSTI group (P < 0.001). The frequency of individuals with detectable HIV RNA at the last follow-up timepoint was 164 (8.7%) in the NNRTI group, 283 (15.7%) in the PI group and 15 (5.2%) in the INSTI group (P < 0.001).
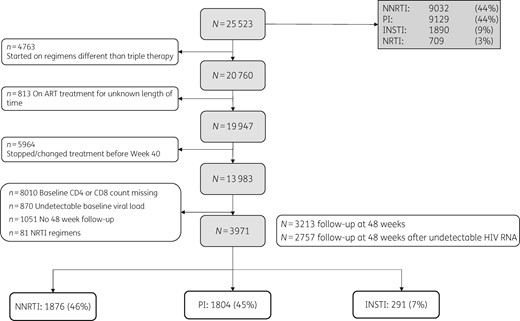
Flow chart of study participants.
Baseline characteristics of the study population
| Variable | Total | NNRTI | PI | INSTI |
|---|---|---|---|---|
| N (%) | 3971 (100) | 1876 (100) | 1804 (100) | 291 (100) |
| Age, years, mean (SD) | 38.9 (10.1) | 38.5 (10.2) | 39.3 (9.7) | 39.1 (11.5) |
| Sex, n (%) | ||||
| female | 546 (13.8) | 218 (11.6) | 289 (16) | 39 (13.4) |
| male | 3392 (85.4) | 1646 (87.7) | 1500 (83.2) | 246 (84.5) |
| missing | 33 (0.83) | 12 (0.6) | 15 (0.8) | 6 (2.1) |
| Race, n (%) | ||||
| white | 2550 (64.2) | 1213 (64.7) | 1170 (64.8) | 167 (57.4) |
| black | 1045 (26.3) | 508 (27.1) | 447 (24.8) | 90 (30.9) |
| Asian | 115 (2.9) | 45 (2.4) | 59 (3.3) | 11 (3.8) |
| other | 228 (5.7) | 98 (5.2) | 113 (6.3) | 17 (5.8) |
| missing | 33 (0.8) | 12 (0.6) | 15 (0.8) | 6 (2.1) |
| Baseline HIV RNA, copies/mL (median, IQR) | 56 800 (14 401–190 000) | 50 430 (14 400–148 000) | 70 200 (15 747–248 848) | 37 062 (8941–113 000) |
| <100 000 | 2370 (59.7) | 1172 (62.5) | 1014 (56.2) | 184 (63.2) |
| ≥100 000 | 998 (25.1) | 420 (22.4) | 523 (29) | 55 (18.9) |
| missing | 603 (15.2) | 284 (15.1) | 267 (14.8) | 52 (17.9) |
| Risk group, n (%) | ||||
| MSM | 2609 (65.7) | 1290 (68.8) | 1119 (62) | 200 (68.7) |
| heterosexual | 839 (21.1) | 380 (20.3) | 405 (22.4) | 54 (18.6) |
| IVDU | 360 (9.1) | 141 (7.5) | 193 (10.7) | 26 (8.9) |
| other | 81 (2) | 24 (1.3) | 49 (2.7) | 8 (2.8) |
| missing | 82 (2.1) | 41 (2.2) | 38 (2.1) | 3 (1) |
| Year of ART initiation, n (%) | ||||
| 1995–99 | 362 (9.1) | 112 (6) | 250 (13.9) | 0 (0) |
| 2000–04 | 955 (24.1) | 462 (24.6) | 492 (27.3) | 1 (0.3) |
| 2005–09 | 1408 (35.5) | 730 (38.9) | 647 (35.9) | 31 (10.7) |
| 2010 or later | 1246 (31.4) | 572 (30.5) | 415 (23) | 259 (89) |
| HCV, n (%) | ||||
| positive | 1729 (43.5) | 185 (9.9) | 261 (14.5) | 24 (8.3) |
| negative | 470 (11.8) | 821 (43.8) | 766 (42.5) | 142 (48.8) |
| indeterminate | 1772 (44.6) | 870 (46.4) | 777 (43.1) | 125 (43) |
List of antiretroviral regimens analysed grouped by the third drug
| Drug | n | % |
|---|---|---|
| NNRTI | ||
| efavirenz | 1643 | 87.6 |
| nevirapine | 104 | 5.5 |
| rilpivirine | 92 | 5.0 |
| etravirine | 37 | 2.0 |
| total NNRTI | 1876 | 100 |
| PI | ||
| lopinavir | 422 | 23.4 |
| nelfinavir | 239 | 13.3 |
| atazanavir | 642 | 35.6 |
| darunavir | 291 | 16.1 |
| fosamprenavir | 49 | 2.7 |
| saquinavir | 28 | 1.6 |
| indinavir | 122 | 6.8 |
| amprenavir | 11 | 0.6 |
| total PI | 1804 | 100 |
| INSTI | ||
| raltegravir | 131 | 45.0 |
| elvitegravir | 118 | 40.6 |
| dolutegravir | 42 | 14.4 |
| total INSTI | 291 | 100 |
CD4/CD8 ratio
The absolute changes in CD4 and CD8 counts and CD4/CD8 ratio under each ART treatment group is shown in Figure 2. The mean (SD) CD4/CD8 ratio at baseline was 0.37 (0.33) in the NNRTI group, 0.32 (0.27) in the PI group and 0.47 (0.34) in the INSTI group (P < 0.001). Figure 2(a) shows the observed changes in the mean CD4/CD8 ratio throughout the study in the different groups.
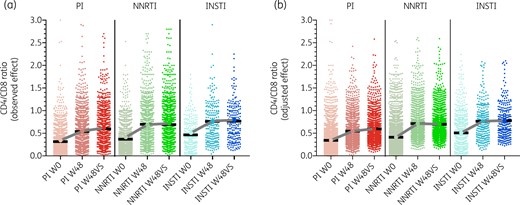
(a) Observed changes in CD4/CD8 ratio across study arms after 48 weeks of ART (W48) and after 48 weeks of VS (W48VS). (b) Predicted changes in CD4/CD8 ratio across study arms, adjusted for age, sex, race, year, risk group for HIV acquisition, HCV serostatus, pre-ART plasma HIV RNA and pre-ART CD4/CD8 ratio. Baseline values (W0) in (b) represent raw data, W48 and W48VS values represent the adjusted values. This figure appears in colour in the online version of JAC and in black and white in the print version of JAC.
Table 3 shows crude and adjusted multiple regression analysis for changes in CD4/CD8 ratio across the different treatment groups. After adjusting for age, sex, race, year, risk group, HCV and viral load > 100 000, compared with PI, subjects in the NNRTI group showed a greater CD4/CD8 ratio gain after 48 weeks of ART initiation (P = 0.049) and after 48 weeks of HIV RNA suppression (P = 0.012). This difference was attenuated in a sensitivity analysis excluding participants with detectable viral loads at the last timepoint (PI versus NNRTI, P = 0.094). The comparisons between the NNRTI and INSTI groups did not reach the threshold of statistical significance. Figure 2(b) represents the adjusted changes in the mean CD4/CD8 ratio after multivariate adjustment. After 48 weeks of VS, the adjusted mean CD4 counts increased to 462, 459 and 457 cells/uL in the NNRTI, PI and INSTI groups, respectively, while the adjusted mean CD8 counts decreased to 867, 905 and 884 cells/uL in the NNRTI, PI and INSTI groups, respectively. Interestingly, the stronger effect of NNRTI on CD4/CD8 ratio gain was driven by a higher decline of CD8 counts (adjusted analyses at 48 weeks after ART initiation, P = 0.025, adjusted analyses at 48 weeks after HIV RNA suppression, P = 0.001, subanalysis restricted to patients virally suppressed at 48 weeks after HIV suppression, P = 0.011), while the effect of ART group on CD4 counts did not reach statistical significance.
Differences in linear change 48 weeks after ART initiation and 48 weeks after VS
| Variable | Model | 48 weeks after ART initiation | 48 weeks after VS | Sensitivity analysis: virologically suppressed at last timepoint | ||||||
|---|---|---|---|---|---|---|---|---|---|---|
| coefficient | 95% CI | P value | coefficient | 95% CI | P value | coefficient | 95% CI | P value | ||
| CD4/CD8 ratio | ||||||||||
| PI | reference | — | — | reference | — | — | reference | — | — | |
| NNRTI | crude | 0.16 | 0.06–0.26 | 0.001 | 0.09 | 0.06–0.12 | <0.001 | 0.06 | 0.03–0.1 | 0.001 |
| adjusted | 0.08 | 0.0003–0.16 | 0.049 | 0.03 | 0.005–0.05 | 0.016 | 0.02 | −0.004 to 0.45 | 0.094 | |
| INSTI | ||||||||||
| crude | 0.22 | 0.15–0.29 | <0.001 | 0.17 | 0.10–0.24 | <0.001 | 0.14 | 0.05–0.22 | 0.001 | |
| adjusted | −0.24 | −0.12 to 0.07 | 0.632 | −0.23 | −0.08 to 0.03 | 0.408 | −0.03 | −0.08 to 0.03 | 0.345 | |
| CD4 T cell counts | ||||||||||
| PI | reference | — | — | reference | — | — | reference | — | — | |
| NNRTI | crude | 42.5 | 24.2–60.9 | <0.001 | 16.5 | −3.67 to 36.7 | 0.109 | −0.13 | −22.7 to 22.5 | 0.990 |
| adjusted | 3.2 | −13.2 to 19.6 | 0.702 | −16.8 | −34.9 to 1.30 | 0.070 | −24.0 | −44.1 to −3.8 | 0.019 | |
| INSTI | ||||||||||
| crude | 132.8 | 92.3–173.4 | <0.001 | 110.2 | 65.1–155.3 | <0.001 | 95.7 | 49.6–141.8 | <0.001 | |
| adjusted | −1.9 | −44.4 to 40.6 | 0.929 | −3.2 | −45.0 to 38.7 | 0.882 | −16.5 | −62.6 to 29.7 | 0.484 | |
| CD8 T cell counts | ||||||||||
| PI | reference | — | — | reference | — | — | reference | — | — | |
| NNRTI | crude | −64.0 | −96.4 to −31.6 | <0.001 | −84.2 | −119.4 to 48.9 | <0.001 | −58.4 | −95.5 to −21.2 | 0.002 |
| adjusted | −38.7 | −73.7 to −0.6 | 0.025 | −64.9 | −101.5 to −28.4 | 0.001 | −496 | −87.7 to −11.5 | 0.011 | |
| INSTI | ||||||||||
| crude | −39.8 | −101.9 to 22.3 | 0.209 | −34.9 | −102.0 to 32.1 | 0.306 | 9.0 | −69.3 to 87.3 | 0.822 | |
| adjusted | −20.9 | −96.5 to 54.6 | 0.587 | −4.7 | −83.1 to 73.6 | 0.906 | 2.8 | −86.1 to 91.7 | 0.951 | |
A dash indicates blank values. Significant P values (<0.05) are indicated in bold.
Adjusted for age, sex, race, year, risk group for HIV acquisition, HCV serostatus, plasma HIV RNA and CD4/CD8 baseline ratio.
Similar multivariate analyses with INSTI as the reference category did not reach the threshold of statistical significance for any comparison.
CD4/CD8 ratio recovery
The NNRTI group showed the greatest effect on CD4/CD8 ratio normalization in the adjusted logistic regression analyses for both the ≥0.5 and ≥1.0 cut-offs. For the ≥0.5 cut-off, the NNRTI had an adjusted OR (aOR) of 1.5 (95% CI 1.2–1.8, P < 0.001) at 48 weeks after ART initiation and an aOR of 1.2 (95% CI 1.0–1.6, P = 0.066) at 48 weeks after VS, compared with the PI group. Similarly, for the ≥1.0 cut-off, the NNRTI had an aOR of 1.50 (95% CI 1.15–1.93) at 48 weeks after ART initiation and an aOR of 1.34 (95% CI 1.04–1.72) at 48 weeks after VS. For the analysis at 48 weeks after ART initiation, the INSTI group also showed increased rates of CD4/CD8 ratio normalization at the ≥1.0 cut-off compared with the PI group (aOR 1.7, 95% CI 1.1–3.0, P = 0.045); the statistical significance was lost in the analysis after 48 weeks of VS (aOR 1.3, 95% CI 0.7–2.2, P = 0.381). The comparison between the INSTI and NNRTI groups did not reach the threshold of statistical significance.
In the sensitivity analysis excluding the participants with detectable HIV RNA at the follow-up visit, the differences remained statistically significant at the timepoint 48 weeks after ART initiation (for CD4/CD8 ratio ≥0.5, aOR 1.5, 95% CI 1.2–1.9, P < 0.001 and for CD4/CD8 ratio ≥1.0, aOR 1.5, 95% CI 1.1–2.0, P = 0.010). However, this difference lost statistical significance at the timepoint 48 weeks after VS (for CD4/CD8 ratio ≥0.5, aOR 1.1, 95% CI 0.8–1.4, P = 0.534 and for CD4/CD8 ratio ≥1.0, aOR 1.2, 95% CI 0.9–1.6, P = 0.160).
Discussion
To our knowledge this is the largest cohort assessing the impact of different ART regimens on the restoration of the CD4/CD8 ratio. In our study we found that ART with NNRTI-based regimens was associated with a significantly higher increase in the mean CD4/CD8 ratio and higher rates of CD4/CD8 ratio normalization compared with other ART regimens.
The CD4/CD8 ratio has been shown to predict increased risk of mortality and serious non-AIDS events even among ART-treated individuals achieving more than 500 CD4 T cells/uL.2 The CD4/CD8 ratio has been demonstrated to predict non-AIDS morbidity and mortality after adjustment for proximal CD4 counts in two European studies3 and CD8 T cell expansion has also been demonstrated to predict non-AIDS mortality in a Danish study.15 Given the important clinical implications, it is necessary to assess the potential differential effects of the available ART regimens on this biomarker. Previous studies have attempted to determine which ART regimen has the best performance in terms of increasing the CD4/CD8 ratio. De Salvador-Guillouët et al.7 explored the impact of ART regimens on the normalization of CD4/CD8 ratio on a group of 567 HIV-infected ART-naive patients, finding a greater benefit of INSTI regimens using a cut-off of >1.0. The differences observed between our study and the study by De Salvador-Guillouët et al.7 might be explained by the larger sample size of our cohort and also by the fact that their analysis was done by ITT and therefore changes in treatment were allowed, as opposed to ours where we studied the effect of each ART regimen independently. Both studies, however, included a small percentage of patients on an INSTI-based regimen; in their study 8% of the patients had INSTI-based regimens as initial therapy, whereas only 2% of ours had. Other studies have suggested a potential beneficial effect of INSTI-based regimens on CD4/CD8 ratio gain. This effect was also seen in two small studies where patients were switched, or intensified, from NNRTI- or PI-based regimens to raltegravir.8,9 These findings were again supported in a post hoc analysis of the STARTMRK study, where raltegravir was compared with efavirenz in combination with tenofovir/emtricitabine.10 We found that subjects in the raltegravir group achieved normalization of CD4/CD8 ratio at a cut-off of 0.4 faster than those in the efavirenz arm. However, we found no differences at other cut-offs reflecting immune restoration (i.e. 1.0 and 1.5) and the effect seemed largely dependent on a more rapid increase of CD4 T cells, without evidence of an effect on CD8 T cell dynamics. Herein, NNRTI-based regimens resulted in significantly higher rates of CD4/CD8 normalization for both cut-offs of 0.5 and 1.0. Other studies have attempted to find benefits of other ART regimens in the normalization of the CD4/CD8 ratio and have indicated a potential greater effect of NNRTI-based ART on CD4/CD8 ratio recovery. In a post hoc analysis of the MERIT study, a randomized, double-blind trial of maraviroc versus efavirenz in combination with zidovudine/lamivudine in treatment-naive HIV-infected individuals, among subjects who maintained HIV RNA suppression throughout the 5 year follow-up, we found higher rates of CD4/CD8 ratio normalization with efavirenz at the cut-offs of 0.4 and 1.0.12 In contrast to the study hypothesis, this effect was largely dependent on a greater reduction of CD8 counts observed in the efavirenz arm. Other studies support our finding, indicating that subjects under NNRTI-based ART achieving HIV RNA suppression may experience greater CD4/CD8 ratio recovery compared with other triple ART regimens. For instance, a prospective cohort including more than 500 patients also found a greater increase of the CD4/CD8 ratio in patients with NNRTI-based regimens (0.02 increase per year), compared with PI-based regimens, and a higher CD4/CD8 ratio normalization at a ≥1.0 cut-off.11 This effect was again observed in a recent post hoc analysis of the SINGLE study, where dolutegravir was compared with efavirenz in a randomized controlled trial. Even if there were no differences in the proportion of patients who reached a CD4/CD8 ratio ≥0.5 at Weeks 48 and 96, at Week 96 the proportion of patients with a CD4/CD8 ratio ≥1.0 was higher in the efavirenz group.16
In addition, findings from the ICONA cohort by Mussini et al.14 indicate a potential effect of the NRTI combination: subjects treated with zidovudine/lamivudine and stavudine/didanosine combinations were less likely to normalize their ratio compared with those receiving tenofovir/emtricitabine as backbone NRTIs. We did not adjust our results for the NRTI backbone regimens. However, we did adjust for year of ART initiation, a variable correlated with the type of NRTI backbone regimen. Nevertheless, this finding seems of less clinical significance nowadays as regimens with zidovudine/lamivudine and stavudine/didanosine are rarely used.
It is noteworthy that the NNRTI group had a significant decrease in the CD8 T cell count over both studied timelines compared with the PI-based regimens, suggesting that this phenomenon might be driving the increase and normalization of the CD4/CD8 ratio. This decrease was maintained after adjusting for cofounding variables and was not found to be significant in the INSTI group. This phenomenon was also seen in the post hoc analysis of the SINGLE trial, where the efavirenz group had a more significant decrease of CD8 T cell counts from baseline, compared with dolutegravir, with no differences in the CD4 T cell count.16 Previous studies have shown that individuals who failed to normalize the CD4/CD8 ratio had higher CD8 T cell counts at baseline.17 Several mechanisms have been proposed as regulators of CD4 and CD8 T cell counts during HIV infection,18 but the exact mechanisms remain unknown. For reasons that remain unclear, NNRTI based-regimens might be more beneficial for the homeostasis of the T cell populations.
Our study has several limitations, the first and most important being that the study was of a retrospective nature. The greater frequency of detectable HIV RNA in the PI group at the last timepoint indicates that our analyses could be influenced by a channelling bias not fully controlled for by the adjusting covariates. This implies that PIs were likely prescribed to individuals less adherent to antiretroviral drugs, likely affecting the immunological recovery. However, we still found a signal that NNRTI-based ART was associated with greater CD4/CD8 recovery and CD8 count decline in the sensitivity analyses excluding the population with detectable HIV RNA at the last timepoint. Also, we included a low number of patients with INSTI-based regimens and this fact might have affected the overall results. Indeed, the statistically significant differences were essentially detected in the comparisons between the NNRTI and PI groups, while the comparisons between INSTI and the other two groups were not statistically significant. The finding that the INSTI-based group was also significantly associated with higher rates of CD4/CD8 ratio recovery at the ≥1.0 cut-off suggests that the effect of ART on the CD4/CD8 ratio should be assessed in other cohorts with higher numbers of subjects treated with first-line INSTI-based therapy. Also, we studied ART regimens as drug classes, but there might be individual differences among the ART drugs of each drug class, or in the backbone NRTI, that have a greater effect on the CD4/CD8 ratio. Our follow-up was also limited to 48 weeks; there are studies that have shown evidence of recovery up to 15 years after ART initiation19 and therefore we might have missed later recovery of the other ART regimens, although ideally the aim would be to restore the ratio sooner. Hepatitis B was not accounted for due to lack of accuracy in the database, nor hepatitis C treatment, cytomegalovirus viraemia, sexual behaviour/activity, current drug use or concomitant comorbidities, all of which could affect the CD4/CD8 ratio.17,20,21 Lastly, we did not correlate our findings with the incidence of non-AIDS events3 and immunological markers were not measured, which was beyond the scope of our study. Despite the aforementioned limitations, the large number of patients included in our study and the ability to do robust multivariate analysis gives our study considerable strength.
In conclusion, in this retrospective, multicentre, large cohort study, we found a greater effect of NNRTI-based regimens to increase and normalize the CD4/CD8 ratio, which was explained by a higher reduction of CD8 counts compared with other ART regimens. These results highlight the importance of reporting the CD8 counts and CD4/CD8 ratio in ART clinical trials. If confirmed in randomized studies, this finding could provide a rationale to design controlled trials in patients with higher risk of persistently low CD4/CD8 ratio during ART or those failing to normalize the ratio despite adequate HIV RNA suppression.
Acknowledgements
We thank the CFAR sites involved in CNICS including University of Alabama, University of Washington, University of California, San Diego, University of California, San Francisco, Case Western Reserve University, Johns Hopkins University, Fenway Health/Harvard and University of North Carolina. We thank all the study participants who contributed to this work as well as the clinical research staff of the participating institutions who made this research possible.
Funding
CNICS is an NIH-funded programme (R24 AI067039) made possible by National Institute of Allergy and Infectious Diseases (NIAID): University of Alabama (P30 AI027767), University of Washington (P30 AI027757), University of California, San Diego (P30 AI036214), University of California, San Francisco (P30 AI027763), Case Western Reserve University (P30 AI036219), Johns Hopkins University (P30 AI094189, U01 DA036935), Fenway Health/Harvard (P30 AI060354) and University of North Carolina (P30 AI50410).
Transparency declarations
S.S.-V. has received personal fees from ViiV Healthcare, Janssen, Gilead and MSD and grants from MSD and Gilead. S.M. has received personal fees from ViiV Healthcare, Janssen, Gilead and MSD and grants from MSD, ViiV Healthcare and Gilead. C.J.A. has received speaking fees from ViiV Healthcare and a grant from Gilead. All other authors: none to declare.
References
Author notes
Santiago Moreno and Sergio Serrano-Villar contributed equally.
Members are listed in the Acknowledgements section.
