


Abstract
To assess the impact of switching to dolutegravir plus lamivudine maintenance therapy on the HIV cellular reservoir size.
This was a prospective, longitudinal, matched, controlled study. We enrolled virologically suppressed patients on stable three-drug ART who switched at baseline (BL) to dolutegravir/lamivudine (DT group) or maintained triple therapy (TT group); subjects in the TT group were matched 1:1 with those in the DT group according to age, gender, years since HIV diagnosis, years on ART and anchor drug. Total blood-associated HIV DNA levels were assessed by droplet digital PCR at BL and after 48 weeks (T48). Results were expressed as log10 HIV DNA copies/106 leucocytes.
We enrolled 40 patients in the DT group and 40 in the TT group; the two groups were homogeneous for all main characteristics except nadir CD4 cell count. At BL, HIV DNA levels were comparable between the DT and TT groups: 2.27 (IQR 1.97–2.47) and 2.26 (IQR 2.05–2.61) log10 HIV DNA copies/106 leucocytes, respectively. Change in HIV DNA load from BL to T48 was −0.105 (IQR −0.384 to 0.121, P = 0.041) in the DT group and −0.132 (IQR −0.362 to 0.046, P = 0.005) in the TT group, with a comparable decline observed between the two groups (P = 0.821). A higher HIV DNA decline was associated with higher BL CD4/CD8 ratio.
Maintenance therapy with dolutegravir/lamivudine had the same impact as the triple regimen on HIV DNA levels after 48 weeks of treatment. These data seem to support the effectiveness of a dolutegravir/lamivudine dual regimen in controlling the magnitude of the cellular reservoir (www.clinicaltrials.gov, number NCT02836782).
Introduction
Recently, the use of two-drug ART has been investigated in HIV-infected patients to combine virological efficacy with limited long-term antiretroviral drug exposure and reduced costs, when compared with standard three-drug ART. In the setting of virological suppression, some dual regimens have demonstrated comparable effectiveness to triple ART for maintenance therapy.1 In particular, the combination of dolutegravir plus lamivudine has shown encouraging efficacy in recent clinical trials and observational studies; moreover, when compared with other virologically effective two-drug combinations, dolutegravir/lamivudine had several advantages in terms of lower risk of drug interactions and metabolic complications.2–6 Thus, this strategy seems to constitute a good novel option as a two-drug maintenance regimen and is gaining popularity. However, it has yet to be determined whether differences in the evolution of the HIV reservoir can be observed when this drug reduction strategy is compared with standard three-drug ART.
The quantification of total HIV DNA levels in peripheral blood cells is the most accessible marker in current use for estimating the HIV cellular reservoir size7 and it could be a useful tool for monitoring treatment. Indeed, total HIV DNA could represent a clinically relevant marker predictive of the long-term success of ART, since it has been related to residual viraemia, cumulative viraemia and low-level inflammation.8 On this basis, it can be used to investigate changes in HIV reservoir dynamics following treatment switches in patients under successful therapy. Here we aimed to investigate changes in total HIV DNA levels following a switch to dolutegravir/lamivudine versus maintaining a triple standard combination in virologically suppressed patients.
Patients and methods
Study design
This was a prospective, longitudinal, matched, controlled study performed between June 2016 and June 2019. Eligible subjects were HIV-infected outpatients, attending healthcare facilities at the Department of Infectious Diseases of the University Hospital ‘Fondazione Policlinico Universitario A. Gemelli IRCCS’ in Rome, who were on a stable (>48 weeks) three-drug ART regimen (anchor drug + two NRTI backbone) with plasma HIV RNA <50 copies/mL for ≥48 weeks and CD4 cell count >200 cells/mm3. The study group consisted of patients who switched to dolutegravir 50 mg/lamivudine 300 mg once daily, based on the clinician’s decision. For the control group, we identified and recruited an equal number of HIV-infected outpatients who fulfilled the abovementioned inclusion criteria. They maintained their triple therapy and were matched 1:1 with the subjects of the study group according to age, gender, years since HIV diagnosis, years on ART and type of anchor drug. All of the enrolled subjects gave their informed consent and the study was approved by our local ethics committee (www.clinicaltrials.gov, number NCT02836782). Patients were followed from baseline (BL) [defined as the date of treatment switch for the dual therapy group (DT group) and the date of enrolment for the control group (triple therapy, TT group)] to 48 weeks (T48). Residual viraemia (HIV RNA < 50 copies/mL) was categorized as a dichotomous variable: detectable (1–49 copies/mL) or undetectable (0 copies/mL). Virological rebound was defined as any HIV RNA determination ≥50 copies/mL that occurred during the follow-up.
Total HIV DNA quantification
We assessed total blood-associated HIV DNA levels at the two different timepoints (BL and T48) by droplet digital PCR (ddPCR) using a 5′ nuclease assay targeting the HIV-LTR region by the QX200™ Droplet Digital™ PCR System (Bio-Rad Laboratories, Inc., Hercules, CA, USA) using a home-made protocol validated for both B and non-B subtypes, as previously described.9,10 A duplex amplification by ddPCR was performed to concurrently quantify total HIV DNA and a housekeeping (albumin) gene. Each sample was run in triplicate. Levels of HIV DNA were log-transformed and expressed as log10 HIV DNA copies/106 leucocytes. The assay limit of detection was 1.63 log10 copies/106 leucocytes.
Statistical analysis
Due to the explorative nature of the study, no power calculation was performed a priori; we planned to include a sufficient number of patients in each study group so as to establish an adequate sample size with regard to both the study design and the nature of the explored variable. Specifically, the adequacy of the sample size was based on: (i) selected inclusion criteria to obtain a homogeneous population for those variables that could influence the HIV cellular reservoir; (ii) strict matching between the study group and the control group; and (iii) the analysed study variables (i.e. log10 HIV DNA copies/106 leucocytes and change in HIV DNA) that were normally distributed and with equal variance between the study group and the control group.
Student’s t-test was used to compare the HIV DNA levels between the two groups at BL and T48, respectively. Student’s t-test for paired samples was used to compare the differences in HIV DNA levels between BL and T48 within each group. Univariable linear regressions were used to explore demographic, clinical and viroimmunological factors associated with BL HIV DNA and with the change in HIV DNA levels between BL and T48 (change in HIV DNA); variables significantly associated with HIV DNA levels in the univariable analysis were then included in a multivariable model. An alpha level of 0.05 was used to evaluate significance. All statistical analyses were performed in SPSS version 22.0 (IBM, SPSS, Chicago, IL, USA).
Results
Overall, 80 subjects were enrolled: 40 in the DT group and 40 in the TT group; all patients completed the follow-up. The characteristics of the patients at BL are summarized in Table 1. When compared, the two groups were homogeneous for all demographical and clinical characteristics, except for the nadir CD4 cell count, which was significantly higher in the DT group. The main reason for switching to dolutegravir/lamivudine was a proactive treatment switch (81%); secondary reasons included toxicity (12.5%), drug interactions (5%) and side effects (1.5%). During follow-up, one patient in each group exhibited a single virological rebound at T48 (HIV RNA 96 and 58 copies/mL in the DT and TT groups, respectively).
Characteristics of patients at BL
| All patients (n = 80) | DT group (n = 40) | TT group (n = 40) | P | |
|---|---|---|---|---|
| Gender, n (%) | ||||
| male | 64 (80.0) | 32 (80.0) | 32 (80.0) | 1.000 |
| female | 16 (20.0) | 8 (20.0) | 8 (20.0) | |
| Age, years, median (IQR) | 54.1 (42.8–59.2) | 54.1 (43.0–58.9) | 53.9 (42.5–59.8) | 0.724a |
| Caucasian, n (%) | 73 (91.3) | 38 (95.0) | 35 (87.5) | 0.235 |
| Subtype, n (%) | 0.650 | |||
| B | 34 (42.5) | 16 (40.0) | 18 (45.0) | |
| non-B | 9 (11.3) | 5 (12.5) | 4 (10.0) | |
| unknown | 37 (46.2) | 19 (47.5) | 18 (45.0) | |
| Risk factor, n (%) | 0.747 | |||
| homosexual/bisexual | 38 (47.5) | 19 (47.5) | 19 (47.5) | |
| heterosexual | 33 (41.3) | 18 (45.0) | 15 (37.5) | |
| IVDU | 6 (7.5) | 2 (5.0) | 4 (10.0) | |
| unknown/others | 3 (3.7) | 1 (2.5) | 2 (5.0) | |
| Time since HIV diagnosis, years, median (IQR) | 12.3 (5.6–20.8) | 12.6 (6.1–19.8) | 12.3 (4.9–21.8) | 0.441a |
| Time on ART, years, median (IQR) | 10.2 (3.8–19.8) | 10.0 (3.0–19.7) | 10.2 (4.1–20.3) | 0.772a |
| Time since last detectable viral load (≥50 copies/mL), years, median (IQR) | 6.8 (2.9–12.2) | 7.8 (2.0–12.6) | 5.9 (3.2–10.9) | 0.661a |
| Time between HIV diagnosis and start of therapy, years, median (IQR) | 0.13 (0.05–1.63) | 0.16 (0.05–1.79) | 0.11 (0.05–1.57) | 0.237b |
| Pre-ART HIV RNA, log10 copies/mL, median (IQR) | 4.8 (4.1–5.4) | 4.7 (4.0–5.4) | 4.8 (4.1–5.5) | 0.798a |
| CD4 cell count nadir, cells/mm3, median (IQR) | 218 (59–346) | 244 (122–406) | 157 (36–314) | 0.011a |
| HIV RNA undetectable at BL (0 copies/mL), n (%) | 64 (80.0) | 32 (80.0) | 32 (80.0) | 1.000 |
| Previous virological failure, n (%) | 33 (41.3) | 16 (40.0) | 17 (42.5) | 0.820 |
| CD4 cell count at BL, cells/mm3, median (IQR) | 686 (535–830) | 720 (555–838) | 675 (529–779) | 0.422a |
| CD4 cell count at BL, cells/mm3, n (%) | 1.000 | |||
| 200–500 | 16 (19.5) | 8 (20.0) | 8 (20.0) | |
| >500 | 64 (80.0) | 32 (80.0) | 32 (80.0) | |
| CD4/CD8 ratio at BL, median (IQR) | 0.97 (0.62–1.32) | 1.05 (0.56–1.33) | 0.88 (0.67–1.32) | 0.861a |
| Past AIDS-defining events, (CDC category C) n (%) | 22 (27.5) | 10 (25.0) | 12 (30.0) | 0.617 |
| HCV coinfection, n (%) | 7 (87.5) | 2 (5.0) | 5 (12.5) | 0.235 |
| Anchor drugs in the triple therapy, n (%) | 1.000 | |||
| INSTIs | 42 (52.5) | 21 (52.5) | 21 (52.5) | |
| dolutegravir | 28 (66.7) | 14 (66.7) | 14 (66.7) | |
| elvitegravir | 12 (28.5) | 6 (28.5) | 6 (28.5) | |
| raltegravir | 2 (4.8) | 1 (4.8) | 1 (4.8) | |
| NNRTIs | 30 (37.5) | 15 (37.5) | 15 (37.5) | |
| rilpivirine | 24 (80.0) | 12 (80.0) | 12 (80.0) | |
| efavirenz | 4 (13.3) | 2 (13.3) | 2 (13.3) | |
| nevirapine | 2 (6.7) | 1 (6.7) | 1 (6.7) | |
| PIs | 8 (10.0) | 4 (10.0) | 4 (10.0) | |
| darunavir/ritonavir | 8 (75.0) | 3 (75.0) | 3 (75.0) | |
| atazanavir/ritonavir | 2 (25.0) | 1 (25.0) | 1 (25.0) | |
Parametric test, Student’s t-test.
Non-parametric test, Mann–Whitney U-test.
Median HIV DNA log10 copies/106 leucocytes measured at the two timepoints and changes from BL to T48 according to treatment group are shown in Figure 1. At BL, HIV DNA levels were comparable between the two groups: 2.27 (IQR 1.97–2.47) and 2.26 (IQR 2.05–2.61) log10 copies/106 leucocytes in the DT and TT groups, respectively (P = 0.100). When we evaluated the percentage of subjects with an undetectable HIV DNA level (i.e. below the assay limit of detection), there was no difference between the two groups (5.0% in both groups). At T48, median HIV DNA levels were 2.17 (IQR 1.87–2.31) and 2.13 (IQR 1.92–2.45) log10 copies/106 leucocytes in the DT and TT groups, respectively, with no difference between groups (P = 0.222). Both groups showed a parallel total HIV DNA decay after 48 weeks from BL; the median change from BL to T48 was −0.105 log10 copies/106 leucocytes (IQR −0.384–0.121, P = 0.041) in patients who simplified to dolutegravir/lamivudine and −0.132 log10 copies/106 leucocytes (IQR −0.362–0.046, P = 0.005) in patients who maintained the triple regimen, with no significant differences between the two groups (P = 0.821). When we performed a sensitivity analysis removing the two patients who experienced virological rebound during follow-up we found no difference in HIV DNA changes with respect to the main results (data not shown). In both groups the viroimmunological profile (i.e. proportion of patients with detectable/undetectable residual viraemia, CD4 cell count, CD4/CD8 ratio and proportion of subjects with undetectable HIV DNA) did not significantly change from BL to T48.
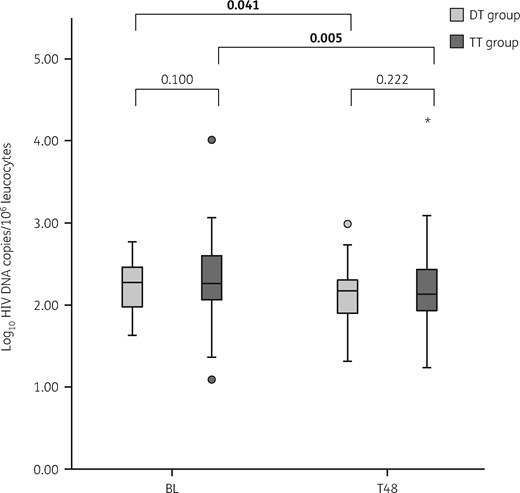
Dynamics of HIV DNA levels at the two different timepoints according to the study (DT) and control (TT) groups. The boxes represent the 25th and 75th quartiles, the median is presented as a line inside the box. The whiskers represent values within ± 1.5×IQR. Circles and stars show the outliers with values between 1.5× to 3× the IQR, and >3×IQR, respectively. Student’s t-test was used to compare the HIV DNA levels between the two groups at BL and T48, respectively. The paired Student’s t-test was used to compare the differences in HIV DNA levels between the two timepoints (BL and T48) within each group. P values <0.05 were considered statistically significant and are shown in bold.
When factors related to delta change HIV DNA were analysed, a higher decline in HIV DNA levels was only associated with a higher BL CD4/CD8 ratio (per +1 unit, mean change −0.150 log10 copies/106 leucocytes, 95% CI −0.297 to −0.003; P = 0.046) (Table S1, available as Supplementary data at JAC Online).
Regarding BL HIV DNA levels, in the multivariable analysis pre-therapy viral load (per +1 log10 HIV RNA, mean change +0.127 log10 copies/106 leucocytes, 95% CI 0.020–0.234; P = 0.021) and non-Caucasian race (mean change +0.559, 95% CI 0.188–0.929; P = 0.007) were associated with higher HIV DNA levels and nadir CD4 cell count (per +100 cells, mean change −0.085, 95% CI −0.148 to −0.022; P = 0.009) was associated with lower levels (Table S2).
Discussion
There are no published data regarding the impact of dolutegravir/lamivudine maintenance therapy on cellular HIV DNA levels compared with triple ART. However, an observation from the single-arm ANRS167 LAMIDOL trial suggests that in virally suppressed patients switching treatment from a triple regimen [based on two NRTIs and a third agent of boosted PI, NNRTI or integrase strand transfer inhibitor (INSTI)] to dolutegravir/lamivudine could have a favourable effect on the cellular reservoir in terms of control of HIV DNA levels after 48 weeks.11 Here, we showed that after 48 weeks of treatment this simplification strategy had the same impact on the cellular viral reservoir as the triple regimen. In fact, similar changes in HIV DNA levels were observed in the DT group and the TT group.
The evolution of cellular reservoir size during effective ART is controversial. Several studies initially showed that total HIV DNA levels drop rapidly during the first year of ART and then show a subsequent slower decline from Years 1–4 until they reach a plateau phase where no further decay can be observed.12,13 In contrast, several recent studies found that, after several years of suppressive ART, HIV DNA levels continued to slowly decline.14,15 The authors suggested that this decay of HIV DNA during effective ART may reflect the ongoing loss of HIV-infected cells partially counterbalanced by clonal proliferation of infected cells. In line with these latter findings, we still observed a significant decrease in HIV DNA levels in our patients who were long-term virologically suppressed with a median of 10 years of ART exposure. These data suggest that margins for reducing the size of the HIV reservoir are still present after several years of effective therapy and that the drug reduction strategy probably does not jeopardize this achievement. In our study, we found that the HIV DNA change was positively associated with the BL CD4/CD8 ratio. It is known that patients on long-term suppressive ART show progressive CD4 cell recovery although, at the same time, they maintain a persistent and chronic immune activation status, with subsequent incomplete restoration of the CD4/CD8 ratio, which is associated with more frequent clinical events.16 Thus, a low CD4/CD8 ratio indicates a high degree of immune activation and enhanced homeostatic proliferation of HIV-infected CD4 lymphocytes, which may result in the persistence of high-level HIV DNA reservoirs, as previously observed.17,18 The relationship observed between BL HIV DNA load and lower nadir CD4 cell count or higher pre-ART viral load supports the evidence of an association between pre-therapeutic history and viral burden in patients on ART.8,19
Some limitations should be acknowledged. First, our study had a relatively small sample size; also, it was designed as a longitudinal clinical-based cohort study and was not powered as a randomized study. Several unmeasured or uncontrolled biases might influence the results of observational non-randomized studies and this should be taken into account in the interpretation of our results.
Nevertheless, the study was strengthened by matching the study and the control group for several clinically relevant variables (i.e. age, gender, years since HIV diagnosis, years on ART and the same molecule as anchor drug), thus potentially limiting the confounders. At BL, the two groups were comparable for all variables except nadir CD4 cell count, which was significantly higher in the DT group. As a potential confounder, nadir CD4 cell count was explored in the regression analysis; however, no association was observed between nadir CD4 cell count and HIV DNA change after 48 weeks. In contrast to clinical trials that explored the treatment switch to dolutegravir/lamivudine,6 our population mainly included patients with a long treatment history (i.e. median time on ART 10 years); therefore, it might not be completely representative of the entire HIV-infected population. In any case, the patients included in our study were those switched to dual therapy during clinical practice at our centre and their characteristics provide a snapshot of ‘real-life’ data that might be quite different from the data collected in clinical trials. Finally, a further strength of our study was that HIV DNA quantification was performed by ddPCR, a technique that has been shown to improve the accuracy and precision of this measurement as compared with traditional assays.20
In conclusion, we observed similar total HIV DNA dynamics in the blood of patients switching to dolutegravir/lamivudine and those maintaining triple therapy. Our results add important new data that support the effectiveness of dolutegravir/lamivudine maintenance therapy in terms of its control of the magnitude of the HIV cellular reservoir, which needs to be confirmed in larger cohorts.
Acknowledgements
We wish to thank Dr Francesca Ceccherini-Silberstein and Dr Rossana Scutari (Department of Experimental Medicine, Tor Vergata University, Rome, Italy) and Dr Claudia Alteri (Department of Oncology and Hemato-oncology, University of Milan, Italy) for their technical support in the setting of ddPCR.
Funding
This work was supported by internal funding.
Transparency declarations
M.F. received speakers’ honoraria and support for travel to meetings from Bristol-Myers Squibb (BMS), Gilead, Janssen-Cilag, Merck Sharp & Dohme (MSD) and ViiV Healthcare, and fees for attending advisory boards from BMS, Gilead and Janssen-Cilag. R.C. has been an advisor for Gilead, Janssen-Cilag and Basel Pharmaceutical, has received speakers’ honoraria from ViiV Healthcare, BMS, MSD, Abbott, Gilead and Janssen-Cilag, and has received research support from ‘Fondazione Roma’. S.D.G. was a paid consultant or member of advisory boards for Gilead, ViiV Healthcare, Janssen-Cilag, MSD and BMS. All other authors: none to declare.
Supplementary data
Tables S1 and S2 are available as Supplementary data at JAC Online.
