


Abstract
The global spread of carbapenem-resistant Enterobacterales (CRE) and Acinetobacter baumannii (CRAB) has prompted the reintroduction of colistin as a last-resort treatment. Although the recommended method for colistin susceptibility testing is broth microdilution (BMD), methods that are more rapid and easy to use are needed.
To evaluate the performance of two commercial kits for colistin susceptibility testing: Rapid Polymyxin™ NP (RP-NP) for CRE and Rapid Polymyxin™ Acinetobacter (RP-AB) for CRAB.
A total of 76 CRE and 87 CRAB isolates were collected from hospitalized patients in Europe and Israel. The isolates were subcultured twice on 5% sheep blood in tryptic soy agar. We tested colistin susceptibility using the RP-NP and RP-AB kits and compared the results with those from BMD.
Of the CRE isolates, 25% (19/76) were resistant to colistin using BMD. Categorical agreement between RP-NP and BMD was 93.4% (71/76), major errors 1.8% (1/57) and very major errors 21.1% (4/19). Sensitivity was 78.9% and specificity was 98.2%. Of the CRAB isolates, 58.6% (51/87) were resistant to colistin by BMD. Categorical agreement between RP-AB and BMD was 59.8% (52/87), major errors 13.9% (5/36) and very major errors 58.8% (30/51). Sensitivity of RP-AB was 41.2% and specificity was 86.1%.
In many of the tested isolates, weak or inconclusive colour changes in the test wells caused difficulty in interpretation, resulting in an unacceptable rate of very major errors.
Introduction
The incidence of infections caused by MDR Acinetobacter baumannii and Enterobacterales is increasing around the globe. Specifically, resistance to carbapenems is a growing concern worldwide.1 Recent country-level surveillance of blood and CSF isolates in Europe found carbapenem resistance in a mean of 33.4% of Acinetobacter baumannii isolates and 7.2% of Klebsiella pneumoniae isolates.2 Among hospital-acquired pathogens in the USA in 2014, 50% of A. baumannii, 19% of Pseudomonas aeruginosa and 8% of K. pneumoniae were resistant to carbapenems.1 Infections caused by carbapenem-resistant A. baumannii (CRAB) and carbapenem-resistant Enterobacterales (CRE) are associated with high mortality due to limited treatment options and delayed appropriate treatment; recent studies have reported 30 day mortalities of 58% following CRAB infections and 49% following CRE bloodstream infection.3,4
Colistin is rarely used to treat infections caused by organisms susceptible to other antibiotics because of its unfavourable safety profile and overall low clinical efficacy. However, limited treatment options for carbapenem-resistant Gram-negative infections have led to its use as a last-resort agent.5 Susceptibility testing for colistin in the clinical laboratory is challenging. Colistin is cationic and adheres to the polymers from which most testing plates are made, causing unreliable results. Additionally, owing to its high molecular weight, colistin has poor diffusion in agar, resulting in invalid results with diffusion-based methods such as Etest or disc diffusion.6,7 Similarly, several reports have shown unacceptable error rates when using automated methods such as VITEK™ 2 and BD Phoenix™ to determine colistin susceptibility.8,9 Presently, the method recommended by EUCAST and CLSI for colistin susceptibility detection is broth microdilution (BMD).10 However, this method is difficult to integrate in the routine testing of Gram-negative isolates in clinical laboratories. Simple, rapid and accurate methods are required to determine colistin susceptibility.
Nordmann et al.11 developed the rapid polymyxin NP, a rapid screening test for the detection of polymyxin resistance in Enterobacterales and Acinetobacter spp. The assay is based on colorimetric detection of glucose metabolism (implying bacterial growth) in the presence of fixed colistin concentrations and it provides results within 2–4 h of incubation. Several studies have evaluated the home-made rapid polymyxin NP method on Enterobacterales.11–18
Recently, two commercial kits based on this method have become available as rapid and easy-to-use alternatives to BMD: Rapid Polymyxin™ NP (RP-NP) and Rapid Polymyxin™ Acinetobacter (RP-AB). Very few evaluations have been conducted on the RP-NP19,20 and on the RP-AB test.20,21
In this study, we compared colistin susceptibility testing by the commercial kits RP-NP for Enterobacterales and RP-AB for Acinetobacter spp. with BMD as the reference method.
Materials and methods
Isolates
The sample consisted of 163 clinical isolates: 87 CRAB (47 from blood, 35 from sputum/tracheal aspirate/bronchoalveolar lavage, 4 from urine and 1 from an abdominal drain) and 76 CRE (20 from blood, 18 from urine, 11 from sputum, 9 from wounds and 18 from other sites). All were non-duplicate isolates from hospitalized patients in Europe and Israel between the years 2013 and 2017. All isolates were identified to the species level by VITEK® MS or VITEK® 2 (bioMérieux SA, Marcy l’Etoile, France). The isolates were stored at −80°C and subcultured twice on 5% sheep blood in tryptic soy agar (Hylabs, Rehovot, Israel) at 35 ± 2°C before further testing.
A total of 87 CRAB strains (meropenem MIC >8 mg/L) were selected for this study. Forty-one strains with a colistin MIC close to the breakpoint (2–4 mg/L) were purposely included in order to challenge the performance of the test.
All CRE isolates had a meropenem MIC >8 mg/L. The sample included K. pneumoniae (n = 36), Enterobacter spp. (n = 25), Citrobacter spp. (n = 3) and Escherichia coli (n = 12). Forty isolates (52.6%) were carbapenemase-producing Enterobacterales (CPE): blaKPC (n = 21), blaOXA-48-like (n = 8), blaNDM (n = 9), blaIMI (n = 1) and blaVIM (n = 1). The molecular identification of resistance mechanisms was performed by PCR using a multiplex assay as described previously.22,23 The other 36 isolates, which did not carry any of the above carbapenemase bla genes and did not have a positive carbapenem hydrolysis assay, were classified as non-carbapenemase-producing (non-CP) CRE.
Meropenem and colistin susceptibility determinations
Meropenem MIC determination was performed twice using BMD (customized Sensititre™ plates, ThermoFisher Scientific, Oakwood Village, OH, USA) according to the ISO 20776-1 guidelines.24 All strains were tested at meropenem concentrations ranging from 0.5 to 64 mg/L. In case of discrepancy between duplicates, the final MIC was determined by Etest® (bioMérieux SA). P. aeruginosa ATCC 27853 with a known MIC of ≤1 mg/L was used as a quality control.
Colistin susceptibility was performed twice using BMD (MICRONAUT MIC-Strip Colistin, Merlin Diagnotiska, Bornheim, Germany) and once using a home-made assay according to the ISO 20776-1 guidelines (ISO 20776-1:2019, 2019) and the recommendations of the CLSI-EUCAST Polymyxin Breakpoints Working Group.10 All strains were tested at colistin concentrations ranging from 0.5 to 8 mg/L. In case of discrepancy, an additional BMD test was performed. E. coli ATCC 25922 (MIC <0.5 mg/L), P. aeruginosa ATCC 27853 (MIC 0.5–4 mg/L), A. baumannii ATCC 19606 (MIC 0.5 mg/L) and E. coli NCTC 13846 (colistin resistant, mcr-1 positive) with a known MIC of 4 mg/L were used as quality controls.
Plates were incubated overnight at 35 ± 2°C and read using the Sensititre™ Manual Viewer (ThermoFisher Scientific, Waltham, MA, USA). Susceptibilities were defined using EUCAST breakpoints.25
RP-AB and RP-NP assays
The principle of RP-AB and RP-NP assays is based on the colorimetric detection of glucose metabolization associated with bacterial growth. Acidification of the culture medium following glucose metabolization results in a colour change (red to yellow) of the pH indicator (phenol red). The assays were performed according to the manufacturer’s instructions (ELITechGroup, Puteaux, France). Both kits have a negative control well with no bacteria, a positive control well with bacterial suspension but no colistin, and one (RP-NP) or two (RP-AB) test wells containing both colistin and bacterial suspension. For the RP-NP test, CRE suspensions were prepared in a medium provided in the kit from an overnight growth on blood agar to a turbidity of 3–3.2 McFarland. One hundred microlitres of the bacterial suspension was placed in the positive well and another 100 μL in the test well. A mix of medium (75 μL) and NaCl (25 μL) was placed in the negative well. After 2 h of incubation at 35 ± 2°C, a result can be read when a colour change (from red towards yellow) is observed in the positive well; no colour change occurs in the negative well. In the test well, a colour identical to the positive control is read as resistant. If no colour change occurs after 2 h, an additional 1 h of incubation is needed to determine a final result using the same criteria. If there is still no colour change, or a colour change has occurred but is dissimilar to the positive well, the result is read as susceptible. E. coli ATCC 25922 with a known MIC of 0.5 mg/L and E. coli NCTC 13846 (colistin resistant, mcr-1 positive) with a known MIC of 4 mg/L were used as quality controls.
For CRAB isolates, RP-AB was performed according to the manufacturer’s instructions. The process was similar to the RP-NP test except for two differences: in RP-AB there are two test wells containing fixed colistin concentrations of 2 and 4 mg/L, and the incubation time is 3 h with an additional 1 h of incubation if no colour change is observed in the test wells. The RP-AB test gives three possible results: (i) susceptible (MIC ≤2 mg/L) if no colour change is observed in both test wells; (ii) resistant (MIC = 4 mg/L) if a colour change identical to the positive control well is observed only in the 2 mg/L well; and (iii) resistant (MIC >4 mg/L) if a colour change identical to the positive control well is observed in both test wells. A. baumannii ATCC 19606 (colistin MIC 0.5 mg/L) and A. baumannii with mutations in pmrB (A138T) lpxD (E117K) with a known colistin MIC of 32 mg/L were used as quality controls.
For BMD, RP-AB and RP-NP we used a calibrated nephelometer (DensiCHEK, bioMérieux SA) to ensure a consistent inoculum. To reduce variability, RP-AB/RP-NP and BMD were conducted in parallel. In case of discrepancy between RP-AB/RP-NP and BMD, the two tests were repeated. Results were blindly read, interpreted and recorded by one microbiologist.
Data analysis
The results of RP-AB and RP-NP were compared with the results of the reference BMD method. Categorical agreement (CA), major errors (MEs) and very major errors (VMEs) were determined. Unacceptable levels were >3.0% for VMEs and >3.0% for MEs.26 Specificity and sensitivity were calculated27 and confidence intervals were determined.28 Essential agreement was not determined because the RP-AB and RP-NP do not provide an exact MIC.
Results
CRAB analysis
Results of the commercial and home-made BMD tests were identical for all CRAB isolates. The colistin susceptibilities and MIC distribution using BMD for the 87 CRAB isolates are presented in Table 1. Of the 87 isolates, 58.6% (51/87) were resistant to colistin (MIC >2 mg/L). Of these isolates, 22/87 (25.3%) had a colistin MIC = 4 mg/L and 29/87 (33.3%) had a colistin MIC ≥8 mg/L. Using the RP-AB assay, 26 (30%) of the 87 isolates were classified as resistant and 61 isolates (70%) were classified as susceptible. All resistant isolates were identified within the first 3 h; the additional hour of incubation did not reveal other resistant isolates.
Colistin susceptibility and range of MICs determined by BMD
| Phenotypea | MIC (mg/L)b | ||||||||
|---|---|---|---|---|---|---|---|---|---|
| Organism tested | Isolates | S (≤2 mg/L) | R (>2 mg/L) | ≤0.5 | 1 | 2 | 4 | 8 | >8 |
| CRAB | 87 (100.0) | 36 (41.4) | 51 (58.6) | 5 (5.7) | 12 (13.8) | 19 (21.8) | 22 (25.3) | 18 (20.7) | 11 (12.6) |
| CRE/CPE | |||||||||
| K. pneumonia | 36 (47.4) | 19 (33.3) | 17 (89.5) | 16 (34.0) | 1 (20.0) | 2 (40.0) | 0 | 2 (66.7) | 15 (93.8) |
| E. coli | 12 (15.8) | 12 (21.1) | 0 (0.0) | 10 (21.3) | 1 (20.0) | 1 (20.0) | 0 | 0 | 0 |
| Enterobacter spp. | 25 (32.9) | 23 (40.4) | 2 (10.5) | 18 (38.3) | 3 (60.0) | 2 (40.0) | 0 | 1 (33.3) | 1 (6.3) |
| Citrobacter freundii | 3 (3.9) | 3 (5.3) | 0 | 3 (6.4) | 0 | 0 | 0 | 0 | 0 |
| Total | 76 (100.0) | 57 (75.0) | 19 (25.0) | 47 (61.8) | 5 (6.6) | 5 (6.6) | 0 | 3 (3.9) | 16 (21.1) |
All results shown are n (%).
S, susceptible; R, resistant.
The MIC breakpoint for susceptible is ≤2 mg/L and for resistance is >2 mg/L according to EUCAST.
Comparison of RP-AB and BMD and the performance characteristics of RP-AB are presented in Figure 1. The CA was 59.8% (52/87, 95% CI 49.3%–69.5%), MEs 13.9% (5/36, 95% CI 6.1%–28.7%) and VMEs 58.8% (30/51, 95% CI 45.2%–71.2%). Figure 2 shows the error distribution by colistin MIC. All MEs occurred in isolates with an MIC of 2 mg/L. The VMEs occurred in isolates with BMD MICs of 4 mg/L (n = 18), 8 mg/L (n = 9) and >8 mg/L (n = 3). Most errors (23/35, 65.7%) were observed in isolates with an MIC near the clinical breakpoint.
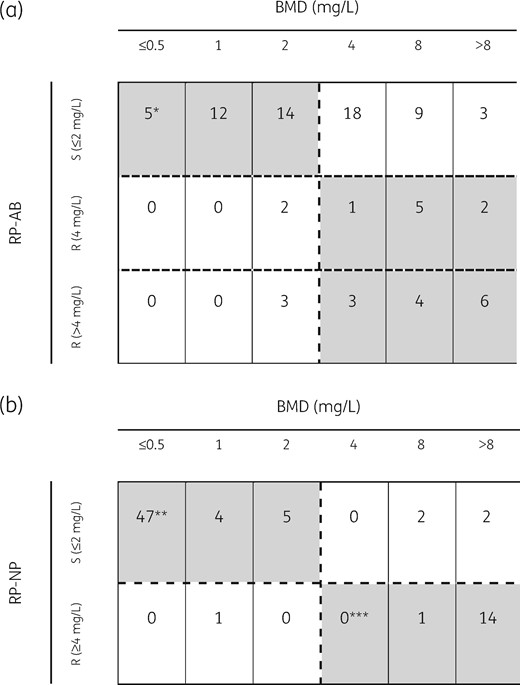
Comparison of RP-AB and RP-NP assays with BMD. Colistin susceptibility obtained by (a) RP-AB and (b) RP-NP compared with BMD for 87 CRAB and 76 CRE isolates, respectively. Categorical agreement is highlighted in grey. The dashed horizontal and vertical lines represent the clinical breakpoint value established by EUCAST. *A. baumannii ATCC 19606 (colistin MIC 0.5 mg/L), **E. coli ATCC 25922 (colistin susceptible) and ***E. coli NCTC 13846 (mcr-1 positive, colistin-resistant) are included as quality control strains.

VME and ME distribution using (a) RP-AB and (b) RP-NP kits, by colistin MIC as determined by BMD. The percentages represent the relative rate of errors (VMEs or MEs) for each MIC value.
According to the manufacturer’s instructions for RP-AB, similarity in colour shades between the test wells and the negative control wells indicates susceptibility (Figure 3). In 83.3% (25/30) of the isolates causing VMEs, the colour changes were inconclusive. Because the hue in the test wells was dissimilar to the positive well, these isolates were interpreted as susceptible (Figure 3), resulting in many misclassifications. Compared with BMD, the RP-AB assay had a sensitivity of 41.2% and a specificity of 86.1%.

Results interpretation of the RP-AB assay. Representative colour changes of (a) susceptible (MIC ≤2 mg/L) (the two test wells are similar to each other and to the negative well and different from the positive well) and (b) intermediate (MIC 4 mg/L) strains (the first test well is similar to the positive well and the second test well is similar to the negative well). (c and d) There are two types of possible colour changes representing a resistant phenotype (MIC >4 mg/L). In (c), the positive well and the two test wells are yellow and differ from the red negative well. In (d), the positive well and the two test wells are orange and differ from the red negative well. The colour (yellow to orange) in the positive well differs between strains. (e–g) Three examples of difficult-to-interpret colour changes. All isolates have a colistin MIC of ≥4 mg/L, so the two test wells should have the same colour as the positive well (yellow/orange) and a different colour from the negative well (red). This figure appears in colour in the online version of JAC and in black and white in the print version of JAC.
RP-AB and BMD tests were repeated for the 35 isolates that exhibited a discrepancy between the two tests: 5 MEs and 30 VMEs. On repeat testing, the MIC by BMD was reproducible for all 35 isolates. For the 30 isolates that were initially classified as susceptible by RP-AB and resistant by BMD (VMEs), 19 were now classified by RP-AB as resistant and 11 continued to be misclassified as susceptible. Interpretation of colour change continued to be difficult for some isolates. Even if the results had remained unchanged for all but these 30 retested isolates, VMEs would be 21.6% (11/51, 95% CI 11.3%–35.3%) and MEs 11.1% (4/36, 95% CI 3.1%–26.1%).
Of the 19 isolates with RP-AB results that changed upon retesting, 11 (57.9%) had MICs close to the clinical breakpoint: 3 isolates with MICs of 2 mg/L and 8 isolates with MICs of 4 mg/L. For the five isolates that were initially classified as resistant by RP-AB and susceptible by BMD (MEs), upon retesting, four isolates remained resistant and one was now classified by RP-AB as susceptible.
The quality control isolates, ATCC 19606 (colistin MIC 0.5 mg/L) and colistin-resistant A. baumannii (colistin MIC 32 mg/L), produced identical results in different test runs. There was no difficulty in colour interpretation.
CRE analysis
Results of the commercial and home-made BMD tests were identical for all CRE isolates. The colistin susceptibilities and MIC distribution of the 76 CRE isolates using BMD are presented in Table 1. Of the CRE strains, 75.0% (57/76) were susceptible (MIC ≤2 mg/L) and 25.0% (19/76) were resistant (MIC ≥8 mg/L). There were no isolates with an MIC of 4 mg/L.
Using the RP-NP assay, 16 (21%) of the 76 isolates were classified as resistant and 60 isolates (79%) were classified as susceptible. All resistant isolates were identified within the first 2 h; the additional hour of incubation did not uncover other resistant isolates.
Comparison of RP-NP and BMD and the performance characteristics of RP-NP are presented in Figure 1. The CA was 93.4% (71/76, 95% CI 85.6%–97.2%), MEs were 1.8% (1/57, 95% CI 0.3%–9.3%) and VMEs were 21.1% (4/19, 95% CI 8.5%–43.3%). VMEs were observed in two isolates of K. pneumoniae (colistin MIC 8 and >8 mg/L) harbouring the blaKPC gene, one non-CP Enterobacter cloacae (colistin MIC 8 mg/L) and one non-CP Enterobacter aerogenes (colistin MIC >8 mg/L). As seen in Figure 2, there was no clear relationship between errors and colistin MIC.
In three of these four isolates classified as VME, interpretation of colour changes was difficult due to strain-to-strain variation in the colour of test wells compared with the positive well, as with RP-AB. The single ME was a KPC-producing K. pneumoniae isolate with a colistin MIC of 1 mg/L. Compared with BMD, the RP-NP assay had a sensitivity of 78.9% and a specificity of 98.2%. RP-NP and BMD tests were repeated for the five isolates that exhibited a discrepancy between the two tests (one ME and four VMEs), resulting in the same errors as the initial test.
The quality control isolates, E. coli ATCC 25922 (colistin MIC 0.5 mg/L) and colistin-resistant NCTC 13846 (colistin MIC 4 mg/L), produced identical results in different test runs. There was no difficulty in colour interpretation.
Discussion
The main finding of this study was that RP-AB and RP-NP had a very high rate of VME (58.8% and 21.1%, respectively). In comparison, in two previous studies evaluating the performance of the RP-NP kit for CRE, one with 136/223 colistin-resistant isolates19 and the second with 14/27 colistin-resistant isolates,20 the VME rate was much lower (<2%). Likewise, two previous studies evaluating the performance of the RP-AB kit for CRAB also reported lower VME rates than we found: 0%21 and 16.7%.20 Both of these studies had a sample size of <30 isolates with few colistin-resistant isolates (6 out of 1621 and 12 out of 2120).
There are several possible explanations for the higher VME rates observed in our study. First, many of the errors in our study were due to difficulty in interpreting the colour changes. RP-NP and RP-AB assays are based on colorimetric detection of glucose metabolism, indicating bacterial growth. Metabolism of glucose causes acidification of the culture medium, resulting in colour change of the pH indicator (phenol red) from red to orange-yellow. Previous studies have noted this same limitation, with both the home-made method12 and the industrial kits.20 Belda-Orlowski et al.12 suggested improving the tests’ performance by replacing the visual reading with spectrophotometry.
Second, nearly half of our CRAB sample (41/87, 47.1%) had a borderline MIC (2–4 mg/L). We observed that most errors (23/35, 65.7%) occurred in these isolates. In contrast, in the study by Karatuna et al.20 there was only one isolate in this MIC range and in Jayol et al.’s study there were four.19 We intentionally enriched our sample with isolates near the clinical breakpoint because these isolates present the greatest challenge for determining colistin susceptibility.29 We had access to only five CRE isolates with an MIC close to the breakpoint and none had mcr-mediated resistance to colistin. Therefore, we could not determine whether isolates close to the breakpoint were particularly prone to VME.
A third possible explanation why our VME rate was higher than previously reported is the inoculum effect. It may be that small differences within the recommended turbidity range have a large effect on test results. When we repeated the RP-NP/RP-AB tests on 34 isolates categorized as VME (30 CRAB and 4 CRE), 23 (67.6%) no longer disagreed with BMD. A slight difference in inoculum could explain this change. Notably, 13 of these 23 isolates (56.5%) had a colistin MIC near the clinical breakpoint; isolates near the clinical breakpoint are especially sensitive to the inoculum effect.30
Despite the limitations of these kits, they are among the few options available to determine colistin susceptibility. In our study, the MEs using the RP-NP kit were in the acceptable range (<3%). Therefore, if using this kit, results for colistin-resistant CRE isolates can be reported with high confidence; susceptible results should be confirmed using BMD.
Several methods are emerging as alternatives to BMD. Previously, we have recommended combining testing by VITEK™ 2 and agar dilution, and then performing BMD only when results are discrepant.29 A new system combining MALDI-TOF proteomic analysis and additional negative-ion mass spectra mode to determine colistin resistance in less than 15 min has been described.31 A modified assay based on resazurin has been proposed as an alternative colorimetric indicator for testing non-fermenters.32
In conclusion, in our evaluation of the RP-AB and RP-NP assays, results were difficult to interpret and poorly correlated with the results of BMD testing, yielding an unacceptably high VME rate. It might be possible to improve these assays by using objective and sensitive methods for comparative colour reading or by changing the colour indicator. In the meantime, we do not recommend their routine use.
Acknowledgements
We thank Elizabeth Temkin for her helpful comments on this manuscript.
Funding
The work on this article was performed as part of the work of the National Center for Infection Control of the Israel Ministry of Health (internal funding).
Transparency declarations
Y.C. has received research funding from MSD, AstraZeneca, Allecra Therapeutics, DaVoltera, bioMérieux SA, Nariva, Achoagen, Roche, Pfizer, Shionogi, VenatoRx and Qpex Pharmaceuticals. All other authors: none to declare.
References
National Healthcare Safety Network-CDC. Carbapenem-Resistant Enterobacteriaceae spp.
European Centre for Disease Prevention and Control. Surveillance of Antimicrobial Resistance in Europe
EUCAST. Recommendations for MIC determination of colistin (polymyxin E) as recommended by the joint CLSI-EUCAST Polymyxin Breakpoints Working Group. http://www.eucast.org/fileadmin/src/media/PDFs/EUCAST_files/General_documents/Recommendations_for_MIC_determination_of_colistin_March_2016.pdf.
International Organization for Standardization. ISO 20776-1:2016. Susceptibility Testing of Infectious Agents and Evaluation of Performance of Antimicrobial Susceptibility Test Devices—Part 1: Broth Micro-dilution Reference Method for Testing the in vitro Activity of Antimicrobial Agents Against Rapidly Growing Aerobic Bacteria Involved in Infectious Diseases. International Organization for Standardization,
EUCAST. European Committee on Antimicrobial Susceptibility Testing Breakpoint Tables for Interpretation of MICs and Zone Diameters 2019.
International Organization for Standardization. ISO20776-2:2007. Clinical Laboratory Testing and in vitro Diagnostic Test Systems-Susceptibility Testing of Infectious Agents and Evaluation of Performance of Antimicrobial Susceptibility Test Devices—Part 2: Evaluation of Performance of Antimicrobial Susceptibility Test. International Organization for Standardization,
National Center for Advancing Translational Sciences, National Institutes of Health. Sample Size Calculators for Designing Clinical Research. http://www.sample-size.net/confidence-interval-proportion/.
