


Abstract
Pharmacokinetic (PK)–pharmacodynamic (PD) indices relate measures of drug exposure to antibacterial effect. Clinical PK–PD studies aim to correlate PK–PD indices with outcomes in patients. Optimization of dosing based on pre-clinical studies means that PK–PD relationships are difficult to establish; therefore studies need to be designed and reported carefully to validate pre-clinical findings.
To describe the methodological features of clinical antibacterial and antifungal PK–PD studies that reported the relationship between PK–PD indices and clinical or microbiological responses.
Studies published between 1980 and 2015 were identified through systematic searches. Methodological features of eligible studies were extracted.
We identified 85 publications containing 97 PK–PD analyses. Most studies were small, with fewer than 100 patients. Around a quarter were performed on patients with infections due to a single specific pathogen. In approximately one-third of studies, patients received concurrent antibiotics/antifungals and in some other studies patients received other treatments that may confound the PK–PD–outcome relationship. Most studies measured antimicrobial concentrations in blood/serum and only four measured free concentrations. Most performed some form of regression, time-to-event analysis or used the Hill/Emax equation to examine the association between PK–PD index and outcome. Target values of PK–PD indices that predict outcomes were investigated in 52% of studies. Target identification was most commonly done using recursive partitioning or logistic regression.
Given the variability in conduct and reporting, we suggest that an agreed set of standards for the conduct and reporting of studies should be developed.
Introduction
Pharmacokinetics (PK) and pharmacodynamics (PD) are central to an understanding of how best to employ anti-infective medications. PK and PD considerations ensure that patient outcomes are optimized, since they inform the choice, dose and frequency of appropriate anti-infectives, the potential use of combinations, decisions about duration of treatment and definitions for categorizing the infecting pathogen as susceptible or resistant to therapy.
The PK and PD properties of antimicrobials are often considered simultaneously to form PK–PD indices, for example the ratio of the peak concentration of the antimicrobial (Cmax) to the MIC (Cmax/MIC).
Knowledge of the PK–PD index that best predicts treatment efficacy, and the magnitude of that index that is associated with optimal outcomes, can be used to guide antimicrobial treatment. This can maximize the possibility of both successful clinical outcome and pathogen eradication, which in turn may help to prevent the development of drug-resistant pathogens.
The study of PK–PD is an iterative process whereby pre-clinical (in vitro and in vivo) experiments, population PK models and in silico simulations are used to investigate potential dosing regimens and PK–PD targets. These studies can be used to inform regimen selection for clinical studies.
Numerous clinical PK–PD studies of antimicrobials have been performed. They generally aim to investigate the relationship between PK–PD indices and either clinical or microbiological response (or some element of these outcomes, or both) in patients. In some cases, they have sought to determine the target magnitude of a PK–PD index to increase the probability of successful outcome during therapy. Relationships between PK–PD indices and response, and PK–PD targets for efficacy may be difficult to find in clinical PK–PD studies if pre-clinical development has been performed well. Clinical PK–PD studies are required to confirm conclusions from pre-clinical studies and to provide information for future use to calibrate pre-clinical systems more closely to clinical circumstances. In addition, there are concerns that many of these clinical PK–PD studies have limitations including: small size (<100 patients); not limiting analyses to populations with similar pathogens and sites of infection; not measuring free-drug concentration; not being designed with a primary PD endpoint in mind; and not adjusting analyses for confounders such as source control or comorbidities. There is also uncertainty over how results should be analysed and how PK–PD index targets for efficacy should be identified. In addition, there may be a bias in the literature towards reporting positive results.
It is therefore timely to perform a systematic review of the methodological features of clinical PK–PD studies of antibacterials and antifungals. Here we review articles published between 1980 and 2015 that reported the relationship between PK–PD indices and some form of clinical or microbiological response. In addition to summarizing the methodological features of these studies, we had a secondary goal of finding examples of good practice that might be used to inform future PK–PD analyses.
Materials and methods
Inclusion and exclusion criteria
We sought clinical PK–PD studies that related a calculated PK–PD index to the probability of clinical or microbiological cure (or some element of either of these outcomes).
We included nested case–control, cohort studies and randomized controlled trials published since 1980 in English. We excluded conference abstracts, due to the lack of methodological detail, and case reports, due to the inability to link a PK–PD index with outcome. Participants had to have a bacterial or fungal infection, although we excluded studies on patients with mycobacterial infections. We included studies of combination therapy and studies that pooled patients treated with different antimicrobials of the same class when performing analyses, but we excluded studies that pooled different classes of antimicrobials as PK–PD indices and targets are class specific.
Eligible studies had to measure the concentration of an antimicrobial in a biological material for all patients in the analysis and use this concentration in the calculation of the PK–PD index (directly, by creating a population PK model or by using the concentrations in conjunction with a previously constructed PK model). We excluded studies that estimated PK parameters using only values of covariates in a population PK model to which the included patients did not contribute concentration measurements. We excluded studies that did not measure microbial susceptibility of an isolated causative pathogen and instead used, for example, breakpoints for susceptibility or the distribution of MICs for a particular pathogen. We excluded inhibitory/bactericidal titres in either urine or serum due to the methodological problems with these assays.
Eligible outcomes were any measure of treatment response or failure. We included studies that analysed statistically or described the association between PK–PD index and outcome. We excluded studies that had only development of resistance as an outcome.
Search strategy
We searched MEDLINE, Embase, Web of Science and BIOSIS up to 22 July 2015 using a combination of MeSH headings and free-text search terms for PK–PD indices, antibiotics and antifungals, and treatment outcome. Full search strategies for each database are presented in the Supplementary data (available as Supplementary data at JAC Online). In addition, we tried to find full journal articles corresponding to relevant conference abstracts that had been identified in the search, we hand-searched reference lists of included studies and P.G.A., S.M.B., G.L.D., W.W.H. and J.W.M. ratified the list of included studies and provided any missing studies that met our inclusion criteria.
Selection of studies
One author (A.M.) sifted the titles and abstracts. At the title and abstract stage, conference abstracts and foreign-language papers were not excluded as they were used to identify English language versions or additional studies. Potentially relevant studies were obtained and full texts were assessed for eligibility by one author (A.M.).
Data extraction
We extracted data on study characteristics including population, antibiotic analysed, how PK parameters were derived, how bacterial susceptibility was determined, PK–PD indices calculated, outcomes and timing of outcome assessment, methods used to explore the relationship between PK–PD index and outcome, industry funding and results of the study. Study characteristics were extracted from each publication without recourse to other cited references. The full list of items extracted is given in the Supplementary data.
When a single publication included studies performed on different groups of patients, data on each cohort were extracted as a separate PK–PD analysis, providing no analysis had been performed on all patients combined. If patients received therapy with different antimicrobials and separate PK–PD analyses were performed per antimicrobial, these were also extracted as separate PK–PD analyses.
One author (A.M.) extracted the data. In all situations, if numbers were not reported they were calculated from available data where possible.
Results
Study selection and description
We identified 6095 records after deduplication. Of the 348 full-text studies assessed, we included 85 publications. Ten publications included multiple analyses (studies).1–10 In total, 97 PK–PD analyses were included in the review. The flow chart for study inclusion is shown in Figure 1. Features of the included analyses are presented by class in Table 1 and study-level details are presented in the Supplementary data (Tables S1 to S5).
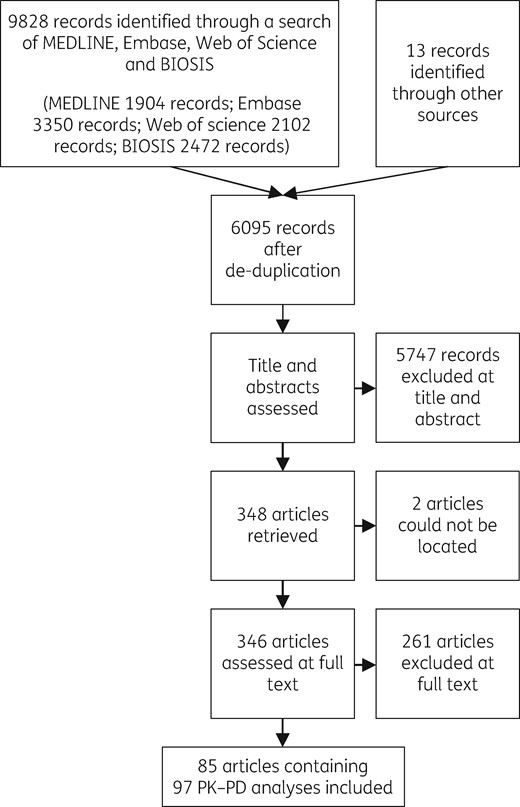
Flow chart for study inclusion. Reasons for exclusion at the full-text stage are given in the Supplementary data.
Features of the included clinical PK–PD studies, by antimicrobial class
| Antimicrobial class | No. of studies | Industry funded, n (%) | Specific antibiotic (no. of studies) | Participants, mean (range) | Studies with ≥100 participants, n (%) | Infections (no. of studies) | Single pathogen, no. of studies (%) | Concurrent antibiotics or antifungals, no. of studies (%)a |
|---|---|---|---|---|---|---|---|---|
| Aminoglycoside3,4,10–14,31–33,59,72–74 | 16 | 2 (13) | amikacin (5), arbekacin (2), gentamicin (1), isepamicin (1), tobramycin (3), multiple aminoglycosides (4) | 52 (13–236) | 1 (6) | bacteraemia (1), infections in cystic fibrosis (5), multiple (4), nosocomial pneumonia (including ICU-acquired pneumonia and VAP) (3), sepsis (3) | 7 (44) | 11 (69) |
| Cyclic lipopeptide52,55,75 | 3 | 0 (0) | daptomycin (3) | 27 (6–41) | 0 (0) | cardiovascular implantable electronic device endocarditis (1), multiple (2) | 0 (0) | 1 (33) |
| Cyclic peptide/polymyxin44 | 1 | 0 (0) | colistin (1) | 20 (20–20) | 0 (0) | ventilator-associated tracheobronchitis (1) | 0 (0) | 0 (0) |
| Echinocandin (antifungal)1,9,37 | 5 | 5 (100) | anidulafungin (4), caspofungin (1) | 44 (11–100) | 1 (20) | invasive aspergillosis (1), candidiasis (1), oesophageal candidiasis (1), invasive candidiasis, including candidaemia (1), mucosal candidiasis (1) | 0 (0) | 1 (20) |
| Glycopeptide2,48,53,68,69,76–81 | 12 | 4 (33) | norvancomycin (2), oritavancin (1), vancomycin (9) | 73 (20–139) | 3 (25) | bloodstream infections/bacteraemia (5), complicated bacteraemia; infective endocarditis (1), concomitant MRSA bacteraemia and MRSA osteomyelitis (1), infective endocarditis (1), multiple (4) | 9 (75) | 8 (67) |
| Ketolide5,70 | 4 | 3 (75) | telithromycin (4) | 85 (22–115) | 2 (50) | community-acquired pneumonia (4) | 3 (75) | 0 (0) |
| Macrolide63 | 1 | 1 (100) | azithromycin (1) | 101 (101–101) | 1 (100) | respiratory tract infections (1) | 0 (0) | 0 (0) |
| Oxazolidinone24,28,58 | 3 | 1 (33) | linezolid (3) | 83 (2–239) | 1 (33) | endocarditis (1), multiple (2) | 1 (33) | 1 (33) |
| Polyene (antifungal)82 | 1 | 0 (0) | amphotericin B (liposomal) (1) | 9 (9–9) | 0 (0) | multiple (1) | 0 (0) | 0 (0) |
| Quinolone6,7,16–19,26,34,39,42,45,47,50,51,61,65,67,83–85 | 21 | 8 (38) | ciprofloxacin (4), garenoxacin (3), gatifloxacin (3), grepafloxacin (3), levofloxacin (6), sitafloxacin (1), sparfloxacin (1) | 58 (4–216) | 3 (14) | chronic bronchitis (1), multiple (3), nosocomial lower respiratory tract infections (1), nosocomial pneumonia (including VAP) (3), otitis media (1), respiratory tract infections (5), secondary infections of chronic respiratory diseases (1), AECB (3), intra-abdominal infections (1), acute maxillary sinusitis (2) | 2 (10) | 3 (14) |
| Tetracycline20–23,29,40,41 | 7 | 6 (86) | doxycycline/hydroxychloroquine (1), tigecycline (6) | 62 (15–123) | 1 (14) | community-acquired pneumonia (1), cSSSIs (1), hospital-acquired pneumonia (2), Q fever endocarditis (1), cIAIs (2) | 1 (14) | 1 (14) |
| Triazole (antifungal)1,25,38 | 3 | 2 (67) | cyclodextrin/itraconazole (1), voriconazole (2) | 151 (23–404) | 1 (33) | invasive aspergillosis (1), oropharyngeal candidosis (1), invasive fungal infections (1) | 0 (0) | 1 (33) |
| β-Lactam7,8,10,15,27,30,35,36,43,49,54,56,57,60,62,64,66,86,87 | 20 | 6 (30) | amoxicillin/clavulanic acid (1), cefaclor advanced formulation (1), cefazedone (1), cefepime (1), cefmenoxime (3), cefoperazone/sulbactam (1), ceftazidime (2), ceftobiprole (1), ertapenem (1), imipenem (or imipenem/cilastatin) (2), meropenem (3), piperacillin/tazobactam (1), tebipenem pivoxil (1), multiple β-lactams (1) | 42 (6–309) | 1 (5) | acute otitis media (1), acute pulmonary exacerbations of cystic fibrosis (1), community-acquired pneumonia (1), cSSSIs (1), febrile neutropenia (1), lower respiratory tract infections (1), meningitis (1), multiple (3), nosocomial pneumonia (including ICU-acquired pneumonia and VAP) (6), respiratory tract infections (1), sepsis (1), VAP and signs of severe sepsis or septic shock (1), AECB (1) | 1 (5) | 6 (30) |
| Total | 97 | 38 (39) | 59 (2–404) | 15 (15) | 24 (25) | 33 (34) |
AECB, acute exacerbation of chronic bronchitis; VAP, ventilator-associated pneumonia.
Concurrent antibiotics when antibiotic under investigation; concurrent antifungals when antifungal under investigation.
The 97 analyses included comprised 88 analyses of antibacterials and 9 analyses of antifungals. The most studied class of antimicrobial was the quinolones (21 studies). For several classes of antimicrobials (polymyxins, macrolides and polyenes) only one study was identified. The antimicrobial with the most studies was vancomycin (nine studies). Five studies examined a mix of antibiotics of the same class: four on aminoglycosides [gentamicin or tobramycin (two studies)11,12 or gentamicin, tobramycin or amikacin (two studies)]13,14 and one on β-lactams (ceftriaxone, cefepime or piperacillin).15
Overall, 38 studies (39%) reported at least some industry/commercial funding, 39 (40%) reported that they had no funding, or were funded by a non-industrial source, and the funding source was not reported in 20 studies (21%). It was clear that some PK–PD analyses were performed on the same patients, although this was not investigated systematically. There was overlap in the populations used in Peloquin et al.,16 Forrest et al.17 and Goss et al.;7 in Meinl et al.18 and Forrest et al.;19 in Passarell et al.20 and Bhavnani et al.;21 and in Ambrose et al.22 and Bhavnani et al.23
Population characteristics, site of infection and infecting organisms
Most PK–PD analyses were small, containing 59 patients on average (range 2–404).24,25 Only 15 analyses (15%) studied more than 100 patients. Only two of the included studies made any comparison between the patients included in the study and patients excluded.26,27
The analyses included patients with a wide range of infections. Most investigated patients with a single type of infection, but 19 studies (20%) included patients with a variety of different infections (categorized as ‘multiple’ infections in Table 1). In general, inclusion into the studies was based solely on both having an infection (sometimes limited by pathogen) and being treated with a particular antibiotic. Some studies addressed classes of infection, such as complicated intra-abdominal infections (cIAIs) or complicated skin and skin-structure infections (cSSSIs), which encompass several different infections. One study split their analyses by site of infection after finding in multivariable analyses that differences in outcome were due to site of infection in addition to antibiotic exposures and PK–PD indices.28
In 24 studies (25%), analyses were performed on patients with infections due to a particular pathogen. Staphylococcus aureus was the most studied pathogen (13 studies). The other studies of individual pathogens investigated infections due to Coxiella burnetii,29,Haemophilus influenzae,5,Pseudomonas aeruginosa (six studies)3,30–33 and Streptococcus pneumoniae (three studies).5,6,34 PK–PD analyses of glycopeptides were the most likely of all the antimicrobial classes to be performed on patients with infection due to a particular pathogen. Other studies only included patients infected with a restricted number of pathogens (for example, infections with S. pneumoniae and/or H. influenzae35 or P. aeruginosa and/or Acinetobacter baumannii)36 or limited the analysis to patients infected with a single genus or family (for example, Aspergillus,1,Candida,37,38,Haemophilus39 or Enterobacteriaceae).21 Several studies subdivided their cohort depending on infecting pathogen, but were not categorized as being monomicrobial as the subcohorts were subsequently recombined in the analyses.20,40,41 Two studies sequentially combined the subcohorts they had created, based on the infecting pathogen, and found statistically significant relationships between PK–PD indices and outcomes when certain combinations of patients were pooled, but that these relationships disappeared when additional patients were added to the analyses.20,41 They attributed this to the infecting pathogen becoming so heterogeneous that the relationship between PK–PD indices and outcomes was occluded.
We did not extract specific eligibility criteria for each study, but we observed that several studies used infection with a resistant organism as an exclusion criterion. Although it would be regarded as ethical to administer antibiotics with a high probability of successfully treating an infection, if all patients are infected with susceptible organisms, MICs (or equivalent) will be low and it is therefore likely that PK–PD indices will be high for all patients. This makes it unlikely that a relationship between PK–PD index and outcome will be observed.
Because microbiological and clinical cure are associated with eradication of pathogens, receipt of effective antimicrobials in addition to the antimicrobial under investigation may obscure the PK–PD–outcome relationship of interest. In 20 studies (21%), it was explicitly reported that no patients received concurrent antibiotics/antifungals or that the receipt of concomitant antibiotics/antifungals was an exclusion criterion. However, in 33 studies (34%), some patients received concurrent antibiotics or antifungals and in the remaining 44 studies (45%) it was unclear or not reported. Some studies included receipt of concurrent antimicrobials as a potential confounder in multivariable analyses (discussed below).
Depending on the type of infection and on patients’ comorbidities, patients could have received other treatments concurrently with the antimicrobials. Concurrent treatments may also confound the PK–PD–outcome relationship. Some studies reported that patients had the source of the infection removed by surgery. This is important for some infections, for example cSSSIs, cIAIs, endocarditis and bacteraemia/sepsis secondary to central line infection. In some cases it was reported that non-infectious treatment was ‘standardized’31 or that a ‘standard treatment protocol’30 was used. Other studies included concomitant pharmacotherapy and surgery (or probability of a surgical or radiological procedure being successful in controlling the source of infection) as potential covariates in multivariable models. Study-level data are presented in Table S1.
Determination of PK–PD indices
Details of how studies determined PK–PD indices, summarized by antimicrobial class, are presented in Table 2. We included studies only if they measured antimicrobial concentration in at least one matrix and these concentrations enabled an estimate of the PK. Nearly all studies [95 (98%)] measured antimicrobial concentration in blood, serum or plasma. In the remaining two studies the biological source was not reported.22,40 Antimicrobial concentration was also measured in sputum (three studies);33,42,43 bronchoalveolar lavage44 (using it to calculate PK–PD indices in epithelial lining fluid); middle ear effusion;35 urine (two studies,32,33 which developed population PK models to characterize the serum concentration and urinary excretion data simultaneously); and sinus aspirate (two studies,34,45 in which the plasma and sinus aspirate concentrations were modelled simultaneously).
Data used to determine PK–PD indices in clinical PK–PD studies, by antimicrobial class
| Antimicrobial class | No. of studies | PK | Antimicrobial susceptibility | |||||||||
|---|---|---|---|---|---|---|---|---|---|---|---|---|
| biological material sampled (no. of studies) | number of samples, mean (range)a | sample collection timing reported, no. of studies (%)b | method for determining drug concentration reported, no. of studies (%) | free-drug concentration measured, no. of studies (%)c | protein- binding adjustment, no. of studies (%)d | population PK model used, no. of studies (%)e | measure of antimicrobial susceptibility (no. of studies) | method of measurement reported, no. of studies (%) | measurement in accordance with guidelines/ recommendation, no. of studies (%)f | strategy if more than one pathogen/ strain, no. of studies (%) | ||
| Aminoglycoside | 16 | blood/serum (16), sputum (1), urine (2) | 7 (1–24) | 14 (88) | 14 (88) | 0 (0) | 2 (13) | 10 (63) | MIC (16) | 14 (88) | 5 (31) | 8 (50) |
| Cyclic lipopeptide | 3 | blood/serum (3) | 4 (2–9) | 2 (67) | 3 (100) | 0 (0) | 0 (0) | 1 (33) | MIC (3), MBC (1) | 1 (33) | 0 (0) | 1 (33) |
| Cyclic peptide/ polymyxin | 1 | blood/serum (1), bronchoalveolar lavage fluid (1) | 7 (7–7) | 1 (100) | 1 (100) | 0 (0) | 0 (0) | 0 (0) | MIC (1) | 1 (100) | 0 (0) | 0 (0) |
| Echinocandin (antifungal) | 5 | blood/serum (5) | 6 (3–9) | 4 (80) | 1 (20) | 0 (0) | 0 (0) | 5 (100) | MIC (5) | 4 (80) | 4 (80) | 1 (20) |
| Glycopeptide | 12 | blood/serum (12) | 2 (1–11) | 5 (42) | 5 (42) | 1 (8) | 3 (27) | 7 (58) | MIC (12) | 11 (92) | 8 (67) | 8 (67) |
| Ketolide | 4 | blood/serum (4) | 2 (1–3) | 3 (75) | 4 (100) | 0 (0) | 0 (0) | 4 (100) | MIC (4) | 4 (100) | 3 (75) | 4 (100) |
| Macrolide | 1 | blood/serum (1) | 8 (8–8) | 1 (100) | 1 (100) | 0 (0) | 0 (0) | 1 (100) | MIC (1) | 1 (100) | 1 (100) | 1 (100) |
| Oxazolidinone | 3 | blood/serum (3) | 8 (3–18) | 1 (33) | 2 (67) | 0 (0) | 0 (0) | 1 (33) | MIC (2), MBC (1) | 2 (67) | 0 (0) | 0 (0) |
| Polyene (antifungal) | 1 | blood/serum (1) | 13 (13–13) | 1 (100) | 1 (100) | 0 (0) | 0 (0) | 1 (100) | MIC (1) | 1 (100) | 0 (0) | 0 (0) |
| Quinolone | 21 | blood/serum (21), sputum (1), sinus aspirate (2) | 6 (1–12) | 16 (76) | 20 (95) | 2 (10) | 5 (26) | 15 (71) | MIC (18), MIC midpoint (3) | 17 (81) | 11 (52) | 10 (48) |
| Tetracycline | 7 | blood/serum (5), not reported (2) | 2 (1–5) | 4 (57) | 2 (29) | 0 (0) | 3 (43) | 5 (71) | MIC (7) | 5 (71) | 3 (43) | 5 (71) |
| Triazole (antifungal) | 3 | blood/serum (3) | 7 (1–16) | 1 (33) | 2 (67) | 0 (0) | 1 (33) | 1 (33) | MIC (3) | 2 (67) | 2 (67) | 0 (0) |
| β-Lactam | 20 | blood/serum (20), middle ear effusion (1), sputum (1) | 5 (1–9) | 12 (60) | 19 (95) | 1 (5) | 9 (47) | 11 (55) | MIC (17), MIC midpoint (1), dynamic response (2) | 18 (90) | 4 (20) | 9 (45) |
| Total | 97 | 5 (1–24) | 65 (67) | 75 (77) | 4 (4) | 23 (25) | 62 (64) | 81 (84) | 41 (42) | 47 (48) | ||
Mean number of samples taken per patient as reported in results. If range only reported, lower number taken. If number taken not reported but the timing of samples was reported, the number of samples taken was estimated by counting the number of timepoints. If number taken not reported and timing not reported, but it was clear that concentration of antibiotic in biological material had been measured, it was assumed that one sample had been taken. Note: if the study created a population PK model, the number of samples was the number of samples per patient who contributed to the population PK model.
Had to report more than just ‘peak’ or ‘trough’.
Stated that free-drug concentration was measured.
Percentage of studies that did not measure free-drug concentrations.
Had to explicitly state that a population PK model was used or judged by A.P.M. to have used/constructed a population PK model.
For example, CLSI, National Committee for Clinical Laboratory Standards (NCCLS), BSAC or Japan Society of Chemotherapy guidelines.
Most antimicrobials are protein bound to some degree, but only the unbound (free) fraction is considered active, since antimicrobial binding to serum albumin and other proteins may affect penetration and the ability of a drug to bind at its site of activity. It has been recommended that all PK–PD indices should be calculated relative to the unbound fraction of the drug.46 Four studies measured free concentrations, using ultrafiltration to isolate unbound drug.47–50 A further 23 studies adjusted for protein binding by proportionate scaling of the concentrations measured. However, proportionate scaling assumes that the fraction of antimicrobial that is protein bound is constant (i.e. not patient specific). However, changes in a patient’s condition may change protein and albumin levels and alter the free fraction of the drug. One study compared total and free concentrations of vancomycin.48 It found that the correlation between free and total concentrations was adequate at the population level, but the free/total ratio varied between different samples.
A population PK model was used in 62 (64%) of the studies. We categorized the population PK models according to the population from which they were constructed. Eight studies used a population PK model constructed only from the participants in the analysis. Twenty-two studies used a population PK model that was constructed from patients from the same cohort or randomized controlled trial (i.e. treated for the same infection with the same antimicrobial over the same time period), but not all patients were in the analysis associating the PK–PD index with the outcome (because, for example, some patients did not have pathogen susceptibility data or outcome data). Eleven studies used a population PK model that was constructed from patients in the analysis but also patients with different infections and/or healthy volunteers. Two studies used population PK models constructed from different populations. Eighteen studies referenced the population PK model, but the population used to construct the PK model was not described adequately to categorize it. One study did not describe the population PK model and it was not referenced.51
Some studies used the population PK model for some analyses, but not for all. For example, Okusanya et al.33 constructed a population PK model for serum and urinary excretion data and used it to calculate serum AUC, but the sputum AUC on Days 1 and 14 was calculated using the linear trapezoidal rule. These studies were classified as using a population PK model. Study-level data are presented in Table S2.
Approximately half of studies reported the strategy adopted if more than one strain/pathogen was identified. Strategies included excluding patients with polymicrobial infections, calculating PK–PD indices on a per-pathogen basis, using the least-susceptible pathogen for calculation of the PK–PD index and choosing the pathogen deemed most likely to be responsible for the infection. In many cases the source of the pathogen and the exact timing of collection were not reported, but we presumed that pathogens were isolated prior to therapy and from an appropriate source. Study-level data are presented in Table S3.
Further detail regarding determination of antimicrobial drug concentrations in biological matrices and determination of antimicrobial drug susceptibility is given in the Supplementary data.
PK–PD indices determined
The types of PK–PD indices calculated are presented in Table 3. The PK–PD index that was most commonly calculated was a ratio of AUC to some measure of microbial susceptibility, but this varied by antimicrobial class. Of the antimicrobial classes with >10 studies identified, a ratio of Cmax to some measure of microbial susceptibility was the most common PK–PD index calculated for aminoglycosides, a ratio of AUC to some measure of microbial susceptibility was the most common PK–PD index calculated for glycopeptides and quinolones, and time that the concentration exceeded (T>) some measure of microbial susceptibility was the most common PK–PD index calculated for β-lactams. Just under half of the identified studies [n = 45 (46%)] calculated more than one index. We did not observe any particular trend over time in the choice of PK–PD index calculated for each class of antimicrobial (data not shown). A number of studies investigated other PK–PD indices. The other PK–PD indices calculated included a ratio of pre-dialysis concentration to MIC,11 ratio of average concentration to MIC (two studies),13,25 ratio of concentration at steady-state to MIC,49 intensity index (AUC above MIC)(two studies)14,15 and ratio of concentration to MIC or to MBC (three studies).24,29,39 Study-level data are presented in Table S3.
Type and number of PK–PD indices determined in clinical PK–PD studies, by antimicrobial class
| Antimicrobial class | No. of studies | No. of studies (%) that calculated some form of: | Other PK–PD indices (no. of studies) | ≥2 indices, no. of studies (%) | ≥3 indices, no. of studies (%) | ≥4 indices, no. of studies (%) | |||
|---|---|---|---|---|---|---|---|---|---|
| AUC/measure of microbial susceptibility | Cmax/measure of microbial susceptibility | Cmin/measure of microbial susceptibility | T>measure of microbial susceptibility | ||||||
| Aminoglycoside | 16 | 10 (63) | 13 (81) | 2 (13) | 3 (19) | pre-dialysis concentration/MIC (1), average concentration/MIC (1), intensity index (1) | 10 (63) | 5 (31) | 0 (0) |
| Cyclic lipopeptide | 3 | 2 (67) | 1 (33) | 0 (0) | 0 (0) | none | 0 (0) | 0 (0) | 0 (0) |
| Cyclic peptide/ polymyxin | 1 | 1 (100) | 1 (100) | 0 (0) | 1 (100) | none | 1 (100) | 1 (100) | 0 (0) |
| Echinocandin (antifungal) | 5 | 5 (100) | 1 (20) | 1 (20) | 0 (0) | none | 1 (20) | 1 (20) | 0 (0) |
| Glycopeptide | 12 | 9 (75) | 1 (8) | 4 (33) | 3 (25) | none | 4 (33) | 1 (8) | 0 (0) |
| Ketolide | 4 | 4 (100) | 3 (75) | 0 (0) | 0 (0) | none | 3 (75) | 0 (0) | 0 (0) |
| Macrolide | 1 | 1 (100) | 0 (0) | 0 (0) | 0 (0) | none | 0 (0) | 0 (0) | 0 (0) |
| Oxazolidinone | 3 | 2 (67) | 0 (0) | 0 (0) | 2 (67) | concentration/MBC (1) | 2 (67) | 0 (0) | 0 (0) |
| Polyene (antifungal) | 1 | 1 (100) | 1 (100) | 0 (0) | 0 (0) | none | 1 (100) | 0 (0) | 0 (0) |
| Quinolone | 21 | 20 (95) | 11 (52) | 3 (14) | 6 (29) | concentration/MIC (1) | 11 (52) | 6 (29) | 3 (14) |
| Tetracycline | 7 | 6 (86) | 0 (0) | 0 (0) | 0 (0) | concentration/MIC (1) | 0 (0) | 0 (0) | 0 (0) |
| Triazole (antifungal) | 3 | 2 (67) | 1 (33) | 1 (33) | 1 (33) | Cavg/MIC (1) | 1 (33) | 1 (33) | 1 (33) |
| β-Lactam | 20 | 10 (50) | 7 (35) | 5 (25) | 19 (95) | free concentration at steady-state/MIC (1), AUC above MIC (1) | 11 (55) | 8 (40) | 3 (15) |
| Total | 97 | 73 (75) | 40 (41) | 16 (16) | 35 (36) | 45 (46) | 23 (24) | 7 (7) | |
Cavg, average concentration.
Outcomes
The outcomes assessed are presented in Table 4. The two most common outcomes were clinical response [n = 48 (49%)] and bacteriological response [n = 41 (42%)]. We did not examine in detail how these terms were defined in the individual studies. However, we note the possibility of some misclassification: for example, in one paper, ‘clinical cure’ was defined as a composite of clinical and bacteriological cure.52 Some studies examined specific outcomes that could contribute towards ‘clinical cure’.
Outcomes investigated in clinical PK–PD studies, by antimicrobial class
| Antimicrobial class | No. of studies | Composite measure of treatment failure or success, no. of studies (%) | Bacteriological response, no. of studies (%) | Time to bacteriological response, no. of studies (%) | Clinical response, no. of studies (%) | Time to clinical response, no. of studies (%) | Mortality, no. of studies (%) | Other outcomes (no. of studies) | Timing of outcome assessment reported, no. of studies (%)a | At least one outcome at the end of therapy, no. of studies (%)a |
|---|---|---|---|---|---|---|---|---|---|---|
| Aminoglycoside | 16 | 2 (13) | 2 (13) | 0 (0) | 6 (38) | 0 (0) | 3 (19) | SOFA score > 3 at Day 7 (1), duration of mechanical ventilation (1), development of acute kidney injury (1), improvement/change in pulmonary function tests (including forced expiratory volume in 1 s and forced vital capacity) (5), change in inflammatory parameters (CRP, leucocyte count and IgG) (2), time (days) to temperature resolution (1), time (days) to leucocyte count resolution (1), change in the number of cfu (2) | 12 (75) | 6 (38) |
| Cyclic lipopeptide | 3 | 0 (0) | 0 (0) | 0 (0) | 2 (67) | 0 (0) | 1 (33) | none | 2 (67) | 1 (33) |
| Cyclic peptide/ polymyxin | 1 | 0 (0) | 1 (100) | 0 (0) | 0 (0) | 0 (0) | 0 (0) | none | 1 (100) | 1 (100) |
| Echinocandin (antifungal) | 5 | 2 (40) | 0 (0) | 0 (0) | 1 (20) | 0 (0) | 1 (20) | global response (1), endoscopic response (1) | 5 (100) | 3 (60) |
| Glycopeptide | 12 | 7 (58) | 2 (17) | 1 (8) | 3 (25) | 0 (0) | 3 (25) | recurrence of MRSA bacteraemia within 60 days of discontinuation of therapy (1), length of stay (1), infection-related length of stay (1), alteration of therapy from vancomycin (1), recurrent MRSA bacteraemia within 90 days (1), hospital readmission within 30 days (1), resolving bacteraemia (<3 days of bacteraemia with all subsequent blood cultures documented to be negative after the initial positive blood culture) versus persistent bacteraemia (bacteraemia for ≥7 days while receiving appropriate antibiotic therapy) (1) | 6 (55) | 3 (27) |
| Ketolide | 4 | 0 (0) | 4 (100) | 0 (0) | 1 (25) | 0 (0) | 0 (0) | none | 1 (25) | 0 (0) |
| Macrolide | 1 | 0 (0) | 1 (100) | 0 (0) | 1 (100) | 0 (0) | 0 (0) | none | 1 (100) | 0 (0) |
| Oxazolidinone | 3 | 0 (0) | 2 (67) | 1 (33) | 3 (100) | 0 (0) | 0 (0) | none | 1 (33) | 1 (33) |
| Polyene (antifungal) | 1 | 0 (0) | 0 (0) | 0 (0) | 1 (100) | 0 (0) | 0 (0) | none | 0 (0) | 0 (0) |
| Quinolone | 21 | 0 (0) | 16 (76) | 5 (24) | 13 (62) | 1 (5) | 0 (0) | time to 70% decrease in sputum volume from peak (1), time to 25% decrease in the percentage of neutrophils in sputum from peak (1), time to 60% decrease in coughs per day from peak (1), time to equilibration of sinus aspirate neutrophil elastase and myeloperoxidase concentration with that of plasma, and time to postnasal drip resolution (1), time to clinical resolution of individual signs and symptoms of maxillary sinusitis (sinus pain, dental pain, sinus tenderness, purulent nasal discharge, headache, face pressure, nasal congestion, postnasal drip, sore throat, cough) (1) | 11 (61) | 5 (27) |
| Tetracycline | 7 | 0 (0) | 5 (71) | 0 (0) | 6 (86) | 0 (0) | 0 (0) | time to defervescence (fever resolution) (1), response [if the clinical signs and symptoms had regressed along with a >2-fold decrease in antibody titre (IgG and/or IgA) to phase I antigen at the completion of a year-long course of treatment] versus patients in whom the regression of clinical signs and symptoms was not associated with a fall in antibody titre to phase I antigen (1) | 7 (100) | 0 (0) |
| Triazole (antifungal) | 3 | 0 (0) | 0 (0) | 0 (0) | 1 (33) | 0 (0) | 1 (33) | global response (1), change in oropharyngeal candidiasis score (1) | 3 (100) | 3 (100) |
| β-Lactam | 20 | 2 (10) | 8 (40) | 3 (15) | 10 (50) | 0 (0) | 2 (10) | SOFA score > 3 at Day 7 (1), duration of mechanical ventilation (1), CRP normalization (1), number of admission days (1), time to defervescence (1), Brasfield score (1), pulmonary function score (1), clinical score (1), general score (1) | 14 (78) | 10 (56) |
| Total | 97 | 13 (13) | 41 (42) | 10 (10) | 48 (49) | 1 (1) | 11 (11) | 64 (70) | 33 (36) |
Clinical PK–PD studies of glycopeptides were most likely to assess the relationship of a PK–PD index with undesirable outcomes, such as treatment failure or mortality.
In 12 studies, at least one outcome was time to some event, such as time to clinical success or time to bacterial eradication. Of the 91 studies that assessed non-time-to-event outcomes, 64 studies (70%) reported clearly the timing of the outcome assessment. Of the studies that assessed outcomes at fixed timepoints, just over one-third (33 studies) of studies reported assessing at least one outcome at the end of therapy. Other outcome assessment timing included during therapy, at test-of-cure (at various timepoints) and at the end of the study. Some outcomes had timing as part of the outcome, for example 30 day mortality, or recurrence within 60 days of discontinuation. Study-level data are presented in Table S3.
Statistical analyses
The statistical approaches used to link PK–PD index with outcome are presented in Table 5, with study-level data in Table S4. Only three studies (from two publications) reported performing a sample-size calculation,10,53 although in only one of these publications (two studies)10 was the calculation based on estimating the association of PK–PD index and outcome (in the other it was based on the estimated association between MIC and treatment outcome).53 In addition, in two studies, sample size was a consideration in whether to combine data across cohorts separated by pathogen, though specific details were not reported.20,41
Statistical analyses performed in clinical PK–PD studies, by antimicrobial class
| Antimicrobial class | No. of studies | Sample-size calculation performed, no. of studies (%) | Analysis of 2 × 2 tables, no. of studies | Comparison of means, no. of studies | Correlation, no. of studies | ROC curve, no. of studies | Recursive partitioning, no. of studies | Type of analysis (no. of studies) | Standard and/or non- linear (no. of studies) | Adjusted and/or unadjusted (no. of studies) | No statistical analyses, no. of studies |
|---|---|---|---|---|---|---|---|---|---|---|---|
| Aminoglycoside | 16 | 1 (6) | 3 | 4 | 5 | 1 | 4 | logistic regression (9), time-to-event analysis (1), Hill equation/Emax model (1), repeated-measures mixed effects (1) | standard (10), non-linear (1) | unadjusted (7), adjusted (7) | 1 |
| Cyclic lipopeptide | 3 | 0 (0) | 1 | 0 | 0 | 0 | 0 | logistic regression (1) | standard (1) | adjusted (1) | 1 |
| Cyclic peptide/ polymyxin | 1 | 0 (0) | 0 | 0 | 1 | 0 | 0 | 0 | |||
| Echinocandin (antifungal) | 5 | 0 (0) | 0 | 0 | 0 | 0 | 0 | logistic regression (5) | standard (5) | unadjusted (2), adjusted (4) | 0 |
| Glycopeptide | 12 | 1 (8) | 7 | 8 | 0 | 0 | 7 | logistic regression (9), Poisson regression (1), time-to-event analysis (1) | standard (11) | unadjusted (2), adjusted (11) | 0 |
| Ketolide | 4 | 0 (0) | 0 | 0 | 0 | 0 | 4 | logistic regression (4) | standard (4) | unadjusted (4), adjusted (1) | 0 |
| Macrolide | 1 | 0 (0) | 0 | 0 | 0 | 0 | 0 | logistic regression (1) | standard (1) | adjusted (1) | 0 |
| Oxazolidinone | 3 | 0 (0) | 1 | 0 | 0 | 0 | 1 | logistic regression (1), time-to-event analysis (1), Hill equation/Emax model (1) | standard (1), non-linear (1) | adjusted (1) | 1 |
| Polyene (antifungal) | 1 | 0 (0) | 0 | 1 | 0 | 0 | 0 | ||||
| Quinolone | 21 | 0 (0) | 2 | 3 | 1 | 1 | 6 | logistic regression (9), time-to-event analysis (4), Hill equation/Emax model (3) | standard (11), non-linear (3) | unadjusted (12), adjusted (8) | 6 |
| Tetracycline | 7 | 0 (0) | 4 | 1 | 0 | 2 | 5 | logistic regression (6), time-to-event analysis (1) | standard (6) | unadjusted (6), adjusted (5) | 0 |
| Triazole (antifungal) | 3 | 0 (0) | 0 | 0 | 0 | 0 | 0 | logistic regression (2), Hill equation/Emax model (1) | standard (2), non-linear (2) | unadjusted (3), adjusted (2) | 0 |
| β-lactam | 20 | 1 (5) | 4 | 3 | 4 | 1 | 4 | logistic regression (4), linear regression (1), time-to-event analysis (1) | standard (6) | unadjusted (5), adjusted (1) | 9 |
| Total | 97 | 3 (3) | 22 (23%) | 20 (21%) | 11 (11%) | 5 (5%) | 31 (32%) | 18 (19%) |
Sixty-one studies (63%) performed some form of regression, time-to-event analysis or used the Hill/Emax equation to look at the association between PK–PD index and outcome. The most common form of analysis was logistic regression, performed in 51 studies. We categorized analyses according to whether linear or non-linear relationships were assumed and on whether the models were adjusted for additional variables. Most of the analyses were based on linear models (n = 58; we considered models in which one of the variables was log-transformed to be linear), with a non-linear model being assumed in only seven studies.
Linear models may not adequately characterize the relationship between the PK–PD index and the outcome. For example, Rayner et al.28 examined a variety of linear and non-linear regression models and found that Emax-type functions (modified Hill equations) best described the relationship between AUC/MIC and the probability of microbiological eradication and clinical cure at particular sites of infection. Step functions, in contrast, better described the association between %T>MIC and probability of microbiological eradication and clinical cure at particular sites of infection. In contrast, one study explored the possibility of non-linearity using splines and quadratic functions, but found that the relationship between the average concentration/MIC ratio versus response was best described using a linear term.25 Several other studies explored the relationship between PK–PD index and outcome using a number of different types of analysis.17,19 One of the papers we included focused on whether frequentist or Bayesian logistic regression may impact on the magnitude of the treatment effect.22
Many factors may influence the outcome of an infection. For example, general host factors (such as inflammatory response, antibody response, phagocyte function, underlying disease); site-of-infection factors (such as abscess drainage, sequestrum formation, presence of a foreign body such as an intravascular catheter or a prosthetic cardiac value); and pathogen factors (including toxin production or other virulence factors, evasion of the host inflammatory response or of antibiotic by entry into a protected site, e.g. an intracellular location). However, fewer than half of the studies (42 studies) performed or planned a multivariable analysis. The covariates included varied among studies. Thirty-nine studies examined demographic factors such as age or sex as potential covariates. Thirty-four studies examined clinical and physiological patient characteristics such as underlying disease and comorbidities. Thirty studies examined potential covariates related to infection, such as infecting organism and site/type of infection. Twenty-seven studies examined covariates relating to anti-infection treatment, such as receipt of concurrent antibiotics and surgery/removal of the infection focus.
Of the 73 studies in which analyses were not performed on a per-pathogen basis, 11 studies examined the infecting organism as a potential covariate (15%). Of the 33 studies where at least some proportion of the population received concurrent antimicrobials, 11 studies considered this as a potential covariate (33%). It was unclear in how many studies surgery was performed, but only four studies considered surgery, probability of the primary surgical or radiological procedure being successful in controlling the source of infection, or removal of eradicable focus as a potential covariate.
Eighteen studies did not report planning or performing any form of statistical analysis to examine the association between PK–PD index and outcome.8,34,35,42,43,45,49–51,54–62 In these studies there was either some form of descriptive analysis, for example in one study the AUC/MIC values of strains that were eradicated and strains that were not eradicated were described51 and/or PK–PD indices and outcomes were tabulated (often per patient or per pathogen).
Study results
Study results are presented in Table S5. Of the studies that performed some sort of statistical analysis, 56 studies (71%) reported a statistically significant relationship between a PK–PD index (either analysed as a continuous variable or categorized) and at least one of the outcomes investigated.
Over half the studies (n = 51, 52%) looked at target values of the PK–PD indices that might be used to link to clinical outcome. Target values in each study are reported in Table S5. In 20 studies (21%) a pre-specified target was examined, in 34 studies (35%) a de novo target was identified and 3 studies investigated both. The two most common techniques to identify de novo targets were variations on recursive partitioning and logistic regression. Twenty-six studies used a form of recursive partitioning. The most common method was classification and regression tree (CART) analysis, which derives optimal ‘splits’ of the continuous exposure variables in an iterative process. The split point determined for the PK–PD index is interpreted as a ‘target’ or ‘breakpoint’. When logistic regression was implemented, it was used to identify the PK–PD value that corresponded to 80% or 90% or 95% probability of cure (four studies). Further techniques for identifying de novo targets included identifying the AUC above the dynamic response concentration that achieved eradication in 4 days or less, based on the cohort of patients observed,8 visual inspection63 and receiver operating characteristic (ROC) curve analysis.64 In three studies the method used to identify targets was unclear or not reported.18,42,65 Two studies identified targets using two different techniques (CART and logistic regression).12,66
Many of the studies identified multiple targets by identifying targets for multiple PK–PD indices for multiple outcomes. In some cases, multiple targets were identified for the same PK–PD index for the same outcome, resulting in the population being divided into three or more. Some studies reported infection site-specific or organism-specific targets.
Only a few studies reported uncertainty around the PK–PD targets identified, for example using 95% CI around the identified target2 or 95% CI around the probability of being above or below the target.67 Several studies analysing time-to-event outcomes reported measures of variability.28,40,68
Among studies reporting probabilities of a successful outcome above or below a target (or information sufficient to calculate this probability), the probability of a successful outcome among individuals with PK–PD index values exceeding the identified target varied. The lowest probability above a recursive partitioning-identified target was 39% and the highest was 100%. The probability of a successful outcome above the target was greater than 90% for 36 of the targets identified by recursive partitioning. In some studies, the probability of the outcome was lower above the CART-identified target than below it. For example, Lodise et al.69 found a probability of a favourable outcome (not failure, where failure was defined as 30 day mortality, microbiological failure or recurrence of infection) to be 57% above the target of Cmin0–24h/MIC (determined by broth microdilution) ≥14.9 and 71% below the target. This may have arisen due to increasing administration of antimicrobial or change in PK parameters in the sickest patients with the poorest prognosis. These recursive partitioning-based probabilities among individuals above and below an identified target are averages across values of the PK–PD index. In contrast, logistic regression estimates the probability of an outcome for each specific value of the index. For instance, Kashuba et al.12 used both CART and logistic regression, finding a target of Cmax/MIC = 4.7 using CART, with a success rate of 89% above this threshold. In logistic regression, a Cmax/MIC of 4.7 corresponded to a 68% probability of response while a Cmax/MIC of 23.6 (the highest seen) corresponded to a 99% probability of response; the value of 89% is the average probability across this range.
Graphical representations of the relationship between PK–PD index and probability of outcome facilitate judgements by clinicians and policymakers about reasonable targets. Several studies provided graphs. For example, several studies plotted the probability of success versus a PK–PD index based on the results of logistic regression, with CIs around the regression line.5,23,25,27 Twenty-two studies reported relative risks or ORs for outcome, either above and below a pre-specified target or with increasing levels of PK–PD index.
As mentioned above, in 20 studies (21%) a pre-specified target was examined, for example by seeking to confirm targets identified in another cohort8 or another outcome.70 Independent confirmation of targets is important if targets are going to be used to guide therapy.
Discussion
In a systematic review of clinical PK–PD studies of antimicrobials performed between 1980 and 2015 we found wide variability in conduct and reporting. Many of the concerns that have been voiced about these studies, such as small size (<100 patients), not limiting analyses to populations with similar pathogens and sites of infection, not measuring free-drug concentration and not adjusting analyses for the effect of surgery, appear to be justified. For many of the items we tried to examine, there were studies that did not report the item or provided descriptions that were unclear.
We believe this is the first systematic review of the methods employed in clinical PK–PD studies. We searched comprehensively for studies reported over a period of over 35 years and examined many features of their conduct and reporting. Our review has limitations, however. We excluded studies that did not measure the concentration of an antimicrobial in a biological material for all patients in the analysis, or that did not use this concentration in the calculation of the PK–PD index, and therefore we have only reviewed a subset of the clinical PK–PD literature. We did not extract detailed information on the PK methods used as we did not aim to assess the PK aspects of the studies and we have assumed that these were performed appropriately. We did not extract detailed information on the definitions of outcomes used in all the papers. Our search did not contain terms for disease-specific outcomes (for example, improvement in forced expiratory volume in 1 s). We therefore may have missed studies with these outcomes if they were not indexed under the ‘Treatment outcome’ MeSH heading. Finally, due to resource constraints we excluded foreign-language studies and sifting of titles and abstracts and extracting the data was performed by one reviewer. In addition, limiting the review to published, peer-reviewed studies introduces the possibility of bias due to non-reporting, where studies with undesirable results are less likely to be written up by researchers and/or published.
Future studies of associations between a PK–PD index and a clinical or microbial response may struggle to identify informative relationships because optimum dosing regimens can often be derived using pre-clinical data. However, when they are undertaken, they should be designed and reported carefully so that findings can be attributed to genuine relationships (or lack of a relationship) rather than to poor conduct and so that the pre-defined PK–PD indices can be validated through high clinical success rates. In Table 6 we offer some recommendations for future clinical PK–PD studies, informed by our deliberations over what we observed while undertaking the review. We also identified a need for improved reporting of methodology. Studies might consider reporting all the items that we aimed to extract. In addition, we suggest that studies should compare features and outcomes of patients included in the PK–PD analysis (because there are data for PK parameters and MICs for pathogens) and other eligible patients (same infection, same pathogen, same antibiotic but for some reason do not have PK data or MICs of pathogens) to ensure that there are no material differences; and that PK–PD studies should plot PK–PD index versus probability of outcome or amount of improvement so that the exposure–response relationship is clear. Such plots, possibly with exposures divided into quantiles (an option when regression methods are used) can also allow individuals to determine their own targets.
Suggested guidelines for conducting clinical PK–PD studies
| Suggested guidelines for conducting studies |
|---|
| 1) Consider sample-size calculations to determine whether an exposure–response relationship has a reasonable likelihood of being identified. Conducting analyses on too few patients is unlikely to yield meaningful results. |
| 2) Consider reporting CIs or credible intervals measuring the level of uncertainty in the results to avoid overinterpretation when PK–PD index–response relationships are not identified. |
| 3) Ensure the population is as homogeneous as possible with respect to infection and infecting pathogen, or control for these factors. This will facilitate the detection of PK–PD index–response relationships. Similarly, it may be desirable to standardize concurrent treatments. |
| 4) Derive the PK parameters of the antimicrobial in a robust manner from sufficient samples (the sampling framework may be derived using Stochastic Optimal Design or similar methodology) and using an appropriate population PK model. If free concentrations of antimicrobials are important, then these should be measured rather than adjusting for protein binding using a fixed rate to allow for the fact that protein binding may vary. For some infections, concentration at the site of infection may be important and this should be measured if possible. |
| 5) Perform antimicrobial susceptibility testing of infecting pathogens before the start of therapy and determine results using standardized methodology. If possible, it may be preferable to store strains to test concurrently in one laboratory. |
| 6) Consider having standardized outcomes and timing of outcomes. The outcomes should be relevant to the patient. PK–PD index–response relationships may be more likely if continuous rather than dichotomous outcomes are used. |
| 7) Follow a pre-specified analysis plan. The most appropriate way of statistically analysing the relationship between PK–PD indices and outcomes needs to be further investigated. Explicit modelling of the PK–PD index, for example using fractional polynomials, 88 may be preferable to recursive partitioning if the sample size is sufficient. It may be advisable to produce a standardized list of covariates that should be assessed to see if they are associated with outcome, for example severity of illness and presence of comorbidities. This list may vary by indication. The investigation of the influence of covariates on the PK–PD relationship for efficacy using multivariable analyses and through the findings of interactions with the PK–PD index may help further the understanding of which subsets of patients are at increased risk of suboptimal drug exposure. |
| 8) The evaluation of PK–PD indices achieved among patients relative to non-clinical PK–PD targets for efficacy is useful. Such information provides dose-selection support, especially if PK–PD indices achieved are on the upper plateau of the non-clinical PK–PD relationship for efficacy. |
The results of clinical PK–PD–response studies should be considered in conjunction with results from pre-clinical PK–PD studies. Obtaining a response rate that correlates with the expectation from these studies is powerful evidence.
Acknowledgements
Preliminary findings from this systematic review have been incorporated into a white paper by the Combatting Bacterial Resistance in Europe (COMBACTE) STAT-Net consortium.71
Funding
This research was supported by the Innovative Medicines Initiative Joint Undertaking under grant agreement no. 115523 [Combatting Bacterial Resistance in Europe projects (COMBACTE)], resources of which are composed of financial contribution from the European Union’s 7th Framework Programme (FP7/2007 ± 2013) and the European Federation of Pharmaceutical Industries and Associations (EFPIA) companies’ in-kind contribution.
The funders had no role in data collection and analysis, decision to publish, or preparation of this manuscript.
Transparency declarations
P.G.A. and S.M.B. are President and Executive Vice President, respectively, of the Institute for Clinical Pharmacodynamics (ICPD). The ICPD has received funding from various commercial entities for research and work performed on their behalf, including A&G Pharmaceutical, Inc., Achaogen Inc., Agility Clinical, AiCuris GmbH, Amplyx, Arixa Pharmaceuticals, Arsanis Inc., Basilea Pharmaceutica, Boston Pharmaceuticals, B. Braun Medical Inc., Cellceutix Corporation, Cempra Pharmaceuticals, Cidara Therapeutics Inc., Contrafect Corporation, Corcept Therapeutics, Inc., Debiopharm International SA, Discuva Limited, Durata Therapeutics, Emerald Lake Technologies LLC, Enhanced Pharmacodynamics, Entasis Therapeutics, Genentech, Geom Therapeutics, Inc., GlaxoSmithKline, Hoffmann-La Roche, Horizon, Indalo Therapeutics, Insmed Inc., Iterum Therapeutics Limited, Kalyra Pharmaceuticals, KBP BioSciences Co., Kedrion Biopharma Inc., Matinas, The Medicines Company, Meiji Seika Pharma Co., Ltd, Melinta Therapeutics, Menarini Ricerche S.p.A, Merck Sharpe & Dohme, Nabriva Therapeutics, Naeja RGM Pharmaceuticals Inc., Nexcida Therapeutics, Inc., Northern Antibiotics, Nosopharm SAS, Novartis International, NuCana Biomed, Paratek Pharmaceuticals, Pernix Therapeutics, Polyphor Ltd, Profil Institute for Clinical Research, Inc., Prothena Corporation, PTC Therapeutics, Raptor Pharmaceuticals Corp., Rempex Pharmaceuticals, Inc., Roche TCRC, ScPharmaceuticals, Scynexis, Shionogi, Inc., Sofinnova Ventures Inc., Spero Therapeutics, Synteract, Targanta Therapeutics Corporation, TauRX Ophan, Theravance Biopharma Pharmaceutica, Tetraphase Pharmaceuticals, Toyama, Turing Pharmaceuticals, University of Florida, University of Southern California, VenatoRx, Vical, Wockhardt Ltd, Zavante Therapeutics, Zogenix, Inc., 3-V Biosciences. In addition, P.G.A. and S.M.B. have a patent for Method for Improving Drug Treatments in Mammals (Patent No. US 9,345,717 B2). W.W.H. has received grants from Spero Therapeutics, F2G, AiCuris, Astellas Pharma, Matinas Biosciences, Antabio, Amplyx, Allecra, Bugworks, NAEJA-RGM, AMR Centre and Pfizer; and personal fees from Spero Therapeutics, F2G, Astellas Pharma, Amplyx, NAEJA-RGM and AMR Centre. J.W.M. has received grants from Aicuris, Gilead, Wockhardt, VenatorX, Helperby, Eumedica, Roche, Polyphor, Nordic Pharma and Cidara. A.P.M. received grants from the National Institute for Health Research, Achaogen Inc, AiCuris GmbH, F2G, Infectopharm GmbH, Merck Inc, Paratek, VenatoRx, Wockhardt Ltd and via IMI funding AiCuris, AstraZeneca, The Medicines Company, Evotech and Nosopharm during the conduct of this study. All other authors: none to declare.
Author contributions
A.M. designed and performed the literature searches, selected the studies, extracted the data and wrote the first draft of the manuscript. P.G.A., S.M.B., G.L.D., W.W.H. and J.W.M. examined the list of included studies and critically commented on the manuscript. J.P.T.H. gave methodological guidance and edited the manuscript. A.P.M. conceived the study and edited the manuscript. All authors have read and approved the final manuscript.
Supplementary data
Tables S1 to S5 and further details of the search strategy, data extracted, studies excluded and PK–PD indices are available as Supplementary data at JAC Online.
