


Abstract
To explore the pharmacokinetics (PK) of oral and intravenous (iv) lefamulin after single and multiple doses, and the effect of food on bioavailability.
Lefamulin PK was examined in four studies. In Study 1, PK was assessed in patients with acute bacterial skin and skin structure infections who received repeated iv lefamulin q12h (150 mg). In Study 2, a four-period crossover study, healthy subjects received a single dose of oral lefamulin [immediate-release (IR) tablet, 1 × 600 mg] in a fasted and fed state, oral lefamulin (capsule, 3 × 200 mg) in a fasted state, and iv lefamulin in a fasted state. In Study 3, a three-period crossover study, healthy males received a single oral lefamulin dose (IR) in the following states: fasted, fasted followed by a high-calorie meal 1 h post-dose, and fed. Study 4 had two parts; in part A, healthy males received a single lefamulin dose (IR) in a fasted and fed state; in part B, subjects received repeated doses of lefamulin (IR, q12h) or placebo. Adverse events (AEs) were recorded in each study.
Single and repeated dosing of iv and oral lefamulin resulted in comparable exposure. Intravenous and oral lefamulin (given fasted or with a meal 1 h post-dose) resulted in bioequivalence. Bioequivalence was not established between oral lefamulin in the fed state and iv or oral administration in the fasted state. All AEs were mild or moderate in severity, no serious AEs were reported, and no participant discontinued because of an AE.
The PK of lefamulin supports successful switch from iv to oral therapy; lefamulin was generally well tolerated.
Introduction
Lefamulin is a semisynthetic, first-in-class pleuromutilin antibiotic active against a range of pathogens commonly causing community-acquired bacterial pneumonia (CABP), as well as bacteria associated with acute bacterial skin and skin structure infections (ABSSSIs) and sexually transmitted infections, including those caused by multiresistant strains.1–5 Pleuromutilin antibiotics inhibit bacterial protein synthesis by binding to the A- and P-sites of the peptidyl transferase centre (PTC) in the large ribosomal subunit of the bacterial ribosome.6–9 The unique binding site of the pleuromutilins in the highly conserved core of the ribosomal PTC confers a low propensity for the development of bacterial resistance. In addition, this unique mechanism results in a lack of cross-resistance with other antibacterial classes such as macrolides, ketolides, lincosamides, fluoroquinolones and tetracyclines.
Lefamulin is the first pleuromutilin for intravenous (iv) or oral administration, enabling clinicians to treat patients requiring hospitalization or who are in the ambulatory care setting. In addition, the option to switch from iv to oral therapy may result in decreases in both length of hospital stay and healthcare costs.10 In a Phase 1 study, pharmacokinetic (PK) analyses of iv administration of a single lefamulin dose demonstrated rapid and predictable drug penetration to skeletal muscle tissue, subcutaneous adipose tissue (i.e. soft tissues) and lung epithelial lining fluid (ELF), with relatively low variability and exposure similar to that observed in plasma.11 In a Phase 2 study, iv lefamulin was shown to be as effective as vancomycin in treating ABSSSIs caused by Gram-positive pathogens.4 In addition, two recent Phase 3 studies demonstrated that lefamulin was both well tolerated and non-inferior to moxifloxacin in the treatment of adults with CABP.12,13 Here, we describe four PK studies that examined lefamulin exposure in humans following oral and iv administration, specifically the bioequivalence between iv and oral administration, exposure following single or multiple iv or oral doses, and the effect of food on bioavailability following oral administration.
Methods
Study designs and participants
Study 1: PK after repeated iv administration to patients
This Phase 2, multicentre, double-blind, parallel-group study (NCT01119105) evaluated the efficacy and safety of iv lefamulin (100 or 150 mg q12h compared with 1 g iv vancomycin q12h) in patients with ABSSSIs.4 Details of the study design and patient population have been previously published.4
Here we report PK parameters for patients who received repeat dosing of 150 mg iv lefamulin q12h. Blood samples were collected at the first dose on day 1 (at 2, 3–5 and 8–12 h after the start of infusion), on day 5 and the final day of treatment (pre-dose and 2, 4–6 and 10–12 h after the start of infusion) for analysis of plasma concentrations of lefamulin.
Study 2: PK of a single dose, iv compared with oral
This Phase 1, single-centre, single-cohort, open-label, randomized, four-period crossover study in healthy subjects (NCT02557789) evaluated the bioavailability, PK, safety and tolerability of a 600 mg immediate-release (IR) tablet of lefamulin administered in the fed or fasted state compared with iv and capsule formulations. Healthy subjects aged 18–55 years with a BMI of 19–32 kg/m2 received a single lefamulin dose at four treatment sessions separated by ≥4 days in a randomized order: (i) lefamulin (IR tablet, 1 × 600 mg) orally in a fasted state; (ii) lefamulin (capsule formulation, 3 × 200 mg) orally in a fasted state; (iii) lefamulin (IR tablet, 1 × 600 mg) orally in a fed state; and (iv) lefamulin (1 × 150 mg) by iv infusion for 1 h in a fasted state. For treatments administered in a fasted state, subjects fasted overnight (≥8 h). Subjects who received lefamulin in the fed state consumed a high-fat, high-calorie breakfast 1 h before dosing as defined by FDA guidance. Lunch was served 4 h post-dose for all treatments.
Plasma samples were collected from an indwelling cannula or by venepuncture pre-dose and at the following post-dose timepoints: 10 min to 1 h and 1.25–2.5, 3, 4, 5, 8, 12, 24 and 36 h.
Study 3: PK of a single dose, oral with food
This Phase 1, single-centre, single-cohort, open-label, three-period crossover study (EudraCT number 2012-004404-35) in healthy male subjects assessed the effect of food on the safety, tolerability and PK of a 600 mg IR tablet formulation of lefamulin. Subjects aged 18–55 years with a BMI of 19–28 kg/m2 received a single lefamulin dose in the following three treatments in a randomized order: (i) lefamulin (IR tablet, 1 × 600 mg) orally in a fasted state; (ii) lefamulin (IR tablet, 1 × 600 mg) orally in a fasted state followed by a high-calorie meal 1 h after dosing; and (iii) lefamulin (IR, 1 × 600 mg) orally in a fed state (subjects consumed a high-calorie meal 1 h before dosing, as described in Study 2). Treatments were separated by ≥4 days. For each treatment, venous blood samples were collected pre-dose and post-dose at the following timepoints: 10 min to 1 h and 2, 2.5, 3, 4, 5, 6, 8, 12, 24 and 36 h.
Study 4: PK of repeated oral administration
This Phase 1, two-part study evaluated the safety, tolerability and PK of single and repeated doses of IR lefamulin tablets in healthy male subjects aged 18–55 years with a BMI of 19–28 kg/m2 (EudraCT 2012000025-50). Part A was an open-label crossover study to evaluate the effect of food [fed (i.e. high-fat, high-calorie breakfast) compared with fasted] on oral lefamulin; part B was a randomized, double-bind, placebo-controlled study to evaluate the PK of repeated oral administration. In part A, subjects were randomized to receive a single lefamulin dose (IR, 1 × 600 mg) in either a fasted or fed state; treatments were separated by ≥4 days. In part B, the same subjects enrolled in part A were randomized (2:1) to receive repeat doses of oral lefamulin (IR tablet q12h, 1 × 600 mg) or placebo (tablet q12h) for 6 days with a single dose on day 7. Parts A and B were separated by 4 days.
In part A, blood samples were taken pre-dose and 10 min to 1 h and 2, 2.5, 3, 4, 5, 6, 8, 12, 24 and 36 h post-dose. In part B, blood samples were taken pre-dose (morning) and post-dose (evening) on days 1–6, with a full PK profile completed on day 7 (same sample collection times as in part A).
Ethics
All studies were conducted in accordance with the principles of the Declaration of Helsinki and the International Council for Harmonisation guidelines for Good Clinical Practice, and local regulatory requirements. All participants provided written informed consent at screening.
Pharmacokinetic analysis
Bioanalysis
Plasma lefamulin concentrations from blood samples were determined using validated LC–MS/MS assays (lower limit of quantification, 1.00 ng/mL; data on file). The unbound concentration of lefamulin in the plasma was estimated as 13% of the total plasma concentration based on non-linear plasma protein binding of 12%–27% of lefamulin (data on file).
Calculations and statistical methods
For Study 1, a simple three-compartment population PK model incorporating saturable protein binding provided a robust fit to the plasma data. PK exposure and secondary PK parameter estimates were calculated for each patient by simulating a concentration–time profile using the final population PK model. Secondary PK parameters were obtained by applying non-compartmental analysis methods to the simulated profiles.14 For all other studies, PK parameters Cmax, Tmax, AUC0–12, AUC0–24 and AUC0–∞ were calculated using SAS® Version 9.1.3 or higher (SAS Institute, Cary, NC, USA). Summary statistics were calculated for each treatment at each timepoint to assess relative and absolute bioavailability. A natural logarithmic transformation was applied to the PK parameters, and an analysis of variance was performed using the general linear models procedure (PROC GLM) or by using mixed-effect modelling techniques with sequence, period and treatment fitted as fixed effects and subject fitted as a random effect. Adjusted geometric mean ratios (GMRs) and 90% CI for each comparison were calculated. Bioequivalence was concluded if the 90% CI was within the acceptance range 0.80–1.25 (FDA guideline).15
Evaluations of adverse events
Participants were monitored for adverse events (AEs) by patient reporting at each study visit and throughout the studies. AEs were evaluated by the study investigator, at which time their relationship to the study treatment was determined. The investigator rated the severity of AEs as follows: mild AEs were easily tolerated and did not interfere with daily activity, moderate AEs interfered with daily activity but the subject could still function and severe AEs were incapacitating and required medical intervention.
Results
Participants
Participant characteristics and demographics for each study are summarized in Table 1. Pharmacokinetic analyses from Study 1 included 71 patients with ABSSSIs who received 150 mg iv lefamulin from the total population of 207 patients.4 The majority of patients were male and white, mean (SD) age was 42.2 (13.4) years and BMI was 32.5 (8.0) kg/m2. For one site, nearly all plasma samples gave uninterpretable results and were excluded from PK analyses. Studies 2, 3 and 4 included 20, 13 and 12 subjects, respectively. Subject demographics were generally similar among the studies, with the exception that Studies 3 and 4 included only male subjects (Table 1).
Participant demographics by study
| Characteristics | Study 1 (n = 71)a | Study 2 (n = 20)b | Study 3 (n = 13) | Study 4 (n = 12)c |
|---|---|---|---|---|
| Sex, n (%) | ||||
| male | 47 (66.2) | 12 (60.0) | 13 (100.0) | 12 (100.0) |
| female | 24 (33.8) | 8 (40.0) | 0 | 0 |
| Age, years, mean (SD) | 42.2 (13.4) | 33.8 (11.8) | 40.6 (22.0–54.0)d | 40.0 (10.6) |
| Weight, kg, mean (SD) | 96.7 (24.5) | 75.7 (12.5) | 77.3 (55.0–92.5)d | 75.8 (8.5) |
| BMI, kg/m2, mean (SD) | 32.5 (8.0) | 25.3 (3.3) | 24.0 (20.1–27.9)d | 23.7 (2.5) |
| Race, n (%) | ||||
| white | 51 (71.8) | 18 (90.0) | 12 (92.3) | 12 (100.0) |
| black | 13 (18.3) | 0 | 1 (7.7) | 0 |
| Asian | 1 (1.4) | 1 (5.0) | 0 | 0 |
| other | 6 (8.5) | 1 (5.0) | 0 | 0 |
Only patients who received iv 150 mg lefamulin q12h.
19 of the 20 subjects in Study 2 received oral lefamulin in the fed state.
Only 7 of the 12 subjects in Study 4 received oral lefamulin q12h for 6.5 days.
Only range given.
PK after repeated iv administration
Study 1
Mean plasma concentrations at the end of the infusion (2 h after the start of the infusion) on day 1 (following a single dose) and day 5 (following repeat dosing) were similar (1.57 and 1.65 mg/L, respectively), as were the mean values for Cmax (1.90 and 2.06 mg/L), AUC0–12 (6.59 and 8.27 mg·h/L) and AUC0–24 (14.1 and 16.5 mg·h/L) (Table 2).
Pharmacokinetic parameters for lefamulin dosing (150 mg q12h) at the end of iv infusion on day 1 (single dose) and day 5 (repeat dosing) (ITT population)
| Parameter | Mean (SD) | Median (minimum–maximum) |
|---|---|---|
| Cmax (mg/L) | ||
| day 1 | 1.90 (0.705) | 1.88 (0.633–4.38) |
| day 5 | 2.06 (0.737) | 2.01 (0.707–4.51) |
| AUC0–12 (mg·h/L) | ||
| day 1 | 6.59 (2.69) | 5.91 (2.00–16.9) |
| day 5 | 8.27 (3.11) | 7.61 (2.53–19.9) |
| AUC0–24 (mg·h/L) | ||
| day 1 | 14.1 (5.76) | 12.8 (4.29–35.1) |
| day 5 | 16.5 (6.21) | 15.2 (5.05–39.8) |
| λz (h−1) | 0.0663 (0.0362) | 0.0557 (0.0295–0.205) |
| t½ (h) | 13.2 (5.79) | 12.4 (3.38–23.5) |
| CLt (L/h) | 20.9 (8.92) | 19.7 (7.53–59.4) |
| Vss (L) | 82.9 (36.4) | 74.4 (31.6–223) |
λz, terminal elimination rate constant.
PK of a single dose, iv compared with oral
Study 2
Single doses of lefamulin administered iv (1 × 150 mg) and orally by tablet or capsule in a fasted state (1 × 600 mg IR tablet or 3 × 200 mg capsules) resulted in similar plasma drug concentrations (mean, mg·h/L: AUC0–12, 6.23, 6.35 and 6.55, respectively; AUC0–24, 7.32, 7.69 and 7.89; AUC0–∞, 8.02, 8.59 and 8.78; Table 3) and concentration–time profiles (Figure 1a). The iv and oral administrations were not bioequivalent for Cmax and Tmax, but similar exposure based on AUC was achieved between the iv infusion and oral IR tablet (fasted); the GMR for AUC0–∞ was 103.36% (90% CI 94.89%–112.58%; Table 3). Bioequivalence was also demonstrated between both oral lefamulin formulations (IR tablet, fasted compared with capsule, fasted); the GMR for AUC0–∞ was 97.40% (90% CI 90.59%–104.71%; Table 3). In both cases, the 90% CI was within the bioequivalence acceptance range of 80%–125% (Figure 2). Absorption was rapid following oral administration; median Tmax was 1.00, 1.76 and 0.88 h for iv (1 × 150 mg), IR tablet (1 × 600 mg) and capsule (3 × 200 mg), respectively.
PK parameters following a single dose of lefamulin
| Formulation (patients, n) | Administration | Tmax (h) | Cmax (mg/L) | AUC0–12 (mg·h/L) | AUC∞ (mg·h/L) | AUC∞ GMR, % (90% CI) |
|---|---|---|---|---|---|---|
| Study 2 | Compared with iv 150 mg | |||||
| 1 × 150 mg iv (20) | iv | 1.00 (0.17–1.02) | 2.40 (0.33) | 6.23 (0.87) | 8.02 (1.31) | – |
| 1 × 600 mg IR tablet (20) | oral, fasted | 1.76 (0.50–5.00) | 1.19 (0.27) | 6.35 (1.79) | 8.59 (2.81) | 103.36 (94.89–112.58) |
| 3 × 200 mg capsule (20) | oral, fasted | 0.88 (0.50–4.00) | 1.26 (0.33) | 6.55 (1.77) | 8.78 (2.82) | 97.40 (90.59–104.71)a |
| 1 × 600 mg IR tablet (19) | oral, fed | 5.00 (1.05–8.00) | 0.93 (0.24) | 4.58 (1.29) | 6.97 (2.31) | 84.31 (76.94–92.37) |
| Study 3 | Compared with oral 600 mg fasted | |||||
| 1 × 600 mg IR tablet (12) | oral, fasted | 1.00 (0.33–4.00) | 1.41 (0.36) | 6.42 (1.25) | 8.46 (1.87) | – |
| 1 × 600 mg IR tablet (13) | oral, fasted + meal | 0.75 (0.33–3.00) | 1.33 (0.50) | 5.72 (1.44) | 7.64 (2.18) | 91 (82–100) |
| 1 × 600 mg IR tablet (12) | oral, fed | 4.50 (2.00–6.00) | 0.91 (0.34) | 4.59 (1.43) | 6.47 (2.10) | 75 (68–82) |
Arithmetic means and SDs are presented except for Tmax [median (range)].
AUC0–∞ GMR (90% CI) for capsule formulation (3 × 200 mg, oral, fasted) is compared with IR tablet (1 × 600 mg, oral, fasted).
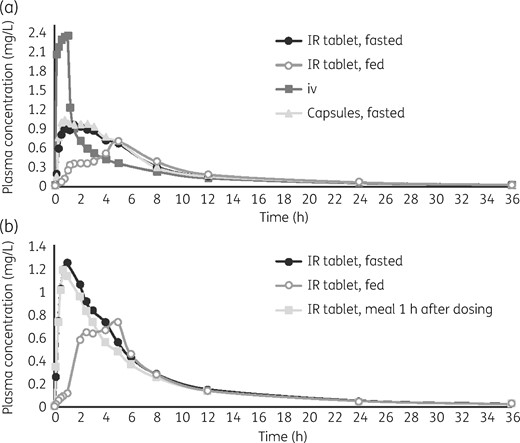
Mean concentration–time profiles of lefamulin after a single dose by administration route. (a) In Study 2, lefamulin was administered iv (150 mg infusion lasting 1 h), orally in the fasted state with either the IR tablet (1 × 600 mg) or capsule formulation (3 × 200 mg), or in the fed state with the IR tablet. (b) In Study 3, lefamulin was administered orally (IR tablet, 1 × 600 mg) in the fasted state, fed state or fasted state with a meal 1 h after dosing.
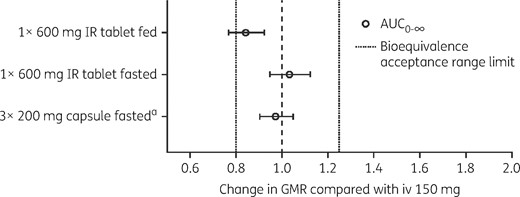
AUC0–∞, GMRs, expressed as fold difference, and 90% CIs from Study 2. Lefamulin was administered iv (150 mg infusion lasting 1 h), orally in the fasted state with either the IR tablet (1 × 600 mg) or capsule formulation (3 × 200 mg), or in the fed state with the IR tablet. aAUC0–∞ GMR (90% CI) for capsule formulation (3 × 200 mg, oral, fasted) is compared with IR tablet (1 × 600 mg, oral, fasted).
The effect of food on lefamulin absorption was examined by estimating the bioequivalence by comparing PK values following a single iv 150 mg dose with a single oral dose given in the fed state (IR tablet, 600 mg; administered 1 h after a large high-calorie meal). The GMR for the AUC0–∞ of iv (1 × 150 mg) versus oral administration in the fed state was 84.31% (90% CI 76.94%–92.37%; Table 3), which was outside the bioequivalence acceptance range (Figure 2). These results are consistent with reduced plasma concentrations (mean, mg·h/L: AUC0–12, 4.58; AUC0–24, 6.09; AUC0–∞, 6.97) and delayed Tmax (median Tmax, 5.00 h) observed in the plasma concentration–time profile following oral administration in the fed state (Figure 1a).
Assessment of absolute bioavailability of lefamulin in the fasted and fed state is shown in Table 4. The GMR for the AUC0–∞, AUC0–last, AUC0–12 and AUC0–24 of single-dose oral lefamulin (IR tablet, 600 mg) in the fasted state versus iv (1 × 150 mg) was ∼25%, and the upper and lower 90% CIs for the GMRs were within 3% of the GMR, which indicated low intrasubject variability. The GMR was ∼12% for the dose-corrected Cmax.
Absolute bioavailability of lefamulin in the fasted and fed state: pairwise treatment comparison (dose corrected; pharmacokinetic descriptive population)
| PK parameter, (mg·h/L or mg/L)/mg | Treatment pair (X/Y) | Treatment X | Treatment Y | Ratiob (%) | 90% CIc (%) | P valued | CVw (%) | ||
|---|---|---|---|---|---|---|---|---|---|
| n | adjusted GMa | n | adjusted GM | ||||||
| AUC0–∞/dose | A/C | 20 | 0.0136 | 20 | 0.0528 | 25.84 | 23.72–28.14 | <0.001 | 24.1 |
| D/C | 19 | 0.0111 | 20 | 0.0528 | 21.08 | 19.24–23.09 | <0.001 | ||
| AUC0–last/dose | A/C | 20 | 0.0131 | 20 | 0.0510 | 25.66 | 23.58–27.92 | <0.001 | 23.0 |
| D/C | 19 | 0.0106 | 20 | 0.0510 | 20.81 | 19.01–22.78 | <0.001 | ||
| AUC0–12/dose | A/C | 20 | 0.0102 | 20 | 0.0410 | 24.79 | 22.99–26.75 | <0.001 | 17.3 |
| D/C | 19 | 0.0074 | 20 | 0.0410 | 17.96 | 16.35–19.72 | <0.001 | ||
| AUC0–24/dose | A/C | 20 | 0.0123 | 20 | 0.0482 | 25.44 | 23.42–27.63 | <0.001 | 21.8 |
| D/C | 19 | 0.0098 | 20 | 0.0482 | 20.29 | 18.56–22.17 | <0.001 | ||
| Cmax/dose | A/C | 20 | 0.0019 | 20 | 0.0158 | 12.28 | 11.24–13.41 | <0.001 | 11.8 |
| D/C | 19 | 0.0015 | 20 | 0.0158 | 9.47 | 8.46–10.59 | <0.001 | ||
Treatment A, 600 mg lefamulin IR tablet, administered orally in the fasted state; Treatment C, 150 mg lefamulin in 250 mL citrate-buffered saline, administered as an iv infusion over 1 h; Treatment D, 600 mg lefamulin IR tablet, administered orally in the fed state (1 h after breakfast).
CVw, intra-subject variability; GM, geometric mean.
Adjusted geometric mean from model.
Ratio of adjusted geometric means for Treatment Y/Treatment X.
CI for ratio of adjusted geometric means.
P value for ratio of adjusted geometric means.
The GMR for the AUC0–∞, AUC0–last, AUC0–12 and AUC0–24 of single-dose oral lefamulin (IR tablet, 600 mg) in the fed state versus iv (1 × 150 mg) was ∼20%, and the upper and lower 90% CIs for the GMRs were within 3% of the GMR, which indicated low intrasubject variability. The GMR was ∼10% for the dose-corrected Cmax.
All AEs reported were mild and resolved by the end of the study. No subjects required concomitant medication for treatment of an AE, and none withdrew because of an AE. No subject experienced a severe or serious AE. Oral administration in the fasted state was associated with more gastrointestinal (GI) AEs than in the fed state or after iv administration [subjects reporting a GI-related AE, n (%): oral IR tablet fasted, 9 (45.0%); oral capsule fasted, 9 (45.0%); oral IR tablet fed, 1 (5.0%); iv, 0 (0%)]. The incidence of diarrhoea was slightly higher in the fasted state with the oral IR tablet [10.0% (n = 2)] versus the oral capsule fasted [5.0% (n = 1)] and the oral IR tablet fed [5.0% (n = 1)]; there were no reported incidents of diarrhoea with iv infusion.
PK of a single oral dose with food
Study 3
Lefamulin exposure with oral administration in a fasted state followed by a meal 1 h after dosing was similar to that when followed by a ≥4 h fast. The GMR of the AUC0–∞ demonstrated bioequivalence [91% (90% CI 82%–100%)], plasma drug concentrations were comparable (mean, mg·h/L: AUC0–12, 5.72 and 6.42, respectively; AUC0–24, 6.88 and 7.67; AUC0–∞, 7.64 and 8.46; Table 3), and the concentration–time profiles were similar (Figure 1b). Lefamulin absorption was rapid for both administrations [Tmax (h), median: 0.75 for fasted + meal; 1.00 for fasted].
Oral administration of lefamulin in fed and fasted states did not achieve bioequivalence; the GMR of the AUC0–∞ values was 75% (90% CI 68%–82%; Table 3). Oral administration of lefamulin in the fed state showed delayed drug absorption (median Tmax, 4.50 h) and reduced plasma concentrations (mean, mg·h/L: AUC0–12, 4.59; AUC0–24, 5.75; AUC0–∞, 6.47), consistent with results observed in Study 2.
All AEs were mild or moderate in severity, there were no serious AEs, and no subject discontinued because of an AE. The most common AEs were GI related, and the incidence was lower when lefamulin was administered in a fed state [subjects reporting a GI-related AE, n (%): oral IR tablet fasted, 2 (16.7%); oral IR tablet fasted + meal, 3 (23.1%); oral IR tablet fed, 1 (8.3%)]. There was no reported incidence of diarrhoea in the fasted state with the oral IR tablet or the oral IR tablet fed in contrast to the oral IR tablet fasted + meal, where 23.1% (n = 3) of subjects experienced diarrhoea.
PK of repeated oral administration
Study 4
Repeated oral dosing of lefamulin (1 × 600 mg IR tablet, fasted, q12h) resulted in higher AUC0–12 values on day 7 compared with a single oral dose (1 × 600 mg IR tablet, fasted) (mean, mg·h/L: 10.80 and 6.35, respectively; Figure 3). Steady-state Cmax on day 7 following repeated dosing was only slightly higher than the Cmax following a single dose (mean, mg/L: 1.85 and 1.46). Median Tmax was longer following multiple doses of lefamulin compared with a single dose (2.00 and 0.88 h; Figure 3).
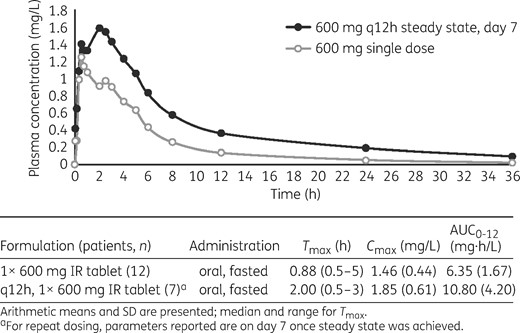
Arithmetic mean concentration–time profiles of lefamulin following fasted oral administration of a single dose in Study 4 (part A of the study; 1 × 600 mg IR tablet) or multiple doses (part B of the study, on day 7; q12h, 1 × 600 mg IR tablet) at steady state. Descriptive statistics of individual AUC, Cmax and Tmax are presented in the table below the graph.
A comparison of PK values under fed and fasting conditions following single oral dose lefamulin (1 × 600 mg IR tablet) demonstrated that Cmax in the fed state was 0.72-fold of the Cmax under fasting conditions (mean, 1.06 versus 1.46 mg/L, respectively), and exposure of lefamulin was slightly lower in the fed state versus fasting conditions (AUC0–12 and AUC0–∞ were 0.83-fold and 0.90-fold of the values observed in fasting subjects). Mean AUC0–12 was also lower in the fed state versus fasting conditions (mean, 5.28 versus 6.35 mg·h/L), whereas median Tmax increased (4.50 versus 0.88 h, respectively) and t½ remained similar (8.75 versus 9.09 h).
All AEs were mild or moderate in severity, no serious AEs were reported, and no participant discontinued because of an AE. No subject experienced a severe or serious AE. Nearly all AEs reported were GI related (Table 5), and the incidences were similar following a single dose and repeat dosing [subjects reporting a GI-related AE, n (%): single oral dose, 8 (66.7%); repeat oral dosing, 6 (75.0%); placebo repeat dosing, 2 (50%)]. Diarrhoea (mild to moderate intensity) was experienced by three subjects (25%) in the single oral dose fed treatment group, two subjects (16.7%) in the single dose fasted treatment group and four (50%) in the repeat oral dosing treatment group.
Treatment-emergent AEs in subjects administered single or repeated oral doses of lefamulin 600 mg compared with repeated oral doses of placebo in Study 4
| Lefamulin | Placebo | |||
|---|---|---|---|---|
| AE, preferred term, n (%) | single dose, fed n = 12 | single dose, fasted n = 12 | repeat dose n = 8 | repeat dose n = 4 |
| All AEs | 3 (25.0) | 8 (66.7) | 6 (75.0) | 2 (50.0) |
| Abdominal discomfort | 0 | 0 | 1 (12.5) | 0 |
| Abdominal pain, upper | 0 | 1 (8.3) | 2 (25.0) | 0 |
| Diarrhoea | 3 (25.0) | 2 (16.7) | 4 (50.0) | 0 |
| Dyspepsia | 0 | 1 (8.3) | 1 (12.5) | 0 |
| Eructation | 0 | 2 (16.7) | 1 (12.5) | 0 |
| Faeces discoloured | 0 | 0 | 0 | 1 (25.0) |
| Flatulence | 0 | 0 | 2 (25.0) | 0 |
| Nausea | 0 | 5 (41.7) | 3 (37.5) | |
| Vomiting | 0 | 1 (8.3) | 0 | 1 (25.0) |
| Decreased appetite | 0 | 0 | 1 (12.5) | 0 |
| Dysgeusia | 0 | 1 (8.3) | 0 | 0 |
| Headache | 0 | 0 | 0 | 1 (25.0) |
Discussion
Lefamulin is the first pleuromutilin antibiotic for iv and oral administration in humans with serious bacterial infections. In general, the plasma concentration–time curve of iv-administered lefamulin in humans showed a multiphasic decline. Following the end of infusion (Cmax), a rapid distribution phase was observed over 0.5h, followed by an extended elimination phase with a mean t½ of 13.2 h. Absorption of lefamulin was rapid, with two peaks after oral administration of an IR formulation, suggesting a mixed order of absorption, starting with a first plasma concentration peak occurring 20min to 1h after dosing, followed by a second peak describing a zero-order input, with a later Tmax 1–4 h after dosing. Although the absolute bioavailability was 25%, the variability in PK parameters after administration of 150 mg iv or 600 mg orally was similar.
Repeated dosing of 600 mg oral and 150 mg iv lefamulin resulted in similar exposure in terms of AUC. The rate of drug absorption after oral administration is comparable between single and repeat doses, with slightly higher accumulation after q12h oral administration. Because efficacy of lefamulin is most strongly correlated with the AUC (see article in this Supplement entitled ‘In vivo pharmacodynamics of lefamulin, the first systemic pleuromutilin for human use, in a neutropenic murine thigh infection model’,16 for details), the bioequivalence between 150 mg iv and the 600 mg IR tablet was shown, focusing on exposure. To that end, the PK analyses presented here for single and repeated dosing support that both oral and iv administration of lefamulin rapidly results in therapeutic plasma concentrations [mean AUC0–12, mg·h/L (range if treatment included in more than one study): single oral fasted, 6.35–6.42; single iv, 6.23–6.59; repeated oral fasted, 10.80; repeat iv fasted, 8.27].
In addition, lefamulin exposure following oral administration in the fasted state, or in the fasted state followed by a meal 1 h after dosing, was similar and achieved bioequivalence. When lefamulin was administered with a high-fat, high-calorie meal, bioequivalence was not established based on FDA criteria. However, population PK modelling and target attainment predict that lefamulin penetration in the ELF of the lung (measured by AUC0–24) is comparable following iv and oral administration in both fed and fasted states (see article in this Supplement entitled ‘Prediction of lefamulin epithelial lining fluid penetration after intravenous and oral administration using Phase 1 data and population pharmacokinetics methods’,17 for details), and the probability of achieving target attainment for oral lefamulin on the first day of dosing is >98% in the plasma and ELF regardless of whether lefamulin is administered with or without food (see article in this Supplement entitled ‘Pharmacokinetic/pharmacodynamic target attainment analyses to support intravenous and oral lefamulin dose selection for the treatment of patients with community-acquired bacterial pneumonia’18).
Lefamulin was generally well tolerated regardless of iv or oral administration by single or repeat dosing; the majority of AEs were mild or moderate. The most common AEs following oral administration (600 mg) were GI related, with the incidences being lower when lefamulin was co-administered with food than in a fasted state [percentage of patients reporting a GI-related AE (range given when a treatment was included in more than one study): single oral fasted, 16.7%–66.7%; single oral fasted + meal, 23.1%; single oral fed, 5%–8.3%; repeat oral fasted, 75%]. Although the incidence of GI-related AEs was lower when lefamulin was administered after food, exposure was not bioequivalent to iv administration or oral administration in the fasted state. There may be a reduction in GI-related AEs following oral administration of lefamulin in the fasted state with a meal 1 h after dosing (which met bioequivalence); however, the sample size was small, and further analyses are required to explore this trend.
GI-related AEs also occurred with iv lefamulin (150 mg) after multiple doses (patients reporting a GI-related AE: 25.4% for Study 1). When lefamulin was administered in a single iv dose in Study 2, no GI-related AEs were reported.
These data demonstrate that lefamulin is generally well tolerated and shows predictable PK for oral and iv administration with rapid plasma absorption. These data, coupled with previous studies demonstrating that lefamulin achieves therapeutic concentrations in the ELF, support the use of lefamulin in patients with CABP.11 Lefamulin possesses a unique mechanism of action, which results in no cross-resistance with other commonly used agents for CABP and a low propensity for the development of resistance, has an excellent PK/PD profile, and is an effective and generally safe and well-tolerated treatment for adults with CABP. The results presented here suggest that lefamulin can be a potentially valuable addition to the current antibiotic treatment armamentarium and be a therapeutic advance for patients with CABP.
Funding
This work was supported by Nabriva Therapeutics. Editorial support for development of this article was funded by Nabriva Therapeutics.
Transparency declarations
W. W. W., C. L., W. H. and S. P. G. are employees of and hold stock in Nabriva Therapeutics plc. W. T. P. is a former employee of and holds stock in Nabriva Therapeutics plc. Editorial support for the development of this article was provided by Charlotte Majerczyk, PhD, and Lisa M. Klumpp Callan, PhD, C4 MedSolutions LLC (Yardley, PA), a CHC Group company, and funded by Nabriva Therapeutics.
This article forms part of a Supplement sponsored by Nabriva Therapeutics.
References
US Food and Drug Administration, Department of Health and Human Services, Center for Drug Evaluation and Research. Guidance for Industry: Food-Effect Bioavailability and Fed Bioequivalence Studies. https://www.fda.gov/downloads/drugs/guidancecomplianceregulatoryinformation/guidances/ucm070241.pdf.
