


Abstract
To present results of preclinical studies that supported further development of lefamulin for treating patients with community-acquired bacterial pneumonia (CABP).
The effect of bovine lung surfactant on the antibacterial activity of lefamulin against Streptococcus pneumoniae and Staphylococcus aureus was determined by broth microdilution assay. In vitro accumulation of lefamulin was evaluated in J774 mouse macrophages. Pharmacokinetics was assessed in female BALB/c (Bagg albino) mice treated with subcutaneous lefamulin (35 or 70 mg/kg). In neutropenic lung infection experiments, BALB/c mice received intraperitoneal cyclophosphamide before challenge with single S. pneumoniae or S. aureus strains; subcutaneous lefamulin (1.25–160 mg/kg) was given twice daily post-infection. Hill models described relationships between AUC/MIC ratios and changes in log10 cfu.
Lung surfactant did not significantly increase lefamulin MIC values against test strains. Lefamulin uptake in macrophages was rapid (a plateau was reached in ∼3 h). In mice, distribution of lefamulin [plasma to epithelial lining fluid (ELF)] was rapid, showing an ∼2-fold increase in lefamulin exposure in the ELF during the 5.5 h period. Median plasma AUC/MIC ratios associated with 1 and 2 log10 cfu reductions from baseline were 1.37 and 2.15, respectively, for S. pneumoniae and 2.13 and 6.24 for S. aureus. Corresponding ELF results were 14.0 and 22.0 for S. pneumoniae and 21.7 and 63.9 for S. aureus.
Overall, lefamulin displays desirable pharmacokinetic/pharmacodynamic relationships that are predictive of the clinical effectiveness of lefamulin and other antibacterial agents used to treat CABP.
Introduction
Pneumonia is common worldwide and is associated with significant morbidity and mortality.1,2,Streptococcus pneumoniae, a common cause of community-acquired bacterial pneumonia (CABP), is among the bacterial pathogens identified by the US CDC as posing serious domestic antibiotic resistance threats that require ongoing public health monitoring and prevention activities.3 Cases of antimicrobial-resistant streptococcal pneumonia result in about 32000 additional doctor visits and 19000 additional hospitalizations each year, leading to $96 million in excess medical costs annually in the USA.3 Although the prevalence of Staphylococcus aureus CABP is generally low, MRSA patients in particular tend to have higher severity of illness scores, higher in-patient mortality and longer hospital length of stay than patients with non-S. aureus and pneumococcal CABP, and empirical use of anti-MRSA antibiotics is common.4 Resistance levels among S. aureus, especially MRSA, to antibiotics commonly used to treat CABP (e.g. macrolides, lincosamides and fluoroquinolones) are concerning.5,6
Lefamulin is a novel pleuromutilin antibacterial agent under development for oral and intravenous administration for the treatment of CABP. It is a protein synthesis inhibitor that specifically binds to the 50S ribosomal subunit of the peptidyl transferase centre at the A- and P- sites.7,8 Lefamulin has demonstrated potent in vitro activity against a variety of pathogens commonly associated with CABP, acute bacterial skin and skin structure infections and sexually transmitted infections.9–11 Lefamulin does not show cross-resistance with macrolides, tetracyclines, β-lactam antibiotics or fluoroquinolones and has demonstrated low potential for resistance development.10–14
In the first article of this Supplement (‘In vivo pharmacodynamics of lefamulin, the first systemic pleuromutilin for human use, in a neutropenic murine thigh infection model’15), the efficacy of lefamulin was shown to correlate most strongly with the ratio of AUC0–24 to MIC (AUC/MIC). In this article, we present the results of studies investigating the pharmacokinetics (PK) of lefamulin in mice, its in vitro accumulation in murine lung macrophages, and the effect of lung surfactant on lefamulin MIC values against test strains of S. pneumoniae and S. aureus. We also present the results of neutropenic lung infection studies examining PK and pharmacodynamic (PD) targets for efficacy to support dose selection for the treatment of patients with CABP.
Methods
Ethics
This research was conducted following approval from the Austrian Agency for Health and Food Safety Ltd. All studies were carried out in accordance with local regulations.
Challenge organisms and MIC determination
A challenge panel consisting of clinically relevant strains from the SENTRY Antimicrobial Surveillance Program was assembled based on virulence and antibacterial activity (Table 1), including those with clinically relevant lefamulin MIC values that encompassed the observed range and exceeded the MIC value at which 90% of the isolates are inhibited (MIC90) for S. pneumoniae (0.25 mg/L) and S. aureus (0.12 mg/L).14 MIC values were determined according to CLSI guidelines.16
Strains used in the studies
| Strain | Source | Resistance summary | Lefamulin MIC (mg/L) |
|---|---|---|---|
| S. pneumoniae | |||
| 248092 | IHMA | MDR | 0.06–0.12 |
| 411627 | IHMA | MDR | 0.03–0.06 |
| 49619 | ATCC | PSSP | 0.03–0.06 |
| B1378 | BAL, SENTRY 2010 | PISP | 0.12 |
| B1382 | BAL, SENTRY 2010 | PSSP | 0.25 |
| B1383 | BAL, SENTRY 2010 | PRSP, MR | 0.25 |
| B1385 | BAL, SENTRY 2010 | PSSP | 0.5 |
| B1386 | BAL, SENTRY 2010 | PISP, MR | 0.5 |
| S. aureus | |||
| 29213 | ATCC | MSSA, quality control strain | 0.12 |
| B154 | ATCC 25923 | MSSA | 0.12 |
| B341 | ATCC 33591 | MRSA | 0.06–0.12 |
| B1118 | SENTRY 2002 | MRSA | 0.12 |
| B1325 | SENTRY 2010 | MRSA | 0.5 |
| B1331 | SENTRY 2010 | MRSA | 0.5 |
IHMA, International Health Management Associates; MR, macrolide resistant; PISP, penicillin-intermediate S. pneumoniae; PRSP, penicillin-resistant S. pneumoniae; PSSP, penicillin-susceptible S. pneumoniae.
The effect of lung surfactant on the antibacterial activity of lefamulin and daptomycin (Cubicin®, Novartis Pharmaceuticals, New York, NY, USA) was determined by a chequerboard broth microdilution assay.17 Bacterial suspensions equivalent to a 0.5 McFarland standard (1 × 10⁸ cfu/mL) were prepared from colonies grown on fresh agar plates and diluted to 5 × 10⁵ cfu/mL in CAMHB (Becton Dickinson, Franklin Lakes, NJ, USA) for S. aureus and in CAMHB supplemented with 2%–5% Remel™ laked horse blood (ThermoFisher Scientific, Nazareth, PA, USA) for S. pneumoniae. The calcium concentration was adjusted to 50 mg/mL for experiments with daptomycin. Bovine lung surfactant (Survanta®, AbbVie Inc., Lake Bluff, IL, USA) was added to 15–1000 mg/L, corresponding to a final surfactant concentration ranging from 0.06% to 4% (v/v). Plates were incubated overnight at 37°C, and growth was inspected visually and scanned using a microplate reader set to an OD of 600 nm. The MIC was recorded as the lowest antibiotic concentration without visible bacterial growth.
In vitro accumulation of lefamulin and azithromycin in murine macrophages
J774 mouse macrophages (ATCC TIB-67) were grown in Roswell Park Memorial Institute (RPMI) 1640 medium supplemented with 10% inactivated fetal calf serum (ThermoFisher Scientific, Nazareth, PA, USA), plated at a concentration of 2 × 10⁶ cells/mL and incubated at 37°C with 5% CO2 for 24 h to adhere overnight. Cells were then washed and further incubated in RPMI for up to 5 h at 37°C (5% CO2) with 1 or 5 mg/L lefamulin, azithromycin (positive control; Pfizer Inc., New York, NY, USA) or penicillin G (negative control; Sigma–Aldrich, Darmstadt, Germany), then washed and disrupted with three freeze–thaw cycles in liquid nitrogen and at 37°C. Samples were collected at time 0 to determine the extracellular drug concentration to test compound stability during the lysis procedure.
The intracellular-to-extracellular drug concentration (Ci/Ce) ratio was calculated assuming that 1 mg of cellular protein is equivalent to a cellular volume of 5 μL, as reported for peritoneal macrophages or cultured fibroblasts.18–20 Cellular protein concentration was determined with the Bradford assay (Bio-Rad Laboratories, Inc., Hercules, CA, USA) using an aqueous BSA solution for the standard calibration curve. The intracellular volume was confirmed by the Moxi™ Z Mini Automated Cell Counter (Orflo Technologies, Ketchum, ID, USA).
Cell lysate samples were analysed by LC–MS/MS in electrospray ionization positive mode using a 1100 Series high pressure gradient HPLC system (Agilent Technologies, Santa Clara, CA, USA), which was coupled to a triple-quadrupole mass spectrometer (G6410A, Agilent Technologies). Determination of drug concentration in cell lysate was performed after protein precipitation with ice-cold acetonitrile containing an internal standard and subsequent centrifugation and dilution with water. The chromatographic separation was performed on a reversed-phase column (Zorbax SB-C18, 50 × 2.1 mm, 3.5 μm, Agilent Technologies) protected by a guard column (Widepore C18, 4 × 2 mm, Phenomenex, Torrence, CA, USA) at a column temperature of 40°C (azithromycin: 50°C), a flow rate of 400 μL/min, and using different gradients. The gas heater of the MS/MS system was kept at 350°C with a nitrogen gas flow of 6 L/min and a pressure of 35 psi. The voltage of the heated capillary was set to 4500 V for lefamulin and azithromycin and 3500 V for penicillin G. The time segment from 2.5 to 6 min was diverted to the MS/MS system for detection of lefamulin (3–5 min for detection of azithromycin and 3–5.5 min for detection of penicillin G). The eluent was diverted to waste at all other times.
Compound concentrations in cell lysate samples were quantified against six-point calibration curves covering the range of 0.05–3 mg/L for lefamulin and 0.025–2 mg/L for azithromycin. For penicillin G, a seven-point calibration curve covering a range of 0.001–0.5 mg/L was used. Calibration samples were prepared by spiking compound stock solutions in blank cell lysate. For in-study validation, quality control (QC) samples at two different concentrations within the calibration range were prepared by spiking compound stock solutions in blank cell lysate. The accuracy for 75% of the back-calculated calibration and 67% of the QC samples had to be 80%–120% [at lower limit of quantification (LLOQ), 70%–130%], the precision had to be ≤20% (≤30% at LLOQ), and the coefficient of determination (R2) for a linear regression (1/concentration2 weighted) had to be ≥0.98.
After the assay, Ce was determined by single-point calibrations with calibration sample concentrations at the nominal Ce (i.e. 1 and 5 mg/L). For each determination, two independently prepared calibration samples (two weighted portions) at the nominal Ce were injected twice. Because two independent calibration samples were used, no extra QC samples were prepared. The accuracy of the back-calculated calibration samples had to be between 80% and 120%.
Pharmacokinetics of lefamulin
PK parameters were evaluated in uninfected non-neutropenic female BALB/c mice (weight, 18–25 g, n = 3–4 per timepoint across four studies; Charles River Deutschland GmbH, Sulzfeld, Germany) that received a single subcutaneous lefamulin dose of 35 or 70 mg/kg. Blood and bronchoalveolar lavage (BAL) samples were collected predose and at seven timepoints 0.25–5.5 h after lefamulin administration. Plasma and BAL samples were analysed by LC–MS/MS (G6410A, Agilent Technologies) after protein precipitation, centrifugation and subsequent dilution with water. The method was linear in the concentration range of 0.01–2.5mg/L. Lefamulin concentrations in the epithelial lining fluid (ELF) were calculated from the concentrations in BAL. The dilution factor for the ELF samples was determined from the BAL-to-plasma urea concentration ratio in samples collected at the same time (QuantiChrom™ Urea Assay Kit, BioAssay Systems, Hayward, CA, USA) considering equal urea levels in plasma and ELF.21 The PK profile of lefamulin was analysed by the sparse sampling non-compartmental method (Phoenix WinNonlin 6, Certera, Princeton, NJ, USA) based on the nominal timepoints. AUC values were determined using the linear trapezoidal method.
Neutropenic murine lung infection model
BALB/c mice (n = 6 females/group; 19–21 g) were rendered neutropenic by two intraperitoneal cyclophosphamide injections (Baxter, Halle, Germany) administered 4 days and 1 day (150 and 100 mg/kg, respectively) before being challenged with ∼106 cfu of a single S. pneumoniae or S. aureus strain placed on the tip of the nares. Lefamulin treatment was initiated 2 h after inoculation, with 1.25–160 mg/kg doses given subcutaneously twice daily at 2 and 5 h post-infection (total daily dose 2.5 − 320 mg/kg). These timepoints were chosen because they were closer to the clinical setting based on the fasted clearance of lefamulin in mice compared with humans. Untreated control mice and treated mice were euthanized at the end of the 24 h treatment period. Lung tissue was dissected, homogenized, serially diluted and plated for cfu determination.
Treatment efficacy was evaluated by comparing the common logarithmic (log10) cfu reduction at the end of the treatment period in the infected tissues of treated animals with the mean cfu in the animals before treatment onset (early control; i.e. 2 h post-infection). A one-way analysis of variance (Dunnett’s method; SigmaPlot v12.3, Systat Software, Inc., San Jose, CA, USA) was used to calculate the response (Δcfu/tissue) after treatment with various lefamulin doses compared with the Δcfu of the untreated control group (late control) and the bacterial burden before onset of treatment (early control). The magnitude of the 24 h AUC/MIC ratio associated with a reduction in bacterial burden relative to baseline of 1 or 2 log10 cfu/tissue (1 or 2 log10 kill cfu/tissue) was determined using an inhibitory sigmoid maximum effect observed after fitting a sigmoid curve (Emax) model (Hill function, Origin Pro 8G, OriginLab, Wellesley Hills, MA, USA) (Table 2).
Parameters for mean Hill-curve fit for S. pneumoniae and S. aureus
| Model parameter | S. pneumoniae | S. aureus |
|---|---|---|
| E0 (mg/L) | 1.222 | 2.0222 |
| Emax (mg/L) | 5.046 | 4.902 |
| EC50 (mg/L)a | 18.92 | 10.12 |
| Hill coefficient | 1.302 | 1.040 |
| R2 | 0.65 | 0.69 |
| Model parameter | S. pneumoniae | S. aureus |
|---|---|---|
| E0 (mg/L) | 1.222 | 2.0222 |
| Emax (mg/L) | 5.046 | 4.902 |
| EC50 (mg/L)a | 18.92 | 10.12 |
| Hill coefficient | 1.302 | 1.040 |
| R2 | 0.65 | 0.69 |
EC50 values shown are those for Hill models based on total-drug epithelial lining fluid (ELF) AUC/MIC ratios.
Results
Antibacterial in vitro activity and effect of lung surfactant
The lefamulin MIC values were 0.12–0.5 and 0.06–0.5 mg/L for the S. pneumoniae and S. aureus strains used in the lung surfactant studies, respectively (Table 1). The addition of bovine lung surfactant (up to 250 mg/L) did not result in a significant increase in lefamulin MIC values against S. pneumoniae strains. A similar result was observed when S. aureus strains were grown in the presence of up to 1000 mg/L lung surfactant. The lefamulin MIC increase was no more than 2-fold (within one dilution) for all the strains tested under various surfactant concentrations (Table 3). In contrast, daptomycin MIC values increased substantially with increasing concentrations of bovine lung surfactant. A >2-fold increase in daptomycin MIC was seen for all S. aureus and S. pneumoniae strains with the lowest concentration of lung surfactant tested (15 mg/L; 0.06%), and MIC values continued to increase up to ≥160-fold with increasing amounts of lung surfactant (Table 3).
Lefamulin and daptomycin MIC values in the presence of increasing lung surfactant concentrations
| Test organism MIC (mg/L) | ||||||
|---|---|---|---|---|---|---|
| Surfactant concentration | S. pneumoniae | S. aureus | ||||
| mg/L | % (v/v) | 248092 (n = 4) | 411627 (n = 4) | ATCC 49619 (n = 2) | ATCC 33591 (n = 2) | ATCC 29213 (n = 3) |
| Lefamulin | ||||||
| 0 | 0 | 0.06–0.12 | 0.03–0.06 | 0.03–0.06 | 0.06–0.12 | 0.12 |
| 15 | 0.06 | 0.06–0.12 | 0.03–0.06 | 0.03–0.06 | 0.06–0.12 | 0.06–0.12 |
| 31 | 0.12 | 0.06–0.12 | 0.03–0.06 | 0.03–0.06 | 0.06–0.12 | 0.12 |
| 62.5 | 0.25 | 0.06–0.12 | 0.03–0.06 | 0.03–0.06 | 0.06–0.12 | 0.06–0.12 |
| 125 | 0.5 | 0.06–0.25 | 0.03–0.06 | 0.06 | 0.06–0.12 | 0.12 |
| 250 | 1 | 0.06–0.12 | 0.03–0.06 | 0.06 | 0.12 | 0.12 |
| 500 | 2 | ND | ND | ND | 0.12–0.25 | 0.12–0.25 |
| 1000 | 4 | ND | ND | ND | 0.12–0.25 | 0.12–0.25 |
| Daptomycin | ||||||
| 0 | 0 | 0.12–0.25 | 0.06–0.25 | 0.06 | 0.25–1 | 0.5–1 |
| 15 | 0.06 | 0.25–0.5 | 0.25–0.5 | 0.25–0.5 | 2 | 1–2 |
| 31 | 0.12 | 0.5–1 | 0.25–2 | 0.25–1 | 4 | 2–4 |
| 62.5 | 0.25 | 1–2 | 0.5–2 | 0.5–1 | 8 | 8 |
| 125 | 0.5 | 2–8 | 1–4 | 1–4 | 8–16 | 16 |
| 250 | 1 | 4–16 | 1–8 | 2–16 | >16 | >16 |
| 500 | 2 | 8–>16 | 2–>16 | 4–>16 | >16 | >16 |
| 1000 | 4 | >16 | 2–>16 | 2–>16 | >16 | >16 |
ND, not determined.
Lefamulin uptake in macrophages
Figure 1 shows the intracellular accumulation of test compounds within the murine J774 macrophages over a 5 h period. A fast lefamulin uptake was observed within the first hour, leading to intracellular concentrations ± SD of 35.6 ± 0.7 mg/L (Ci/Ce ratio, 31.2 ± 0.6) and 218 ± 8 mg/L (Ci/Ce ratio, 41.2 ± 1.5) when lefamulin was provided at extracellular concentrations of 1 and 5 mg/L, respectively. Lefamulin further accumulated in the macrophages, reaching a plateau after ∼3 h. A mean Ci of 54.4 ± 4.5 mg/L (lefamulin Ce, 1 mg/L) and 270 ± 7 mg/L (lefamulin Ce, 5 mg/L) was reached after 5 h, leading to Ci/Ce ratios of 47.7 ± 4.0 and 50.9 ± 1.4 when external concentrations of 1 and 5 mg/L were used, respectively.
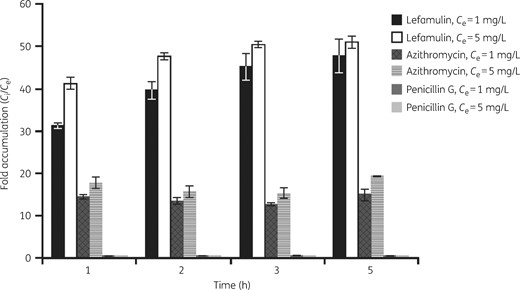
Intracellular accumulation of lefamulin and comparators in J774 mouse macrophages. The graph presents the average (±SD) of triplicate experiments. The extracellular/intracellular concentration ratios (Ce/Ci) for penicillin G were <1.
Azithromycin accumulated in the J774 macrophages at a slower rate, with mean Ci of 18.7 ± 0.6 mg/L (azithromycin Ce, 1 mg/L) and 108 ± 8 mg/L (azithromycin Ce, 5 mg/L) at 1 h. Longer incubation periods did not promote a substantial increase from the mean Ci/Ce ratios (14.5 ± 0.5 for azithromycin Ce, 1 mg/L; 17.7 ± 1.3 for azithromycin Ce, 5 mg/L) recorded at 1 h. Penicillin G intracellular concentrations were below the nominal extracellular concentration provided in the culture medium over the entire incubation period of 1–5 h and even decreased slightly at the later timepoints (at t = 1 h: 0.61 ± 0.10 mg/L for Ce 1 mg/L and 3.18 ± 0.05 mg/L for Ce 5 mg/L); the highest Ci/Ce ratios of 0.54 ± 0.09 and 0.53 ± 0.01 were recorded at t = 1 h for extracellular concentrations of 1 and 5 mg/L, respectively.
Pharmacokinetics
The distribution of lefamulin from plasma to ELF in mice was rapid after a single subcutaneous dose of 35 or 70 mg/kg. Table 4 presents the relevant PK parameters calculated for the distribution of lefamulin in the plasma and ELF. Mean values of the dose-normalized AUC0–24 for plasma (0.136 mg·h/L per mg/kg) and ELF (0.278 mg·h/L per mg/kg) were used for the translation of dose to exposure. For both doses tested during the 5.5 h exposure period, the ratios of ELF AUC to plasma AUC total and unbound were ∼2-fold and 10-fold, respectively. Total plasma and ELF drug concentrations are shown in the concentration–time profiles depicted in Figure 2.
Plasma and ELF exposure measures following a single subcutaneous lefamulin dosea
| Dose (mg/kg) | Matrix | Cmax (mg/L) | AUC0–24 (mg·h/L) | AUC0–24 (mg·h/L)/dose (mg/kg) |
|---|---|---|---|---|
| 35 | plasma | 1.74 | 5.13 | 0.147 |
| ELF | 2.47 | 10.7 | 0.305 | |
| 70 | plasma | 2.46 | 8.66 | 0.124 |
| ELF | 2.96 | 17.6 | 0.251 |
| Dose (mg/kg) | Matrix | Cmax (mg/L) | AUC0–24 (mg·h/L) | AUC0–24 (mg·h/L)/dose (mg/kg) |
|---|---|---|---|---|
| 35 | plasma | 1.74 | 5.13 | 0.147 |
| ELF | 2.47 | 10.7 | 0.305 | |
| 70 | plasma | 2.46 | 8.66 | 0.124 |
| ELF | 2.96 | 17.6 | 0.251 |
Mean values of the dose-normalized AUC0–24 for plasma (0.136 mg·h/L per mg/kg) and ELF (0.278 mg·h/L per mg/kg) were used for the translation of dose to exposure.
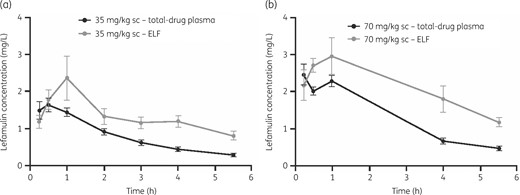
Pharmacokinetic profile in total plasma and ELF of mice following a single subcutaneous dose of lefamulin at 35 mg/kg (a) and 70 mg/kg (b). The error bars represent standard deviations.
Lung infection model and PK/PD studies
The strains used for the lung infection model included those collected as part of the SENTRY Antimicrobial Surveillance Program, which displayed broad lefamulin MIC values (range 0.06–0.5 mg/L). The initial bacterial load was between 5.6 × 10⁶ and 6.1 × 10⁶ cfu/lung in mice infected with S. pneumoniae and between 6.1 × 10⁶ and 6.5 × 10⁶ cfu/lung in mice infected with S. aureus. A statistically significant increase in bacterial load (P < 0.05) was observed within 24 h in untreated control animals, reaching up to 8.0 × 10⁸ cfu/lung in mice infected with S. pneumoniae and up to 8.5 × 10⁸ cfu/lung in mice infected with S. aureus.
Hill models described relationships between the changes in log10 cfu from baseline and unbound plasma or total-drug ELF AUC/MIC ratios for S. pneumoniae and S. aureus. Figure 3 and Table 2 show results based on the data pooled for each pathogen and ELF exposures (S. pneumoniae R2 = 0.65, S. aureus R2 = 0.69), and Table 5 presents the unbound plasma and ELF AUC/MIC ratio associated with 1 and 2 log10 cfu reductions from baseline for S. pneumoniae and S. aureus based on individual Hill-type models for each strain. Median plasma and ELF AUC/MIC ratios of 1.37 and 14.0 were observed for 1 log10 cfu reductions from baseline, respectively, and 2.15 and 22.0 for 2 log10 cfu reductions from baseline for S. pneumoniae strains. The median plasma and ELF AUC/MIC ratios for S. aureus were higher, with ratios of 2.13 and 21.7 recorded for 1 log10 cfu reductions from baseline, respectively, while those associated with a 2 log10 cfu reduction from baseline were 6.24 and 63.9.
Unbound plasma and total-drug ELF AUC/MIC ratio targets for efficacy of lefamulin against S. pneumoniae and S. aureus strains in a neutropenic murine lung infection model
| AUC/MIC ratio | |||||
|---|---|---|---|---|---|
| 1 log10 reduction in cfu | 2 log10 reduction in cfu | ||||
| Strain | MIC (mg/L) | unbound plasma | ELF | unbound plasma | ELF |
| S. pneumoniae | |||||
| B1378 | 0.12 | 6.05 | 61.8 | 10.7 | 109 |
| B1382 | 0.25 | 2.73 | 27.9 | 3.96 | 40.5 |
| B1383 | 0.25 | 0.67 | 6.84 | 1.06 | 10.8 |
| B1385 | 0.5 | 1.34 | 13.7 | 2.15 | 22.0 |
| B1386 | 0.5 | 1.37 | 14.0 | 1.66 | 17.0 |
| mean | NA | 2.43 | 24.9 | 3.91 | 39.9 |
| median (range) | NA | 1.37 (0.67–6.05) | 14.0 (6.84–61.8) | 2.15 (1.06–10.7) | 22.0 (10.8–109) |
| S. aureus | |||||
| B154 | 0.12 | 1.69 | 17.2 | 3.42 | 34.9 |
| B341 | 0.06 | 5.94 | 60.7 | 8.39 | 85.7 |
| B1118 | 0.12 | 0.76 | 7.72 | 1.42 | 14.5 |
| B1325 | 0.5 | 2.13 | 21.7 | 6.25 | 64.0 |
| B1331 | 0.5 | 4.35 | 44.5 | 15.3 | 157 |
| mean | NA | 2.97 | 30.4 | 6.96 | 71.2 |
| median (range) | NA | 2.13 (0.76–5.94) | 21.7 (7.72–60.7) | 6.24 (1.42–15.3) | 63.9 (14.5–157) |
NA, not applicable.
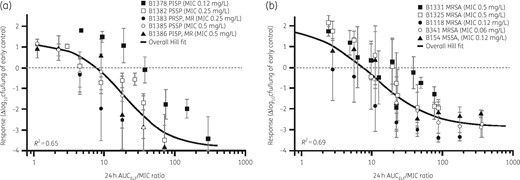
Relationship between change in bacterial burden from baseline in the ELF and lefamulin AUC/MIC based on data from a neutropenic murine lung infection model with S. pneumoniae (a) and S. aureus (b). The error bars represent standard deviations. MR, macrolide resistant; PISP, penicillin-intermediate S. pneumoniae; PRSP, penicillin-resistant S. pneumoniae; PSSP, penicillin-susceptible S. pneumoniae.
The mean sigmoid curve fitted over five S. pneumoniae strains resulted in a mean 24 h unbound drug in plasma AUC/MIC ratio of 1.51 (95% CI 0.95–2.35) for a 1 log10 kill. The corresponding mean Hill-fit ratios over all S. aureus strains were 1.50 (95% CI 1.25–1.75) for the 1 log10 kill endpoint and 4.00 (95% CI 3.12–5.27) for a 2 log10 kill target, corresponding to the magnitude of ELF AUC/MIC ratios at the site of infection of 16.0 (95% CI 13.3–18.8) and 43.6 (95% CI 33.8–58.1) for 1 log10 and 2 log10 kill, respectively.
Discussion
Establishing the correlation between in vitro susceptibility and clinical efficacy is a significant challenge in the antibiotic development process.22 Validated in vitro PK/PD and animal infection models are therefore important tools for identifying the PK/PD indices that are most predictive of efficacy.22 These studies evaluated the pharmacological in vitro and in vivo characteristics of lefamulin to inform dosing for clinical trials in patients with pneumonia.
In the present study, lefamulin concentrations in the ELF were ∼10-fold greater than those of the unbound fraction in plasma after a single subcutaneous dose. When healthy human volunteers received a single 150 mg lefamulin dose intravenously, exposure to lefamulin in ELF was ∼5.7-fold higher than the unbound fraction in plasma, thus supporting the basis for the antibacterial effect of lefamulin observed in murine bronchopneumonia infection models.23 Additionally, by considering effect site exposures when determining PK/PD targets associated with efficacy, dose selection decisions and future translations to clinical data can be optimized.24
Promising antibacterial agents with potent in vitro profiles were rendered ineffective for treating pneumonia during clinical trials when lung surfactant binding made them unavailable to act against the infecting pathogen.25,26 On the other hand, the inhibitory pulmonary surfactant effect is not universal because some antibiotics retain their antibacterial properties when tested in vitro with physiologically relevant surfactant concentrations.27 Additionally, pulmonary macrophages play a pivotal role in the native defence against lower respiratory tract infections.28 Because alveolar macrophages can be the sites of intracellular pulmonary infections, studying the antibacterial agent’s capacity to penetrate pulmonary macrophages is an essential step in the development of new agents that will successfully treat lower respiratory infections.29
In this study, the in vitro antibacterial activity of lefamulin against CABP-inducing bacteria remained unaltered in the presence of pulmonary surfactants at concentrations that antagonized the antimicrobial activity of daptomycin. Lefamulin also displayed a fast uptake and accumulation in macrophages at clinically relevant extracellular concentrations. Our results are consistent with other studies that supported the further development of antibacterial agents currently approved or under investigation for the treatment of pneumonia based on the antibacterial agent’s activity against pulmonary pathogens in the presence of bovine pulmonary surfactants.30,31 Similar uptake and accumulation results have been used as baseline values to determine drug exposure indexed to MIC to assist in drug regimen evaluations for the treatment of lower respiratory infections.29
Furthermore, this study determined the magnitude of in vivo exposures indexed to MIC associated with efficacy in serious lung infections caused by 10 S. aureus and S. pneumoniae strains representing the clinically relevant span of lefamulin MIC values (0.06–0.5 mg/L). All strains tested in the neutropenic murine infection model established bronchopneumonia infections, with untreated animals challenged with S. aureus strains reaching a mean bacterial burden of +1.9 log10 cfu/lung above baseline compared with −2.9 log10 cfu/lung for the animals treated with lefamulin. The shape of individual AUC/MIC-to-response profiles of lefamulin was similar for each strain and consistent between S. pneumoniae and S. aureus. When the pooled data for each set of isolates were evaluated, the data were well described by Hill models for each pathogen.
Overall, lefamulin displays desirable characteristics that are predictive of clinical effectiveness for antibacterial agents used to treat CABP. Lefamulin is unaffected by pulmonary surfactants and has the capacity to penetrate and accumulate in macrophages, which are thought to promote the distribution of drugs to the target tissue. Lefamulin further demonstrated distribution to the target tissue/organ, the ELF. Results of these experiments were used to support the dose selection for the recently completed Phase 3 clinical trials for the treatment of patients with CABP and preliminary evaluations of susceptibility breakpoints for CABP-producing pathogens (see article in this Supplement entitled ‘Pharmacokinetic/pharmacodynamic target attainment analyses to support intravenous and oral lefamulin dose selection for the treatment of patients with community-acquired bacterial pneumonia’32).
Acknowledgements
The authors thank Tiffany Keepers, PhD, and Kevin Krause (now employees of Achaogen, South San Francisco, CA, USA) for performing the lung surfactant experiments contracted by Nabriva Therapeutics. Sujata Bhavnani, PharmD, from the Institute for Clinical Pharmacodynamics, Inc., Schenectady, NY, USA, gave valuable feedback during the development of this article. This work has previously been presented, in part, at the 53rd Interscience Conference on Antimicrobial Agents and Chemotherapy, 10–13 September 2013, Denver, CO (abstracts A-037 and A-011).
Funding
This work was supported by Nabriva Therapeutics. Editorial support for this article was funded by Nabriva Therapeutics.
Transparency declarations
Wolfgang W. Wicha, Dirk B. Strickmann, and Susanne Paukner are employees of and hold stock in Nabriva Therapeutics plc. Editorial support for development of this article was provided by Lycely del C. Sepulveda-Torres, PhD, and Michael S. McNamara, MS, at C4 MedSolutions, LLC (Yardley, PA), a CHC Group company, and funded by Nabriva Therapeutics.
This article forms part of a Supplement sponsored by Nabriva Therapeutics.
References
World Health Organization. Pneumonia: Key Facts. http://www.who.int/mediacentre/factsheets/fs331/en/.
Centers for Disease Control and Prevention. Antibiotic Resistance Threats in the United States,
European Centre for Disease Prevention and Control.
The Center for Disease Dynamics, Economics & Policy. Resistance Map: Staphylococcus aureus. https://resistancemap.cddep.org/AntibioticResistance.php.
Clinical and Laboratory Standards Institute.
