


Abstract
The SENTRY Antimicrobial Surveillance Program monitors the frequency of occurrence and antimicrobial susceptibility of organisms from various infection types worldwide.
A total of 102 995 bacterial isolates were consecutively collected (one per patient) in 1997–2016 from 258 medical centres in North America (n = 44 999; 113 centres), Europe (n = 30 988; 61 centres from 22 nations), the Asia-Pacific region (APAC; n = 16 503; 67 centres from 12 nations) and Latin America (n = 10 505; 17 centres from 7 nations). Organisms were isolated from respiratory tract specimens and tested for susceptibility by broth microdilution methods in a central laboratory.
Staphylococcus aureus (n = 24 351) and Pseudomonas aeruginosa (n = 22 279) were the most common organisms overall. Klebsiella spp. (n = 10 565) ranked third in North America, Europe and APAC. The proportion of Gram-negatives increased from 70.0%–74.7% to 80.9%–82.6% in Europe, APAC and Latin America, and remained stable (65.5%–66.1%) in North America. Methicillin resistance rates decreased substantially in all four regions from 2005–06 to 2015–16 among S. aureus isolates. P. aeruginosa susceptibility to meropenem decreased overall in the initial years, but increased in the last years of the investigation. Among Klebsiella spp. isolates, susceptibility to ceftriaxone/meropenem decreased from 85.9%/99.3% to 58.6%/85.8% in Europe and from 91.8%/99.5% to 81.6%/93.9% in APAC during the study period.
Rank order and susceptibility rates varied widely by geographical region and over time. The occurrence of some resistance phenotypes increased, though others decreased over the 20 years of the SENTRY Antimicrobial Surveillance Program.
Introduction
The SENTRY Antimicrobial Surveillance Program was established to monitor the predominant pathogens and antimicrobial resistance patterns of nosocomial and community-onset infections via a broad network of sentinel hospitals distributed by geographical location and size. It is the longest running antimicrobial surveillance programme that monitors pathogens and the changes in resistance patterns worldwide over time through centralized testing and utilizing reference susceptibility methods. In the SENTRY Antimicrobial Surveillance Program, bacterial isolates are consecutively collected (one per infection episode) according to the infection type and sent to a central monitoring laboratory (JMI Laboratories, North Liberty, IA, USA) where they are tested for susceptibility by reference broth microdilution methods against many antimicrobial agents available for clinical use. The current study design collects clinical isolates under the following objectives: bloodstream, skin and skin structure, community-acquired respiratory, urinary tract, intra-abdominal and invasive fungal infections, and pathogens from patients hospitalized with pneumonia.1,2
Pneumonia is the second most common infection in hospitalized patients and it is associated with significant morbidity and mortality.3,4,Staphylococcus aureus and Pseudomonas aeruginosa are reported as the main causes of pneumonia in hospitalized patients, but the importance of Enterobacteriaceae species, mainly Klebsiella pneumoniae, Enterobacter spp. and Escherichia coli, and other non-fermentative Gram-negative bacilli, such as Acinetobacter spp. and Stenotrophomonas maltophilia, has increased substantially in recent years.2,5,6 Furthermore, the antimicrobial susceptibility of some of these organisms has varied markedly over time and among geographical regions.7–10 In the present investigation, we evaluated the frequency and antimicrobial susceptibility patterns of pathogens collected during the 20 years of the SENTRY Antimicrobial Surveillance Program from patients hospitalized with bacterial pneumonia.
Materials and methods
Organism collection
Each participating centre was asked to collect consecutive bacterial isolates from lower respiratory tract specimens determined to be significant by local criteria as the reported probable cause of pneumonia. Medical records were not available to make clinical inferences about the infection source for patients hospitalized with pneumonia (e.g. community acquired or hospital acquired); thus, this category includes patients hospitalized for any reason who were diagnosed with pneumonia while hospitalized. Qualified sputum samples and isolates from invasive sampling (transtracheal aspiration, bronchoalveolar lavage, protected brush samples, etc.) were accepted.
A total of 102 995 bacterial isolates were collected (one per patient) in 1997–2016 from 258 medical centres located in North America (n = 44 999; 113 centres from the USA and Canada), Europe (n = 30 988; 61 centres from 22 nations), the Asia-Pacific region (APAC; n = 16 503; 67 centres from 12 nations) and Latin America (n = 10 505; 17 centres from 7 nations). Data from India were excluded from the analysis because India participated in the programme only for a few years and contributed highly resistant isolates, which could have introduced bias.
Carbapenem-resistant Enterobacteriaceae (CRE) were defined as any isolate displaying MIC values >2 mg/L with meropenem, imipenem (not applied for Proteus mirabilis or indole-positive Proteeae) and/or doripenem.11 MDR Enterobacteriaceae and P. aeruginosa were defined as any isolate non-susceptible (CLSI criteria) to ≥1 agent in ≥3 of the following antimicrobial classes: broad-spectrum cephalosporins, carbapenems, broad-spectrum penicillin combined with a β-lactamase inhibitor, fluoroquinolones, aminoglycosides, glycylcyclines (for Enterobacteriaceae only) and the polymyxins.12
Susceptibility methods
Organisms were tested for susceptibility by reference broth microdilution methods in a central laboratory according to the current CLSI documents.13 Validated MIC panels were manufactured at JMI Laboratories (2015–16) or by ThermoFisher Scientific (1997–2014; Cleveland, OH, USA), and susceptibility rates were stratified by 2 year periods. Susceptibility percentages and validation of quality control results were based on CLSI11 and EUCAST14 documents.
Results
Overall, S. aureus (n = 24 351) and P. aeruginosa (n = 22 279) were the most prevalent organisms in all regions, but frequency of occurrence varied among regions (Figure 1). P. aeruginosa ranked first in Europe, APAC and Latin America; S. aureus was most common in North America. Klebsiella spp. (n = 10 565) ranked third in North America (Figures 1 and 2), Europe (Figures 1 and 3) and APAC and fourth in Latin America, where Acinetobacter spp. ranked third (Figure 1). S. maltophilia (n = 3779 for all regions) ranked seventh in North America with a frequency that oscillated from a low of 2.9% in 2003–04 to a high of 5.6% in 2013–14; in Europe S. maltophilia ranked eighth and its frequency increased continuously from 2.7% in 1997–98 to 4.4% in 2015–16. When comparing 1997–98 data with 2015–16 data, the proportion of Gram-negative bacilli increased from 70.0%–74.7% to 80.9%–82.9% in Europe, APAC and Latin America, but remained stable (65.5%–66.1%) in North America (data not shown).
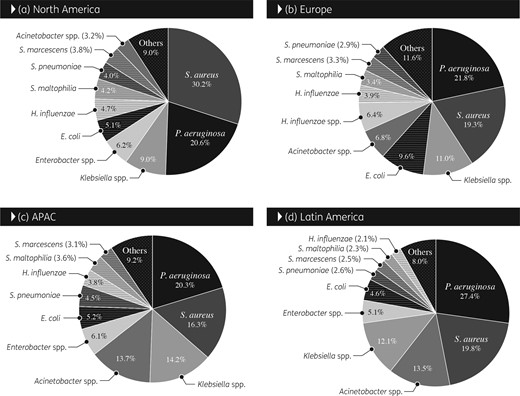
Overall frequency (1997–2016) of occurrence of organisms isolated from patients hospitalized with pneumonia stratified by geographical region. APAC, Asia-Pacific region.
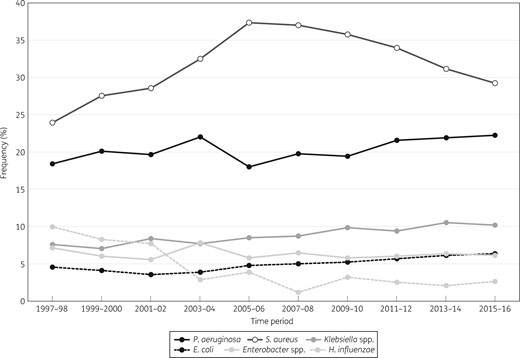
Frequency of occurrence for the main organisms isolated from patients hospitalized with pneumonia in North America (SENTRY Antimicrobial Surveillance Program, 1997–2016).
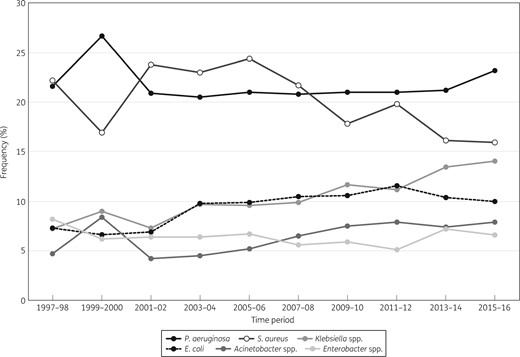
Frequency of occurrence for the main organisms isolated from patients hospitalized with pneumonia in Europe (SENTRY Antimicrobial Surveillance Program, 1997–2016).
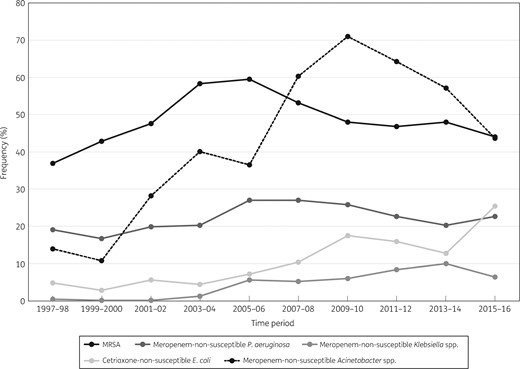
Among S. aureus isolates, MRSA rates decreased substantially in all four regions from 2005–06 to 2015–16, especially in North America (59.6% to 44.0%) (Figure 4), Europe (36.4% to 26.4%) (Figure 5) and Latin America (50.7% to 34.8%) (data not shown). In the 2015–16 period, the MRSA rate was highest in North America (44.0%), followed by APAC (39.4%), Latin America (34.8%) and Europe (26.4%) (Table 1). Moreover, dalbavancin (MIC50 and MIC90 0.03 mg/L), telavancin (MIC50/90 0.03/0.06 mg/L), tigecycline (MIC50/90 0.06/0.12 mg/L) and vancomycin (MIC50/90 0.5/1 mg/L) showed complete activity (100.0% susceptible per CLSI criteria), and linezolid (MIC50 and MIC90 1 mg/L) and oritavancin (MIC50/90 0.015/0.03 mg/L) were active against 99.9% of S. aureus isolates from all regions combined in the 2015–16 period (Table 1).
Frequency of occurrence of the key resistance phenotypes in North America (SENTRY Antimicrobial Surveillance Program, 1997–2016).
Frequency of occurrence of the key resistance phenotypes in Europe (SENTRY Antimicrobial Surveillance Program, 1997–2016).
Antimicrobial susceptibility of the most frequently isolated organisms from patients hospitalized with pneumonia in 2015–16 stratified by geographical region
| Organism/organism group and antimicrobial agent | MIC50 (mg/L) | MIC90 (mg/L) | Percentage susceptible per CLSIa (no. tested) | ||||
|---|---|---|---|---|---|---|---|
| NA | EUR | APAC | LATAM | all regions | |||
| S. aureus | (3412) | (897) | (193) | (89) | (4591) | ||
| oxacillin | 0.5 | >2 | 56.0 | 73.6 | 60.6 | 65.2 | 59.8 |
| ceftaroline | 0.25 | 1 | 97.3 | 95.9 | 86.5 | 91.0 | 96.5 |
| clindamycin | ≤0.25 | >2 | 79.5 | 92.9 | 77.7 | 84.3 | 82.1 |
| dalbavancin | 0.03 | 0.03 | 100.0 | 100.0 | 100.0 | 100.0 | 100.0 |
| doxycycline | ≤0.06 | 0.25 | 99.1 | 98.9 | 85.5 | 100.0 | 98.5 |
| erythromycin | 2 | >8 | 40.1 | 67.6 | 65.8 | 57.3 | 46.9 |
| levofloxacin | 0.25 | >4 | 58.4 | 75.0 | 71.0 | 82.0 | 62.6 |
| linezolid | 1 | 1 | 99.9 | 99.9 | 100.0 | 100.0 | 99.9 |
| minocycline | ≤0.06 | 0.12 | 98.9 | 99.4 | 86.5 | 100.0 | 98.5 |
| oritavancin | 0.015 | 0.03 | 99.9 | 99.9 | 100.0 | 100.0 | 99.9 |
| telavancin | 0.03 | 0.06 | 100.0 | 100.0 | 100.0 | 100.0 | 100.0 |
| tetracycline | ≤0.5 | ≤0.5 | 95.7 | 94.9 | 77.7 | 93.3 | 94.8 |
| tigecycline | 0.06 | 0.12 | 100.0b | 100.0b | 100.0b | 100.0b | 100.0b |
| trimethoprim/sulfamethoxazole | ≤0.5 | ≤0.5 | 98.3 | 99.9 | 95.3 | 95.5 | 98.4 |
| vancomycin | 0.5 | 1 | 100.0 | 100.0 | 100.0 | 100.0 | 100.0 |
| P. aeruginosa | (2580) | (1313) | (355) | (149) | (4397) | ||
| amikacin | 4 | 16 | 94.5 | 84.0 | 94.6 | 89.9 | 91.2 |
| cefepime | 4 | 16 | 83.1 | 75.7 | 87.0 | 85.9 | 81.3 |
| ceftazidime | 2 | 32 | 82.2 | 72.4 | 84.2 | 85.9 | 79.6 |
| ciprofloxacin | 0.25 | >4 | 76.0 | 69.1 | 85.1 | 82.6 | 74.9 |
| colistin | 1 | 1 | 99.6 | 99.8 | 99.7 | 100.0 | 99.7 |
| doripenem | 0.5 | >4 | 78.4 | 67.0 | 82.3 | 74.5 | 75.2 |
| gentamicin | 2 | >8 | 81.8 | 73.6 | 91.0 | 83.9 | 80.2 |
| imipenem | 1 | >8 | 75.5 | 64.1 | 77.2 | 71.8 | 72.1 |
| levofloxacin | 0.5 | >4 | 71.5 | 66.6 | 83.4 | 81.2 | 71.3 |
| meropenem | 0.5 | 16 | 77.3 | 66.3 | 80.3 | 75.2 | 74.2 |
| piperacillin/tazobactam | 4 | >64 | 77.4 | 67.8 | 83.1 | 83.8 | 75.2 |
| tobramycin | 0.5 | >8 | 91.2 | 79.1 | 94.6 | 83.9 | 87.6 |
| Klebsiella spp. | (1177) | (795) | (279) | (112) | (2363) | ||
| amikacin | 1 | 4 | 97.2 | 90.6 | 99.3 | 91.1 | 94.9 |
| ampicillin/sulbactam | 8 | >32 | 61.5 | 42.1 | 63.8 | 48.2 | 54.6 |
| cefepime | ≤0.12 | >16 | 83.9 | 61.8 | 76.3 | 58.6 | 74.4 |
| ceftazidime | 0.25 | >32 | 83.3 | 63.0 | 77.4 | 59.8 | 74.7 |
| ceftriaxone | ≤0.06 | >8 | 81.6 | 58.6 | 74.9 | 57.1 | 71.9 |
| ciprofloxacin | ≤0.03 | >4 | 85.4 | 61.5 | 78.4 | 62.5 | 75.4 |
| colistin | 0.12 | 0.25 | 98.1c | 92.8c | 97.8c | 91.9c | 96.0c |
| doripenem | ≤0.06 | 1 | 93.8 | 85.4 | 94.3 | 83.9 | 90.6 |
| gentamicin | 0.25 | >8 | 89.7 | 75.8 | 88.2 | 70.5 | 84.0 |
| imipenem | ≤0.12 | 1 | 93.7 | 85.9 | 95.0 | 84.8 | 90.8 |
| levofloxacin | 0.06 | >4 | 89.0 | 68.3 | 83.2 | 73.0 | 80.6 |
| meropenem | 0.03 | 1 | 93.5 | 85.8 | 93.9 | 82.1 | 90.4 |
| piperacillin/tazobactam | 4 | >64 | 85.9 | 66.9 | 83.9 | 77.7 | 78.9 |
| tigecycline | 0.25 | 1 | 98.4 | 99.0 | 99.6 | 100.0 | 98.8 |
| tobramycin | 0.25 | >8 | 86.6 | 65.0 | 85.7 | 66.1 | 78.3 |
| trimethoprim/sulfamethoxazole | ≤0.5 | >4 | 82.5 | 64.9 | 76.0 | 59.8 | 74.7 |
| E. coli | (737) | (566) | (103) | (22) | (1428) | ||
| amikacin | 2 | 8 | 99.5 | 99.1 | 100.0 | 100.0 | 99.4 |
| ampicillin/sulbactam | 16 | >32 | 39.8 | 35.7 | 31.1 | 27.3 | 37.4 |
| cefepime | ≤0.12 | >16 | 78.4 | 76.8 | 77.7 | 54.5 | 77.4 |
| ceftazidime | 0.25 | 32 | 79.1 | 83.6 | 83.5 | 63.6 | 81.0 |
| ceftriaxone | ≤0.06 | >8 | 74.4 | 75.3 | 75.7 | 54.5 | 74.5 |
| ciprofloxacin | 0.06 | >4 | 57.3 | 65.3 | 71.8 | 54.5 | 61.5 |
| colistin | 0.12 | 0.25 | 99.9c | 98.9c | 100.0c | 100.0c | 99.5c |
| doripenem | ≤0.06 | ≤0.06 | 99.3 | 99.5 | 99.0 | 100.0 | 99.4 |
| gentamicin | 0.5 | >8 | 83.9 | 86.9 | 75.7 | 77.3 | 84.4 |
| imipenem | ≤0.12 | ≤0.12 | 99.5 | 99.1 | 99.0 | 100.0 | 99.3 |
| levofloxacin | 0.06 | >4 | 57.3 | 65.9 | 72.8 | 54.5 | 61.8 |
| meropenem | ≤0.015 | 0.03 | 99.3 | 99.5 | 99.0 | 100.0 | 99.4 |
| piperacillin/tazobactam | 2 | 32 | 90.8 | 85.7 | 97.1 | 95.5 | 89.3 |
| tigecycline | 0.12 | 0.25 | 100.0 | 100.0 | 100.0 | 100.0 | 100.0 |
| tobramycin | 1 | >8 | 81.8 | 83.0 | 82.5 | 63.6 | 82.1 |
| trimethoprim/sulfamethoxazole | ≤0.5 | >4 | 62.7 | 62.2 | 52.4 | 36.4 | 61.3 |
| Enterobacter spp. | (705) | (373) | (94) | (24) | (1196) | ||
| amikacin | 1 | 2 | 99.9 | 98.4 | 100.0 | 95.8 | 99.3 |
| ampicillin/sulbactam | 32 | >32 | 15.4 | 13.9 | 13.8 | 20.8 | 14.9 |
| cefepime | ≤0.12 | 2 | 91.8 | 87.7 | 95.7 | 83.3 | 90.6 |
| ceftazidime | 0.25 | >32 | 72.2 | 70.0 | 79.8 | 83.3 | 72.3 |
| ceftriaxone | 0.25 | >8 | 67.5 | 65.5 | 78.7 | 79.2 | 68.0 |
| ciprofloxacin | ≤0.03 | 0.5 | 93.8 | 90.6 | 94.7 | 95.8 | 92.9 |
| colistin | ≤0.5 | >8 | 84.9c | 88.9c | 75.5c | 87.5c | 85.5c |
| doripenem | ≤0.06 | 0.12 | 97.4 | 98.9 | 98.9 | 95.8 | 98.0 |
| gentamicin | 0.25 | 0.5 | 95.9 | 90.3 | 95.7 | 95.8 | 94.1 |
| imipenem | 0.25 | 1 | 96.6 | 98.4 | 96.8 | 95.8 | 97.2 |
| levofloxacin | ≤0.03 | 0.5 | 94.9 | 93.0 | 96.8 | 95.8 | 94.5 |
| meropenem | 0.03 | 0.06 | 97.7 | 98.9 | 98.9 | 95.8 | 98.2 |
| piperacillin/tazobactam | 2 | 64 | 79.4 | 79.9 | 85.1 | 83.3 | 80.1 |
| tigecycline | 0.25 | 0.5 | 99.1 | 99.7 | 100.0 | 100.0 | 99.4 |
| tobramycin | 0.5 | 1 | 95.7 | 89.8 | 95.7 | 87.5 | 93.7 |
| trimethoprim/sulfamethoxazole | ≤0.5 | 1 | 92.5 | 85.8 | 93.6 | 95.8 | 90.5 |
| Acinetobacter spp. | (368) | (446) | (151) | (60) | (1025) | ||
| amikacin | >32 | >32 | 76.6 | 19.5 | 31.1 | 30.0 | 42.3 |
| ampicillin/sulbactam | 32 | >32 | 61.6 | 16.4 | 19.2 | 16.7 | 33.0 |
| ceftazidime | >32 | >32 | 51.4 | 13.0 | 19.2 | 18.3 | 28.0 |
| ciprofloxacin | >4 | >4 | 49.2 | 11.5 | 16.6 | 15.0 | 26.0 |
| colistin | ≤0.5 | 8 | 90.5 | 83.7 | 89.4 | 96.7 | 87.8 |
| doripenem | >4 | >4 | 56.2 | 16.6 | 21.2 | 15.0 | 31.4 |
| gentamicin | >8 | >8 | 61.4 | 21.5 | 27.2 | 31.7 | 37.3 |
| imipenem | >8 | >8 | 58.4 | 17.5 | 21.9 | 15.0 | 32.7 |
| levofloxacin | >4 | >4 | 52.2 | 12.8 | 20.5 | 15.0 | 28.2 |
| meropenem | 32 | >32 | 56.2 | 17.0 | 21.2 | 15.0 | 31.6 |
| minocycline | 1 | >8 | 85.1 | 60.3 | 75.5 | 81.7 | 72.7 |
| piperacillin/tazobactam | >64 | >64 | 45.6 | 11.0 | 14.6 | 8.5 | 23.8 |
| tigecycline | 2 | 4 | 79.6d | 76.7d | 74.2d | 78.3d | 77.5d |
| tobramycin | 8 | >8 | 74.4 | 32.7 | 31.8 | 48.3 | 48.4 |
| S. maltophilia | (553) | (253) | (41) | (15) | (862) | ||
| ceftazidime | >32 | >32 | 21.9 | 19.4 | 19.5 | 13.3 | 20.9 |
| levofloxacin | 1 | >4 | 76.5 | 83.4 | 90.2 | 100.0 | 79.6 |
| minocycline | 0.5 | 1 | 99.8 | 100.0 | 100.0 | 100.0 | 99.9 |
| tigecycline | 1 | 2 | 91.1d | 91.7d | 90.2d | 100.0d | 91.4d |
| trimethoprim/sulfamethoxazole | ≤0.5 | 1 | 93.7 | 95.7 | 92.7 | 93.3 | 94.2 |
| H. influenzae | (304) | (129) | (60) | (0) | (493) | ||
| amoxicillin/clavulanic acid | 0.5 | 2 | 99.0 | 98.4 | 80.0 | 96.6 | |
| azithromycin | 0.5 | 1 | 99.0 | 99.2 | 96.7 | 98.8 | |
| ceftaroline | 0.008 | 0.03 | 99.7 | 100.0 | 93.3 | 99.0 | |
| ceftriaxone | ≤0.015 | ≤0.015 | 100.0 | 100.0 | 100.0 | 100.0 | |
| ciprofloxacin | 0.015 | 0.015 | 99.3 | 99.2 | 96.7 | 99.0 | |
| clarithromycin | 8 | 16 | 85.5 | 95.3 | 85.0 | 88.0 | |
| imipenem | 0.5 | 2 | 98.7 | 99.2 | 95.0 | 98.4 | |
| levofloxacin | ≤0.015 | 0.03 | 99.3 | 100.0 | 96.7 | 99.2 | |
| meropenem | 0.06 | 0.25 | 100.0 | 100.0 | 98.3 | 99.8 | |
| piperacillin/tazobactam | ≤0.015 | 0.06 | 100.0 | 100.0 | 100.0 | 100.0 | |
| tetracycline | 0.5 | 1 | 98.7 | 99.2 | 91.7 | 98.0 | |
| tigecycline | 0.12 | 0.25 | 97.4b | 98.4b | 90.0b | 96.8b | |
| trimethoprim/sulfamethoxazole | 0.12 | >4 | 63.5 | 69.0 | 71.7 | 65.9 | |
| S. pneumoniae | (212) | (55) | (50) | (0) | (317) | ||
| amoxicillin/clavulanic acid | ≤0.03 | 2 | 93.4 | 90.9 | 96.0 | 93.4 | |
| azithromycin | 0.06 | >4 | 62.7 | 69.1 | 63.3 | 63.9 | |
| ceftaroline | ≤0.008 | 0.12 | 100.0 | 100.0 | 100.0 | 100.0 | |
| ceftriaxone | 0.03 | 1 | 97.6e | 92.7e | 94.0e | 96.2e | |
| erythromycin | 0.03 | >2 | 61.8 | 69.1 | 64.0 | 63.4 | |
| levofloxacin | 1 | 1 | 98.1 | 96.4 | 96.0 | 97.5 | |
| linezolid | 1 | 1 | 100.0 | 100.0 | 100.0 | 100.0 | |
| meropenem | 0.015 | 0.5 | 84.6 | 79.2 | 63.6 | 82.4 | |
| penicillin | ≤0.06 | 1 | 95.8f | 90.9f | 96.0f | 95.0f | |
| tigecycline | 0.03 | 0.06 | 100.0b | 100.0b | 98.0b | 99.7b | |
| trimethoprim/sulfamethoxazole | ≤0.5 | 4 | 74.5 | 80.0 | 66.0 | 74.1 | |
NA, North America; EUR, Europe; APAC, Asia-Pacific region; LATAM, Latin America.
Criteria as published by CLSI (2018).11
Breakpoints from the FDA Package Insert.31
Based on the EUCAST breakpoint and the CLSI epidemiological cut-off value of ≤2 mg/L.
Percentage of isolates inhibited at a tigecycline MIC of ≤2 mg/L, which is the CLSI susceptibility breakpoint for Enterobacteriaceae.
Using non-meningitis breakpoints.
Using parenteral, non-meningitis breakpoints.
P. aeruginosa susceptibility to meropenem decreased overall in the initial years of the programme to a low of 72.9% in North America in 2007–08 (Figure 4), 61.1% in Europe in 2009–10 (Figure 5), 69.4% in APAC in 2009–10 (data not shown) and 51.6% in Latin America in 2011–12 (data not shown), but increased in the last years of the investigation. In the 2015–16 period, meropenem susceptibility varied; it was 66.3% in Europe, 75.2% in Latin America, 77.3% in North America and 80.3% in APAC (Table 1). When comparing susceptibility rates in the 2015–16 period among the four geographical regions, Europe had the lowest such rates for ceftazidime (72.4% versus 82.2%–85.9%), piperacillin/tazobactam (67.8% versus 77.4%–83.8%), tobramycin (79.1% versus 83.9%–94.6%) and levofloxacin (66.6% versus 71.5%–83.4%) (Table 1).
Among Klebsiella spp., susceptibility to ceftriaxone decreased during the study period from 91.8% to 81.6% in North America, from 85.9% to 58.6% in Europe, from 67.1% to 57.1% in Latin America and from 80.7% to 74.9% in APAC, and susceptibility to meropenem decreased from 99.5% to 93.5% in North America (Figure 4), from 99.3% to 85.9% in Europe (Figure 5), from 98.6% to 83.6% in Latin America (data not shown) and from 100.0% to 93.9% in APAC (data not shown). Susceptibility rates (per CLSI) for meropenem in the 2015–16 period were substantially lower in Europe (85.8%) and Latin America (82.1%) when compared with North America (93.5%) and APAC (93.9%; 90.4% for all regions combined) (Table 1).
Susceptibility to ceftriaxone among E. coli decreased continuously from 1997–98 to 2015–16 in all regions: 95.1% to 74.4% in North America (Figure 4), 94.4% to 75.3% in Europe (Figure 5), 91.1% to 75.7% in APAC (data not shown) and 78.9% to 54.5% in Latin America (data not shown). Susceptibility rates (per CLSI) for ceftriaxone in the 2015–16 period were substantially lower in Latin America (54.5%) when compared with the other geographical regions (74.4%–75.7%), and meropenem retained activity against ≥99.0% of isolates in all geographical regions (Table 1).
Susceptibility to ceftazidime among Enterobacter spp. varied in North America from a low of 67.4% in 2003–04 to a high of 77.4% in 2013–14 with no trend during the investigation period (71.1% in 1997–98 and 72.2% in 2015–16), and in Europe from a low of 59.6% in 2005–06 to highs of 70.2% in 1997–98 and 70.0% in 2015–16. Interestingly, susceptibility to ceftazidime among Enterobacter spp. increased progressively in Latin America from 57.7% in 1997–98 to 83.3% in 2015–16 (data not shown). In the 2015–16 period, susceptibility rates for cefepime were lowest in Latin America (83.3%), followed by Europe (87.7%), North America (91.8%) and APAC (95.7%), and meropenem was active against 98.2% of isolates from all regions combined (Table 1).
Among Enterobacteriaceae isolates collected in 2015–16, susceptibility rates were generally lower in Latin America compared with the other geographical regions; the highest susceptibility rates were observed in either North America or APAC (Table 2). Meropenem was active against 95.9% of Enterobacteriaceae from all regions combined in 2015–16, with susceptibility rates ranging from 90.0% in Latin America to 96.8% in North America (Table 2). Frequencies of MDR Enterobacteriaceae and CRE increased continuously from 1999–2000 to 2015–16 in Europe and North America, whereas the frequency of MDR P. aeruginosa oscillated during the SENTRY surveillance period and ended with frequencies in 2015–16 similar to those in 1999–2000 in both regions (Figure 6). The most active agents tested against MDR Enterobacteriaceae were tigecycline [88.8%–98.6% susceptible; 92.6% overall (per US FDA)], amikacin [75.4%–97.3% susceptible; 85.8% overall (per CLSI)] and the carbapenems doripenem and meropenem (63.2%–76.6% susceptible; 74.7% overall) (Table 2).
Frequency of MDR P. aeruginosa, MDR Enterobacteriaceae and CRE in Europe and North America over time (SENTRY Antimicrobial Surveillance Program, 1999–2016).
Antimicrobial susceptibility of Enterobacteriaceae and resistant subsets collected in 2015–16 from patients hospitalized with pneumonia stratified by geographical region
| Organism/organism group and antimicrobial agent | MIC50 (mg/L) | MIC90 (mg/L) | Percentage susceptible per CLSIa (no. tested) | ||||
|---|---|---|---|---|---|---|---|
| NA | EUR | APAC | LATAM | all regions | |||
| Enterobacteriaceae | (3524) | (2343) | (596) | (210) | (6646) | ||
| amikacin | 2 | 4 | 98.7 | 95.9 | 99.6 | 92.9 | 97.6 |
| ampicillin/sulbactam | 16 | >32 | 40.2 | 33.8 | 43.1 | 37.6 | 38.1 |
| cefepime | ≤0.12 | >16 | 87.1 | 78.5 | 82.8 | 68.4 | 83.1 |
| ceftazidime | 0.25 | >32 | 82.5 | 76.8 | 81.2 | 71.4 | 80.0 |
| ceftriaxone | 0.12 | >8 | 77.4 | 70.3 | 77.9 | 66.7 | 74.6 |
| ciprofloxacin | ≤0.03 | >4 | 80.5 | 74.4 | 82.5 | 71.9 | 78.3 |
| colistin | ≤0.5 | >8 | 76.2b | 75.5b | 82.3b | 71.3b | 76.4b |
| doripenem | ≤0.06 | 0.25 | 96.8 | 94.6 | 96.8 | 91.0 | 95.8 |
| gentamicin | 0.5 | >8 | 90.3 | 85.5 | 88.6 | 75.7 | 88.0 |
| imipenem | ≤0.12 | 1 | 92.5 | 88.9 | 94.7 | 82.9 | 91.1 |
| levofloxacin | 0.06 | >4 | 82.5 | 78.1 | 85.7 | 78.9 | 81.1 |
| meropenem | 0.03 | 0.06 | 96.8 | 94.8 | 96.7 | 90.0 | 95.9 |
| piperacillin/tazobactam | 2 | 64 | 87.6 | 80.3 | 88.6 | 85.7 | 85.1 |
| tigecycline | 0.25 | 1 | 97.3c | 98.1c | 99.5c | 97.6c | 97.8c |
| tobramycin | 0.5 | >8 | 88.7 | 80.8 | 88.2 | 72.4 | 85.4 |
| trimethoprim/sulfamethoxazole | ≤0.5 | >4 | 81.4 | 73.4 | 77.3 | 65.7 | 77.7 |
| MDR Enterobacteriaceae | (465) | (478) | (73) | (57) | (1073) | ||
| amikacin | 4 | 32 | 90.8 | 80.5 | 97.3 | 75.4 | 85.8 |
| cefepime | >16 | >16 | 30.3 | 17.6 | 12.3 | 3.6 | 22.0 |
| ceftazidime | >32 | >32 | 26.2 | 19.2 | 11.0 | 10.5 | 21.2 |
| ceftriaxone | >8 | >8 | 13.8 | 8.0 | 2.7 | 1.8 | 9.8 |
| colistin | ≤0.5 | >8 | 63.1b | 74.2b | 82.2b | 70.2b | 69.7b |
| doripenem | 0.12 | >8 | 76.6 | 73.6 | 75.3 | 66.7 | 74.7 |
| gentamicin | >8 | >8 | 45.4 | 40.0 | 49.3 | 38.6 | 42.9 |
| levofloxacin | >8 | >8 | 25.8 | 22.8 | 26.4 | 33.9 | 24.9 |
| meropenem | 0.06 | 16 | 76.6 | 74.5 | 74.0 | 63.2 | 74.7 |
| piperacillin/tazobactam | 32 | >64 | 48.7 | 32.4 | 34.7 | 49.1 | 40.5 |
| tigecycline | 0.5 | 2 | 88.8c | 95.0c | 98.6c | 96.5c | 92.6c |
| tobramycin | >8 | >8 | 33.1 | 17.8 | 35.6 | 12.3 | 25.3 |
| CRE | (108) | (117) | (17) | (18) | (260) | ||
| amikacin | 16 | >32 | 71.0 | 48.7 | 94.1 | 55.6 | 61.4 |
| cefepime | >16 | >16 | 7.5 | 4.3 | 0.0 | 0.0 | 5.0 |
| ceftazidime | >32 | >32 | 3.7 | 5.1 | 0.0 | 0.0 | 3.9 |
| ceftriaxone | >8 | >8 | 1.9 | 1.7 | 0.0 | 0.0 | 1.5 |
| colistin | 0.25 | >8 | 78.5b | 68.8b | 93.8b | 50.0b | 74.9b |
| doripenem | 8 | >8 | 5.6 | 0.9 | 0.0 | 0.0 | 2.7 |
| gentamicin | 8 | >8 | 46.7 | 47.0 | 70.6 | 44.4 | 48.3 |
| levofloxacin | >4 | >4 | 26.9 | 9.4 | 17.6 | 11.1 | 17.3 |
| meropenem | 16 | >32 | 3.7 | 2.6 | 0.0 | 0.0 | 2.7 |
| piperacillin/tazobactam | >64 | >64 | 2.8 | 1.7 | 0.0 | 0.0 | 1.9 |
| tigecycline | 0.5 | 2 | 99.1c | 99.1c | 100.0c | 100.0c | 99.2c |
| tobramycin | >8 | >8 | 15.9 | 10.3 | 29.4 | 27.8 | 15.1 |
Susceptibility rates among CRE isolates varied drastically among geographical regions, and the most active agents were tigecycline [99.1%–100.0% susceptible; 99.2% overall (per US FDA)], colistin [50.0%–93.8% susceptible; 74.9% overall (per EUCAST)] and amikacin [48.7%–94.1% susceptible; 61.4% overall (per CLSI)] (Table 2).
Acinetobacter spp. ranked sixth overall (5.3%), fourth in APAC (10.2%) and Latin America (11.2%), fifth in Europe (7.9%) (Figure 3) and eighth in North America (3.2%), and exhibited high rates of resistance to all antimicrobial agents in 2015–16 (Table 1 and Figure 1). Acinetobacter spp. susceptibility decreased drastically to all antimicrobial agents in all geographical regions during the 20 years of this investigation. The most substantial decrease was observed in carbapenem susceptibility rates. When comparing data from 1997–98 with 2015–16, susceptibility to meropenem decreased from 79.1% to 31.6% for all regions combined, from 66.7% to 17.0% in Europe (Figure 5), from 86.4% to 21.2% in APAC and from 72.7% to 15.0% in Latin America. In North America, meropenem susceptibility decreased from a high of 89.3% in 1999–2000 to a low of 28.6% in 2009–10 before increasing to 56.2% in 2015–16 (Figure 4).
Colistin was the most active agent against Acinetobacter spp. in these latter years with 87.8% susceptibility overall (ranging from 83.7% in Europe to 96.7% in Latin America), followed by minocycline with 72.7% overall susceptibility per CLSI (ranging from 60.3% in Europe to 85.1% in North America) and tigecycline with 43.2% and 77.5% of all isolates inhibited at ≤1 and ≤2 mg/L, respectively (Table 1). Tobramycin and meropenem were active against 48.4% and 31.6% of all isolates collected in 2015–16, respectively, with higher susceptibility rates in North America (74.4% and 56.2%, respectively) compared with the other geographical regions (31.8%–48.3% and 15.0%–21.2%, respectively) (Table 1).
S. maltophilia ranked seventh overall in 2015–16, with susceptibility rates to trimethoprim/sulfamethoxazole ranging from 92.7% in APAC to 95.7% in Europe in those years (94.2% overall) (Table 1). Among Haemophilus influenzae isolates collected in 2015–16, β-lactamase production rates varied from 15.5% in Europe to 31.3% in North America and 41.7% in APAC (no isolates were collected from Latin America) and all isolates were susceptible to ceftriaxone and piperacillin/tazobactam (Table 1).
S. pneumoniae susceptibility rates to most agents oscillated during the 20 year period of this investigation, but were not very different during the last years compared with the initial years. Susceptibility to penicillin and ceftriaxone improved in the first few years of the programme, followed by a decline in the middle years and another improvement in the last few years of this investigation. The ceftriaxone susceptibility rate across the regions was highest in 2003–04 at 99.1%, decreased to 82.4% in 2007–08 and gradually increased to 96.2% in 2015–16 (data not shown). In North America, ceftriaxone susceptibility went from 93.7% in 2001–02 to 100.0% in 2003–04, decreased to 90.6% in 2011–12 and increased to 97.7% in 2015–16.
Discussion
The frequency and antimicrobial susceptibility of organisms isolated from patients hospitalized with pneumonia varied considerably by geographical region and over time. Interestingly, the proportion of Gram-negative pathogens increased in Europe, APAC and Latin America during the investigation period and was higher in these regions compared with North America, where the proportion of Gram-negative pathogens remained stable. S. aureus, P. aeruginosa and Klebsiella spp. represented the three most common organisms in North America, Europe and APAC for all years combined and in all four regions during 2015–16. However, the frequency of S. aureus was higher in North America (30.2% overall and 29.3% in 2015–16) compared with the other regions (16.3%–19.8% overall and 12.9%–16.6% in 2015–16). The frequencies of organisms isolated from patients hospitalized with pneumonia reported here for North America and Europe are similar to those reported by other investigators, with a higher prevalence of S. aureus in North America compared with Europe and a higher prevalence of P. aeruginosa, Enterobacteriaceae and Acinetobacter spp. in Europe compared with North America.5,6,15,16
Increasing frequency of Gram-negative organisms was accompanied by increasing resistance to key antimicrobial agents among these organisms, whereas resistance among S. aureus and S. pneumoniae remained stable or decreased in the latter years of the investigation. Similar trends have been reported by other investigators. Increasing resistance among Gram-negative organisms caused initially by the widespread emergence of ESBL enzymes has been reported worldwide in the last few decades,17–19 which was followed by the spread of carbapenemases.10,20,21 The serine carbapenemase KPC has disseminated worldwide, causing an increase in carbapenem resistance in many geographical regions.21 Other carbapenemases, such as class B MBLs (e.g. IMP, VIM, SPM and NDM) and class D carbapenemases (e.g. OXA-23, OXA-24 and OXA-48), became prevalent in some geographical regions, such as some eastern European and Asian countries, but were practically absent in others, such as the USA.22,23 Moreover, susceptibility to carbapenems and other β-lactam compounds may vary considerably among countries in the same geographical region based on the occurrence of these β-lactamases.
In contrast to Gram-negative organisms, antimicrobial susceptibility among S. aureus and S. pneumoniae remained stable or improved in some regions in the latter years of this investigation.24,25 A large amount of evidence has suggested that the numbers of MRSA infections has been decreasing simultaneously in distinct parts of the world in the last few years.26,27 Although these decreases have been attributed mainly to infection control strategies, the definitive cause has not been determined. A larger ecological trend related mostly to factors outside hospitals is also possible.28 Regarding S. pneumoniae, temporal and regional differences in susceptibility rates are probably due to multiple factors, including clonal epidemiology of this organism in the region, antimicrobial usage and PCV (pneumococcal conjugate vaccine) immunization practices, among others.29,30
It is important to note that during the 20 year period of the SENTRY Antimicrobial Surveillance Program evaluated here, some medical centres, or some countries, did not participate every year and that may have introduced bias in the data analysis. Results from India were excluded from the analysis to avoid this type of bias, but some medical centres and/or countries that did not participate during the entire period may have caused slight skewing in the data analysis. Other limitations of this investigation include the lack of differentiation between community-acquired bacterial pneumonia that needs hospitalization and health care-associated pneumonia, and the criteria used to categorize a bacterial isolate as ‘clinically significant’ were not defined in the study protocol, but were based on local infectious disease algorithms, which may vary among participating medical centres. Despite the study limitations, the results presented here provide valuable information about the frequency and antimicrobial susceptibility trends of organisms isolated from patients hospitalized with pneumonia worldwide from 1997 through 2016.
Acknowledgements
We thank all participants of the SENTRY Antimicrobial Surveillance Program for their work in providing isolates.
Funding
Funding for the manuscript was provided by JMI Laboratories.
Transparency declarations
JMI Laboratories was contracted to perform services in 2017 and 2018 for Achaogen, Actelion, Allecra Therapeutics, AmpliPhi Biosciences, API, Astellas Pharma, AstraZeneca, Basilea Pharmaceutica, Bayer AG, BD, Biomodels, Cardeas Pharma Corp., CEM-102 Pharma, Cempra, Cidara Therapeutics, Inc., CorMedix, CSA Biotech, Cutanea Life Sciences, Inc., Debiopharm Group, Dipexium Pharmaceuticals, Inc., Entasis Therapeutics, Inc., Fortress Biotech, Fox Chase Chemical Diversity Centre, Inc., Geom Therapeutics, Inc., GSK, Laboratory Specialists, Inc., Medpace, Melinta Therapeutics, Inc., Merck & Co., Inc., Micromyx, MicuRx Pharmaceuticals, Inc., Motif Bio, N8 Medical, Inc., Nabriva Therapeutics, Inc., Nexcida Therapeutics, Inc., Novartis, Paratek Pharmaceuticals, Inc., Pfizer, Polyphor, Rempex, Scynexis, Shionogi, Spero Therapeutics, Symbal Therapeutics, Synlogic, TenNor Therapeutics, TGV Therapeutics, The Medicines Company, Theravance Biopharma, ThermoFisher Scientific, VenatoRx Pharmaceuticals, Inc., Wockhardt and Zavante Therapeutics, Inc. There are no speakers’ bureaus or stock options to declare.
References
CDC. Antibiotic Resistance Threats in the United States,
Clinical and Laboratory Standards Institute.
Clinical and Laboratory Standards Institute.
EUCAST. Breakpoint Tables for Interpretation of MICs and Zone Diameters, Version 8.0, January 2018. http://www.eucast.org/fileadmin/src/media/PDFs/EUCAST_files/Breakpoint_tables/v_8.0_Breakpoint_Tables.pdf.
Pfizer. Tygacil® Package Insert. http://labeling.pfizer.com/ShowLabeling.aspx? id=491.
