


Abstract
MDR-TB and XDR-TB have poor outcomes.
To examine the efficacy of tigecycline monotherapy in the hollow fibre system model of TB.
We performed pharmacokinetic/pharmacodynamic studies using tigecycline human-like concentration–time profiles in the hollow fibre system model of TB in five separate experiments using Mycobacterium tuberculosis in log-phase growth or as semi-dormant or intracellular bacilli, as monotherapy. We also compared efficacy with the isoniazid/rifampicin/pyrazinamide combination (standard therapy). We then applied extinction mathematics, morphisms and Latin hypercube sampling to identify duration of therapy with tigecycline monotherapy.
The median tigecycline MIC for 30 M. tuberculosis clinical and laboratory isolates (67% MDR/XDR) was 2 mg/L. Tigecycline monotherapy was highly effective in killing M. tuberculosis in log-phase-growth and semi-dormant and intracellular M. tuberculosis. Once-a-week dosing had the same efficacy as daily therapy for the same cumulative dose; thus, tigecycline efficacy was linked to the AUC0–24/MIC ratio. Tigecycline replacement by daily minocycline after 4 weeks of therapy was effective in sterilizing bacilli. The AUC0–24/MIC ratio associated with optimal kill was 42.3. Tigecycline monotherapy had a maximum sterilizing effect (day 0 minus day 28) of 3.06 ± 0.20 log10 cfu/mL (r2 = 0.92) compared with 3.92 ± 0.45 log10 cfu/mL (r2 = 0.80) with optimized standard therapy. In our modelling, at a tigecycline monotherapy duration of 12 months, the proportion of patients with XDR-TB who reached bacterial population extinction was 64.51%.
Tigecycline could cure patients with XDR-TB or MDR-TB who have failed recommended therapy. Once-a-week tigecycline could also replace second-line injectables in MDR-TB regimens.
Introduction
The advent of MDR-TB and XDR-TB has necessitated the re-use of aminoglycosides.1–3 Starting with streptomycin in 1943, aminoglycosides have been used to treat TB and are currently used in some of the WHO-approved MDR-TB regimens, although there is a desire to move away from them.4,5 A recent meta-analysis of 12030 patients with MDR-TB demonstrated that compared with regimens without any injectable drug, amikacin provided modest benefits, but kanamycin and capreomycin were associated with worse outcomes.6 In addition, the incidence of deafness is as high as 70%; the deafness is permanent and progressive and particularly devastating in children at language and social skill acquisition stage.7–9 Moreover, there are increasing numbers of patients for whom no antibiotic works, making these patients therapeutically destitute.1–3 There is therefore an urgent need to quickly find new antibiotics that could be effective against TB. We recently instituted a programme in which we intend to examine every antibiotic pharmacophore for anti-TB effect and have identified ceftazidime/avibactam, benzylpenicillin and minocycline, among others, as effective anti-TB drugs.10–14
Tigecycline is a minocycline derivative with an N,N-dimethylglycylamido side chain added to position 9.15,16 Tigecycline was designed to be more resistant to tetracycline efflux pumps and ribosomal protection, which are problems with first- and second-generation tetracyclines such as minocycline.17–19 We have found that minocycline itself is effective against Mycobacterium tuberculosis (Mtb).14 Recently, we examined tigecycline efficacy in the treatment of pulmonary Mycobacterium abscessus in the hollow fibre system model and found that the drug is efficacious.20 Therefore, we also sought to test it for tigecycline effect on Mtb in the in vitro hollow fibre system model of TB (HFS-TB). Tigecycline has a long half-life and penetrated with a lung tissue-to-serum ratio of 2.0 based on AUC ratios in one study, while the ratio of AUC epithelial lining fluid-to-serum concentration was 1.3 and the alveolar cell-to-serum ratio was 77.5 in another study.21–23 However, the penetration into TB cavities is still unknown. Nevertheless, the high lung penetration could be harnessed for treatment of pulmonary TB. To test whether tigecycline had a bactericidal and sterilizing effect on Mtb, we conducted studies in the HFS-TB, a drug development tool with a forecasting accuracy of 94% for clinical TB outcomes.24,25
Materials and methods
Bacterial strains and culture conditions
Five laboratory Mtb strains were used in the experiments: H37Ra (ATCC 25177), H37Rv (ATCC 27294), CDC 1551, HN878 and Mtb 18b (donated by Professor Stewart Cole). For MIC determination experiments we also used 25 clinical strains from TB patients collected by the Medical Research Council of South Africa. For all experiments, Mtb stock was thawed and then grown to log phase for 4 days in Middlebrook 7H9 broth plus 10% OADC.
Materials and drugs
Tigecycline was purchased from Baylor University Medical Center pharmacy (Dallas, TX, USA). Rifampicin, isoniazid and pyrazinamide were purchased from Sigma. Hollow fibre cartridges were obtained from FiberCell (Fredrick, MD, USA). BACTEC MGIT 960 Mycobacterial Growth Indicator Tube (MGIT) system and tubes were purchased from Becton Dickinson (Franklin Lakes, NJ, USA).
Determination of activity and MIC
First, tigecycline stability was confirmed in an experiment that measured tigecycline concentrations in test tubes containing 0.25, 1 and 16 mg/L tigecycline stored at 37°C daily over 72 h using assays described in the Supplementary Methods (available as Supplementary data at JAC Online). Next, human-derived THP-1 cells (ATCC TIB-202) grown in RPMI 1640 with 10% FBS were infected with H37Ra for intracellular experiments in 12-well plates and for the HFS-TB, using methods described previously.14,26–28 The washed cells were then co-incubated with different tigecycline concentrations for 7 days as described previously, after which bacterial burden was identified by cfu counts on agar.14,26–28 A similar study was performed with extracellular Mtb H37Ra in test tubes under slow shaking conditions.
Tigecycline MIC for the laboratory Mtb strains was determined using a broth macrodilution method as well as the MGIT system with BD EpiCenter Plus, on two separate occasions.14,26–28 Next, 25 clinical isolates had MICs identified using the MGIT assay. The concentrations of tigecycline examined, in duplicate, were 0, 0.0625, 0.25, 0.5, 1, 2, 4, 8 and 16 mg/L.
HFS-TB
In TB, a bactericidal effect is defined as the killing of log-phase-growth Mtb.29,30 In the clinic, the early bactericidal effect, which is the average rate of kill in the first 2 days of therapy, is used to screen drugs for efficacy.30–33 A sterilizing effect is defined as microbial kill of semi-dormant bacilli under acidic conditions or non-replicating persister Mtb under hypoxia.29,34,35 While traditionally measured using relapse, the kill rates of semi-dormant bacilli and non-replicating persisters in sputum can be measured and calculated, giving a sterilizing effect rate.29,35–37 The HFS-TB allows us to culture these different Mtb subpopulations and thus measure bactericidal and sterilizing effect rates of drugs.10,11,38,39 In addition, the HFS-TB allows us to mimic human-like intrapulmonary concentration–time profiles of antibiotics, allowing us to examine their effect on the different Mtb metabolic subpopulations. In each experiment, tigecycline was infused over 1 h for the duration of the experiment by use of computerized syringe pumps. We programmed a tigecycline t½ of 12–15 h, as achieved by the drug in human lungs.21 The details of the log-phase, intracellular and sterilizing-effect HFS-TB model have been described previously.10–14,38,39 Further details of the design of different HFS-TB experiments are given in the Supplementary Methods. Bacterial burden was measured using both cfu/mL on Middlebrook 7H10 agar and time to positivity (TTP) in the MGIT system.
Pharmacokinetic and pharmacodynamic modelling
Drug concentrations in the HFS-TB were analysed using compartmental model pharmacokinetics in ADAPT 5, as described previously.10–14,38,39 The pharmacokinetic-model-derived AUC and peak concentrations were then used together with MICs to identify the pharmacokinetic/pharmacodynamic exposure indices such as AUC/MIC or peak/MIC, or percentage of dosing interval for which the concentration persisted above the MIC (%T>MIC). Drug concentration or pharmacokinetic/pharmacodynamic exposure versus microbial burden analysis utilized the inhibitory maximal kill (Emax) model, which has parameter outputs of Emax, the concentration or exposure mediating 50% of Emax (EC50), the Hill slope (H) and the bacterial burden in non-treated systems (Econ).
Modelling of time to extinction (TTE) and in silico simulations
We have developed a set of equations that model the trajectory of Mtb subpopulation sizes on therapy, until extinction, and then used set theory and morphisms for mapping from HFS-TB to clinical trial sputum data, and Latin hypercube sampling for simulations, in a computational modelling framework that is highly accurate in identifying TTE and time to cure in patients.40 This model is explained in detail in the Supplementary Methods. The model has been validated using randomized clinical trial data and is highly predictive.40 Here, we also validated the modelling exercise by comparing the TTE in the standard therapy regimen, to determine whether it gives outcomes similar to those known in TB treatment programmes.
Monte Carlo experiments for dose finding
We utilized Monte Carlo experiments for dose finding for the clinic; the steps employed and followed are described in detail in the Supplementary Methods and in prior publications.10–14,38,39,41,42 Internal and external validation was performed using steps recommended in the past.43 We utilized the pharmacokinetic parameter estimates and variability from Rubino et al., and lung penetration parameters from Conte et al. and Rodvold et al., shown in Table 1.21–23,44,45
Input and output in 10000-patient Monte Carlo experiments
| Parameter | Input in subroutine PRIOR | 10000 patient simulation | ||
|---|---|---|---|---|
| estimate | standard deviation | estimate | standard deviation | |
| Total clearance (L/h) | 19.20 | 7.76 | 19.17 | 2.80 |
| Central volume (L/kg) | 65.20 | 54.77 | 65.07 | 7.24 |
| Intercompartmental clearance (L/h) | 85.10 | 93.61 | 85.14 | 9.80 |
| Peripheral volume (L) | 398.00 | 160.00 | 397.90 | 12.63 |
Results
Effect of tigecycline static concentrations on extracellular and intracellular Mtb
Figure 1(a) shows that tigecycline effectively killed Mtb in log-phase growth with an Emax of 5.76 ± 0.34 log10 cfu/mL and an EC50 of 2.69 ± 0.37 mg/L when co-incubated with Mtb in test tubes (r2 = 0.99). In Mtb-infected adherent THP-1 macrophages, results were as shown in Figure 1(b). The Emax was 3.12 log10 cfu/mL and the EC50 was 0.14 ± 0.06 mg/L (r2 = 0.94). This means that potency (EC50) against intracellular Mtb was 16.7-fold better than for extracellular Mtb.
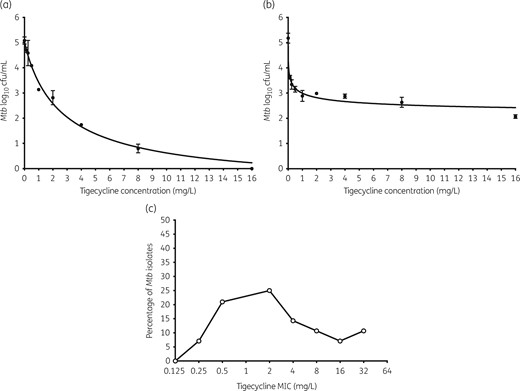
Concentration effect of tigecycline in test tubes and 12-well plates. There were three replicates examined at each concentration in (a) and (b). The error bars indicate standard deviations. (a) Tigecycline achieved a maximal microbial kill >5 log10 cfu/mL against Mtb in log-phase growth in test tubes when co-incubated for 7 days. (b) Tigecycline killed less intracellular Mtb compared with extracellular bacilli, but at higher potency, consistent with its known accumulation inside mammalian cells. (c) Tigecycline MIC distribution of Mtb clinical isolates reveals that the largest percentage had MICs <4 mg/L, suggesting that a large proportion of clinical isolates will be susceptible to tigecycline.
Next, we determined the tigecycline MICs in virulent laboratory strains, as well as in 25 Mtb clinical strains from South Africa: a mixture of 22% drug-susceptible strains and 78% MDR/XDR-TB strains. Results of the three MIC assays are shown in Figure 1(c). The median MIC was 2 mg/L, which means that a large proportion of isolates has MICs within clinically achievable pulmonary tigecycline concentrations.
Bactericidal effect of tigecycline in the HFS-TB
HFS-TB bactericidal effect studies with a once-a-day tigecycline dosing schedule of eight doses over 28 days achieved the measured tigecycline concentrations shown in Figure 2(a). Thus, we recapitulated tigecycline lung concentration–time profiles accurately.21 Figure 2(b) shows dramatic microbial kill based on the cfu/mL burden measure, even by doses that achieved peak concentrations below the MIC. When bacterial burden was measured using TTP, microbial kill was as shown in Figure 2(c). There was clear dose-dependent microbial kill starting on the first day of sampling and most striking on day 28. The inhibitory sigmoid Emax model for each sampling day is shown in Figure 2(d). Based on the day 3 findings, we calculated the maximum early bactericidal effect, which was 0.92 ± 0.29 log10 cfu/mL, similar to that of isoniazid, the antibiotic with the highest early bactericidal effect in the HFS-TB and patients.24,30,31,35,46,47 However, unlike isoniazid, which stops killing after day 3 due to efflux pump induction, tigecycline continued killing up to day 28, on which the maximal kill was 5.97 log10 cfu/mL below day 0.46
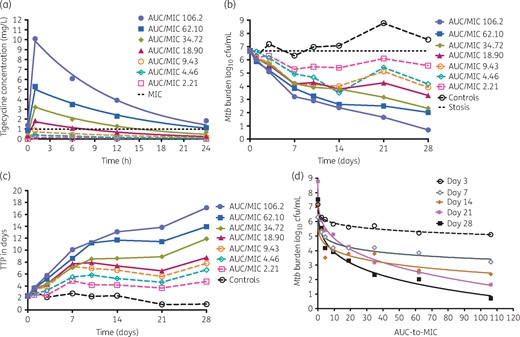
Bactericidal effect of tigecycline on Mtb in log-phase growth. Results are given for each HFS-TB unit. The filled symbols indicate doses that achieved peak concentrations above the MIC. (a) Tigecycline was administered once per day for 28 days and the concentration–time profiles achieved are shown. The line graphs are pharmacokinetic model derived (t½ = 12.6 ± 3.1 h) and the symbols are observed concentrations. The regimen designated with the orange open circles gives the concentration–time profile achieved by the 100 mg/day dose, which is the standard dose. (b) Time–kill for each dose indicates that even the low doses that had peak concentrations ∼5-fold below the MIC of 1 mg/L killed 1.1 log10 cfu/mL below the day 0 bacterial burden. (c) TTP assay demonstrated that the non-treated controls continued in log-phase growth. The microbial kill patterns were similar to the cfu/mL bacterial burden measure. (d) Bacterial burden versus exposure (AUC/MIC) was modelled using the inhibitory sigmoid Emax model and demonstrates dramatic exposure-dependent kill. This figure appears in colour in the online version of JAC and in black and white in the print version of JAC.
Tigecycline effect on intracellular Mtb in the HFS-TB
Next, replicate HFS-TBs with intracellular Mtb were treated with tigecycline with target concentrations of the current clinical dose, administered twice a day. The tigecycline concentration–time profiles achieved were as shown in Figure 3(a), which validates that the expected concentrations were achieved. Figure 3(b) shows that while there was rapid growth of Mtb inside macrophages in untreated controls, the tigecycline-treated HFS-TB seemed completely cleared of the Mtb by the end of the study on day 26, a total kill of 6 log10 cfu/mL compared with day 0. However, when TTP was used as the measure of bacterial burden (Figure 3c) there was still Mtb growth at the end of the study. Nevertheless, these results show that tigecycline is highly effective at killing intracellular Mtb, at clinically achievable concentration–time profiles.
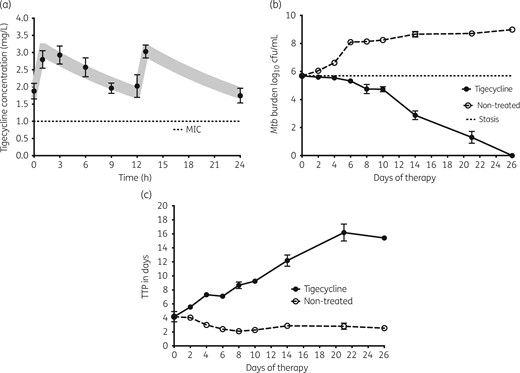
Intracellular bacillary response to tigecycline. The symbols and error bars are the mean values and standard deviations for three HFS-TBs at each timepoint. (a) Tigecycline concentrations measured in each HFS-TB at each timepoint were used for pharmacokinetic modelling. The shaded area is the 95% CI for the pharmacokinetic model; the observed concentrations demonstrated that the model fitted the data well. (b) There was dramatic kill and total elimination of Mtb by day 26 (end of experiment) by these tigecycline concentrations, based on cfu/mL. (c) When bacterial burden is shown as TTP, which increases with decreased bacterial burden, the same dramatic kill is shown; however, there was no total elimination of Mtb by this more sensitive assay.
Sterilizing effect of tigecycline versus standard therapy in the HFS-TB
HFS-TB sterilizing-effect experiments to compare tigecycline with standard combination therapy were performed over 6 weeks. Figure 4(a) shows the tigecycline concentration–time profiles achieved in each HFS-TB for sterilizing effect. The measured pharmacodynamic exposures of first-line drugs, expressed as AUC/MIC ratios, were 1776 ± 56 for isoniazid, 692 ± 20 for rifampicin and 133 ± 10 for pyrazinamide. These exposures mean that standard therapy was optimized for maximal sterilizing effect, which is not currently achieved with standard dosing of these drugs in patients; thus, we tipped the scales in favour of standard therapy. Figure 4(b) shows that the non-treated controls grew slowly, at 0.031 ± 0.001 log10 cfu/mL/day, consistent with semi-dormant conditions. The standard therapy combination killed a maximum of 3.92 ± 0.45 log10 cfu/mL (r2 = 0.80). Tigecycline monotherapy killed 3.06 ± 0.20 log10 cfu/mL (r2 = 0.92), very close to rates for standard triple therapy. Thus, tigecycline exhibited a considerable sterilizing effect.
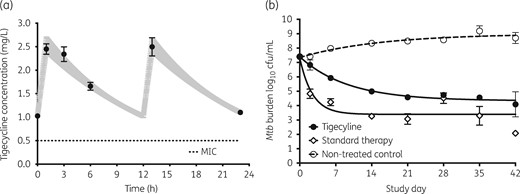
Sterilizing effect of tigecycline compared with standard therapy. The symbols and error bars are the mean values and standard deviations for three HFS-TBs at each timepoint. (a) Tigecycline concentrations measured in each HFS-TB were examined as a one-compartment model; the pharmacokinetic-model-derived concentrations are shown as the shaded 95% CI and observed concentrations are shown as circles. The concentrations are those that would be achieved by the standard tigecycline dose in the lung. (b) Sterilizing effect of tigecycline was less than that of the three-drug combination of first-line drugs, but was very high for monotherapy.
Once-a-week versus twice-a-week versus daily tigecycline dosing
Dose fractionation studies were performed using the intracellular HFS-TB model and 10 weeks of treatment. Figure 5(a) shows that the positive control, high-dose tigecycline, completely wiped out Mtb in the HFS-TB by day 28 based on cfu/mL, but not based on TTP (49 days) (Figure S1a). With the lowest EC20 dose, twice-a-week therapy was better than once-a-week therapy until day 28 (Figure 5a and Figure S1). With the EC50 dose, Figure 5(b) shows that microbial kill rates for the once-a-week regimen were similar to those for the twice-a-week regimen, but slightly lagged the daily therapy on day 28. However, Figure 5(c) shows that, based on TTP, all three dosing schedules of the EC50 had a similar effect. With the EC80 dose, both cfu/mL and TTP demonstrated the same kill rates regardless of dose schedule (Figure 5d and Figure S1). These results mean that once-a-week dosing would be effective even against rapidly growing subpopulations of Mtb, as long as optimized doses are administered. The results mean that the pharmacokinetic/pharmacodynamic index linked to efficacy of tetracyclines against Mtb is the AUC/MIC ratio.
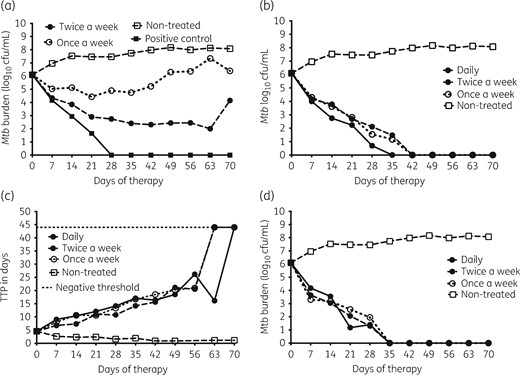
Effect of once-a-week versus twice-a-week versus daily tigecycline dosing. (a) Microbial kill with the EC20 dose as measured by cfu/mL was better with the twice-a-week dosing schedule compared with the once-a-week schedule. A daily dosing schedule was not examined for the EC20 dose. Rather, the positive control was the highest daily dose identified as leading to sterilization in earlier HFS-TB studies. (b) Microbial kill with the EC50 dose is shown using cfu/mL, which shows that the twice-weekly and once-weekly doses performed the same and lagged the daily therapy slightly based on cfu/mL. (c) However, based on TTP all three dosing schedules killed at the same rate for the EC50. (d) Microbial kill with the EC80 dose was similar with all three dosing schedules, when measured either as cfu/mL or TTP (Figure S1). This means that, at optimal exposures, as long as the same cumulative tigecycline dose is administered, once-a-week therapy is as good as daily therapy.
After day 28, the daily tigecycline dose schedules were replaced by minocycline, while the intermittent doses of tigecycline continued. The once-a-week EC20 dose eventually failed, as can be seen in the biphasic response in Figure 5(a) and Figure S1. However, minocycline continued to suppress bacterial burden with the daily EC50 and EC80 doses, similar to the once-a-week schedule of tigecycline, with no signs of regrowth. This means that intermittent tigecycline therapy will be as effective as daily therapy, while 4 weeks of daily tigecycline therapy to lower the bacterial burden followed by oral minocycline would be equally effective against Mtb.
TTE of Mtb population with tigecycline monotherapy
Next, we utilized cfu/mL and TTP trajectories from all five HFS-TB experiments to calculate TTE. Model fits for non-treated HFS-TB are shown in Figure S2. The HFS-TB-derived bacterial decline trajectory models are shown in Figure 6(a) for standard therapy and Figure 6(b) for tigecycline monotherapy. The figure shows a longer tail in tigecycline TTE versus standard therapy, driven mainly by slower kill of semi-dormant bacilli, in HFS-TB. Figure S3 shows the transformation step of the mean trajectories plus the spread from HFS-TB to TB patients based on our validated approach. Figure 6(c and d) show the distribution of TTE predicted in patients, indicating the proportion cured at 6 months with tigecycline monotherapy versus with standard therapy. The percentage of patients reaching bacterial population extinction with standard therapy was 77.75 (95% CI = 76.99–78.55) while that for tigecycline was 44.77 (95% CI = 43.8–45.75) after 6 months of therapy. The standard therapy rates are consistent with cure rates of 80% encountered in the clinic as reported by WHO,48 validating that our transformations were correct. At 12 months duration of tigecycline monotherapy, the proportion of patients who reached Mtb extinction was 64.51% (95% CI = 63.57%–65.44%).
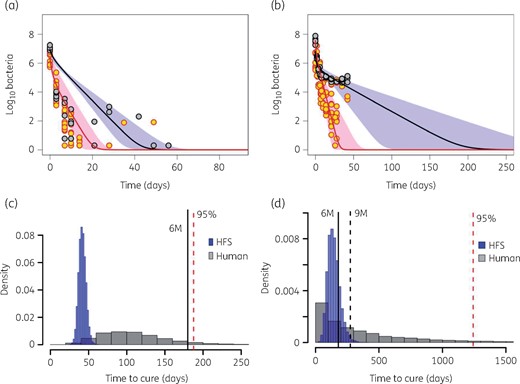
Transforming the HFS-TB data to patients. (a and b) Trajectories of bacterial subpopulations (extracellular log phase plus intracellular in red and non-replicating persisters in black) in the HFS-TB. (a) Trajectories of both Mtb subpopulations under combination therapy with isoniazid/rifampicin/pyrazinamide. (b) Trajectories of both Mtb subpopulations under monotherapy with tigecycline. The TTE for tigecycline was longer than with standard therapy. (c) Morphism transformation to patients, followed by simulations of TTE based on Latin hypercube sampling reveals that most patients on standard combination therapy had achieved cure by the 6 month timepoint. (d) Transformation and Latin (with Latin hypercube sampling-aided simulations) on tigecycline monotherapy shows that TTE for tigecycline monotherapy is longer, but with a majority of patients achieving TTE by 12 months. 6M, 6 months; 9M, 9 months. This figure appears in colour in the online version of JAC and in black and white in the print version of JAC.
Identification of clinical dose for use in patients in Monte Carlo experiments
Since both the once-a-week EC50 (AUC0–168/MIC = 170.2) and the once-a-week EC80 (AUC0–168/MIC = 296) led to complete sterilization we identified the minimum doses that would achieve these, given the pharmacokinetic and MIC variability. The 10000 subject simulations achieved the drug pharmacokinetic parameters and concentrations, and variability thereof, shown in Table 1. Table 1 shows that the Monte Carlo experiment output closely resembled actual pharmacokinetic parameters identified in patients in the clinic in a separate data set.
Figure 7(a) shows how well doses of 700 mg once a week and 100 mg once a day achieved the EC50 target exposure in adults as MIC increased from 0.25 to 2.0 mg/L. For the 200 mg/day and 1400 mg once-a-week doses, the MIC at which target attainment fell to 0% was 4.0 mg/L. The doses of 300 mg/day and 2100 mg/week did not much improve on this, while 400 mg/day and 2800 mg/week would have 0% target attainment at 8 mg/L. However, this does not mean that tigecycline has no effect at higher MICs; as we saw earlier it kills below day 0 burden even at one-quarter of the MIC, likely via mechanisms such as apoptosis, as demonstrated for minocycline.14 A similar exercise with the EC80 target is shown in Figure 7(b). The higher target exposure was more difficult to achieve even at MICs of 1.0 mg/L and would be achievable only in a minority of patients.
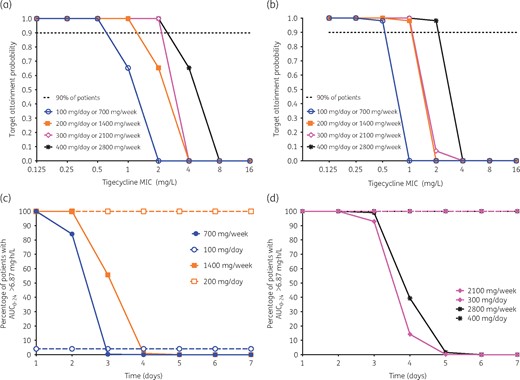
In silico dose-finding studies for clinical use. (a) Probability of attaining 50% of maximal kill at different doses (administered daily or once a week) with increasing MIC. The probability falls to 0% at 2 mg/L for the lowest dose and 8 mg/L for the highest dose. (b) Probability of attaining maximal kill (EC80). The target attainment probability is 0% at an MIC of 1 mg/L with the lowest dose and at an MIC of 4 mg/L with the highest dose. (c) Risk of toxicity with the lowest dose of 100 mg per day given cumulatively as 700 mg once a week is limited to the first 3 days, while for 100 mg daily it is low throughout. However, for the 200 mg dose, the risk spans the entire dosing period (7 days) when administered daily, but is limited to 4 days (at which time it is 0%) with the weekly dosing. (d) Risk with the 300 and 400 mg doses stretches across the 7 day dosing period when administered daily, but is restricted to 5 days when given as 2100 or 2800 mg once a week. This figure appears in colour in the online version of JAC and in black and white in the print version of JAC.
Since it is known that a tigecycline daily AUC (AUC0–24) >6.87 mg·h/L increases the odds of toxicity 2.6-fold,44 we also calculated the proportion of patients who were at risk of toxicity with the different doses and dosing schemes, with results shown in Figure 7(c and d). The results show that the once-a-week regimen would actually be associated with fewer days at risk of toxicity; the 100 mg/day regimen had a proportion of 4.1% on days 1 and 2 versus 100% and 84.1% on days 1 and 2 for the once-a-week 700 mg regimen, but once a week fell to 0% after that because of falling concentrations. At ≥200 mg/day 100% achieved AUC0–24 >6.87 mg·h/L daily (100% of the time), while for 1400 mg/week 0% of patients attained the target AUC associated with toxicity in the last 3/7 (43%) days. Overall, the results show a lower proportion of patients and reduced days at risk of toxicity with once-a-week dosing.
Discussion
Glycylcyclines are a more broad-spectrum group of modern tetracyclines, engineered to be more efficacious than second-generation tetracyclines such as minocycline. Tigecycline, which is an injectable drug, could serve as a better alternative to injectable drugs such as aminoglycosides in MDR-TB, removing the cost of irreversible ototoxicity and nephrotoxicity. While tigecycline has its own side effects, mainly nausea and vomiting, these side effects may be easier to manage with anti-emetics such as ondansetron or metoclopramide49,50 and disappear after therapy cessation, compared with aminoglycoside-induced hearing loss, which deepens even after aminoglycoside cessation. However, clearly the intravenous infusion requirement for tigecycline would place a burden on programmes and on patients with MDR/XDR-TB; however, this needs to be only for 4 weeks, after which oral minocycline can be substituted (Figure 5). As regards efficacy, the WHO reports the success rate for the recommended multidrug-regimen treatment of MDR-TB given over the same 12 months as 54%, while that for XDR-TB was 30%.48 We show, using our recently derived translational computational program and TTE model, that tigecycline monotherapy duration in these patients could be as short as 12 months with a success rate of 65%. In combination with other drugs, therapy duration would be expected to be lower.
In therapeutically destitute patients, such as are available where we see patients in South Africa, where we sometimes resort to lung resection,48,51 tigecycline in combination with at least another agent with a favourable susceptibility profile may be prudent to try in a salvage therapy study. In addition, one scenario is when patients have failed all other options of chemotherapy, but are candidates for therapeutic resection, tigecycline monotherapy may be given in the run-up to lung resection to decrease lung bacterial burden, and to determine whether it would be effective in decreasing Mtb burden. Unlike first-line drugs, which have selective bactericidal and sterilizing effect rates, tigecycline kills all Mtb subpopulations, thus tigecycline monotherapy could be examined in this limited scenario prior to lung resection for efficacy in these patients.
Tigecycline is administered intravenously, which could create a burden for TB programmes. We found that a once-a-week schedule could be efficacious, which could make this drug easier to use by TB programmes. This is best achieved at higher doses. Recently, the maximum tolerated dose of tigecycline was explored in 27 patients, for repurposing tigecycline use for AML.50 Elevated liver function tests in leukaemia patients were encountered on the last day of a 5 day cycle of 350 mg/day dose level, after receiving a total of 1750 mg for that week in one patient and 2800 mg in a second patient. Thus, the once-a-week dose we propose is likely to be safe; nevertheless, we suggest vigilance for new symptomatology and periodic testing of liver function with escalation in tigecycline dose, given that TB programmes currently check liver function for rifampicin, isoniazid and pyrazinamide toxicity. Moreover, the once-a-week strategy could even lead to fewer days on which patients have concentrations associated with nausea and vomiting each week and could decrease the frequency of nausea and vomiting.
Our study has some limitations. First, our results reflect outcomes in a preclinical model. Thus, clinical confirmation is still required. Second, the HFS-TB does not have an immune system and thus does take into account the immune status. Our studies with minocycline, from which tigecycline was derived, have shown that this class of drugs could also work as host-directed therapy by boosting the immune system and altering lung remodelling.14 Thus, the clinical effects may be higher than in the HFS-TB. Third, in the Monte Carlo experiments we used pharmacokinetic parameters and variability derived in non-TB patients; the disease itself may alter drug pharmacokinetics and variability.
In summary, we found that tigecycline has an excellent bactericidal and sterilizing effect on Mtb and has good activity against MDR/XDR-TB clinical strains. We also found that as monotherapy the effect often matched that of the standard first-line agents. We also found that efficacy is retained even with once-a-week schedules, which could make the drug easier to administer in TB programmes.
Funding
The Baylor Research Institute supported this study. The funder played no role in data gathering, experiments, data analysis or preparation of the manuscript.
Transparency declarations
T. G. founded Praedicare LLC. All other authors: none to declare.
Author contributions
T. G. and D. D. conceived and designed the studies. D. D., S. S. and T. G. performed the HFS-TB studies. G. M. performed TTE modelling, morphism transformations and simulations aided by Latin hypercube sampling. P. B., K. R. M. and K. N. C. assisted in the HFS-TB studies. P. S. L. performed the drug concentration assays. T. G. performed pharmacokinetic/pharmacodynamic modelling and simulations. D. D. wrote the first draft of the manuscript. D. D., T. G. and K. D. wrote the manuscript, with special emphasis on clinical translation.
References
Collaborative Group for the Meta-Analysis of Individual Patient Data in MDR-TB treatment–2017,
WHO.
