


Abstract
With the rise of fluconazole resistance in Candida tropicalis in Asian countries, the rapid detection of resistance is required to optimize therapy.
We evaluated a stable isotope labelling by/with amino acids in cell culture (SILAC) approach for rapid detection of fluconazole resistance in C. tropicalis by MALDI-TOF MS.
Twenty-six fluconazole-resistant and 19 -susceptible C. tropicalis isolates were used. Isolates were grown in media containing normal lysine (NL), isotopically labelled (‘heavy’) lysine (HL) and fluconazole (FLC) with labelled lysine (HL + FLC). MALDI-TOF MS was performed, acquired spectra were visually compared and composite correlation index (CCI) values were calculated. The results were analysed by CCI matrix, virtual gel and principal component analysis (PCA).
The MICs of fluconazole in 26 resistant and 19 susceptible isolates were 16–256 mg/L and 0.5–1 mg/L, respectively. The m/z values of 15 peaks specific for media containing NL and their corresponding peaks specific for media with HL were detected to differentiate resistant and susceptible isolates. The CCI cut-off values for susceptible and resistant isolates were significant (P < 0.05). The CCI matrix, virtual gel and PCA dendrogram confirmed the results. The sensitivity, specificity, positive predictive value, negative predictive value and accuracy of this method for detection of fluconazole resistance were 92.31%, 100%, 100%, 90.48% and 95.56%, respectively.
SILAC, a promising approach for rapid resistance detection in C. tropicalis using MALDI-TOF MS, may be used in the routine laboratory in the near future.
Introduction
A rise in reports of Candida tropicalis with a parallel increase in fluconazole resistance has been observed in Asian countries.1–3 This has prompted the need for rapid detection of fluconazole resistance to optimize therapy.4,5 CLSI and EUCAST have recommended broth microdilution (BMD) methods for antifungal susceptibility testing (AFST) in clinical laboratories.6–8 Although the validity of these methods has been established, they are tedious and time-consuming and the interpretation is subjective.9–11 Moreover, the in vivo and in vitro correlations are still to be validated. Other methods (Etest, VITEK 2 and disc diffusion methods) for AFST have heterogeneous results.12,13 Therefore, we require a rapid AFST method to overcome the present limitations.
MALDI-TOF MS is an advanced tool used for the rapid identification of fungi.4,14 Several studies have also demonstrated its use for antimicrobial susceptibility testing (AST) in bacteria and fungi.15–23 However, these approaches are based on the detection of resistance by detecting the presence of drug-modifying enzymes or mutations in the drug targets, thereby limiting the spectrum of drug-resistant microorganisms which they can detect.
A novel technique, stable isotope labelling by/with amino acids in cell culture (SILAC), was described by Sparbier et al.24 and Jung et al.25 for antimicrobial resistance detection in bacteria using MALDI-TOF MS. In these approaches, the resistant and susceptible isolates were differentiated only on the basis of their metabolic status in the presence or absence of drug. In brief, when bacterial cells were grown in media containing isotopically labelled amino acids, these were incorporated into the newly synthesized cellular proteins. Resistant isolates could grow at certain drug concentrations but had spectral changes, which could be detected by MALDI-TOF MS.
In the present study, we evaluated the SILAC approach using MALDI-TOF MS for rapid detection of fluconazole resistance in C. tropicalis.
Materials and methods
Yeast isolates and cultivation
A total of 45 (26 fluconazole-resistant and 19 -susceptible) clinical isolates of C. tropicalis were obtained from the National Culture Collection of Pathogenic Fungi (www.nccpf.com) at the Postgraduate Institute of Medical Education and Research, Chandigarh, India. For initial standardization, three fluconazole-resistant and three -susceptible isolates were used. All the isolates were inoculated in yeast extract peptone dextrose (YPD) broth (Himedia, India) and incubated at 37°C on a shaker. Young overnight growth was used for each experiment.
AFST
The susceptibility profile was confirmed by the BMD method (M27-A3) according to standard CLSI guidelines and the MICs were interpreted as per the M27-S4 interpretive guidelines of CLSI.6,7 To determine the azole resistance profiles, fluconazole, voriconazole, itraconazole and posaconazole were used (Sigma–Aldrich, Germany). For fluconazole susceptibility testing, the concentrations were 0.125–256 mg/L and for the other drugs 0.03–16 mg/L concentrations were used.
Optimization of incubation condition for resistance profiling
We initially standardized the media and different components to find the optimum conditions for C. tropicalis growth for the SILAC method. Two media, (i) DMEM with low glucose and without arginine, leucine, lysine, sodium pyruvate and phenol red (Sigma–Aldrich) and (ii) RPMI-1640 medium with l-glutamine and sodium bicarbonate and without arginine, leucine, lysine and phenol red (Sigma–Aldrich) were used. Both media were supplemented with yeast synthetic drop-out medium supplements containing all proteinogenic amino acids except lysine (Sigma–Aldrich), at various concentrations between 0.3 and 2.4 g/L, and 4–8 g/L glucose (Himedia, India). Three different 250 μL setups were used for each isolate. The first setup contained normal lysine (NL) (Sigma–Aldrich) at various concentrations between 0.1 and 0.8 g/L, the second contained heavy lysine (HL; 13C615N2-l-lysine; Sigma–Aldrich) at a concentration of 0.1–0.8 g/L, and the third contained heavy lysine with various concentrations of fluconazole (HL + FLC)(16 to 160 mg/L).24,25 For standardization of inoculum concentration, each medium setup was inoculated with 1 × 10⁶, 5 × 10⁶, 1 × 10⁷ and 1 × 10⁸ cells/mL followed by incubation for 4 h while shaking at 160 rpm, as per our previously published protocol.23
Sample preparation and MALDI-TOF MS analysis
Protein extraction was performed by on-plate extraction methods according to our previously described protocol.4 After extraction, the Microflex LT Biotyper instrument (Bruker Daltonik, Bremen, Germany) was used for MALDI-TOF MS-based rapid resistance detection. By using flexControl software (Bruker Daltonics flexControl 3.4), the mass spectrum of each sample was obtained for a mass range between 2000 and 10 000 m/z. Each spectrum was generated by a sum of 240 laser shots (randomly hitting six different positions of a spot in 40 laser shot steps). The quality, consistency and reproducibility of raw data were analysed by flexAnalysis 3.4 software (Bruker Daltonics). Further, MALDI Biotyper software 3.1 was used to analyse the acquired spectra.23
Software-based analysis of acquired spectra
The spectra were visually compared using flexAnalysis software to check for the spectral shift. In flexAnalysis software the HL- and NL-specific peaks were identified for further analysis. The results observed in the direct visual inspection of the spectra were reconfirmed by using different default analysis modules present in MALDI Biotyper software.
By using the MALDI Biotyper software, the composite correlation index (CCI) values were calculated, which were further converted into a ‘heat map’ (CCI matrix).23 In brief, MALDI Biotyper software (MALDI Biotyper 3.1, Bruker Daltonics) was used for smoothing and baseline subtraction of the raw spectra obtained by flexControl software. In MALDI Biotyper software there was a separate module for CCI analysis, which automatically compared the similarity between the spectra and calculated the CCI values. CCI analysis statistically determined the relationship between each spectrum. A CCI value of ‘1’ indicates that spectra are highly similar to each other, whereas a CCI value of ‘0’ indicates no correlation. In the CCI matrix, similar spectra appear as ‘hot’ colours (different shades of yellow to dark red) and distinct spectra appear as ‘cold’ (various shades of green to dark blue).23
The results obtained from the CCI analysis were reconfirmed by virtual gel and cluster analysis by using MALDI Biotyper software. The raw spectra obtained from different setups were used to construct both virtual gel and cluster analysis. In virtual gel analysis, all the peaks present in the individual spectrum are visualized as a gel view and present the similarity between spectra. The cluster analysis was done by constructing a principal component analysis (PCA) dendrogram. The dendrogram confirmed the reproducibility and reliability of the results obtained by previous analysis.23
Results
Yeast isolates and susceptibility profile
In total, 45 isolates were used in this study. As per CLSI guidelines, 26 isolates were resistant to fluconazole, with MICs ranging from 16 to 256 mg/L, and 19 were susceptible to fluconazole, with MICs ranging from 0.5 to 1 mg/L. For voriconazole, itraconazole and posaconazole, resistance was reported in 12 (1–4 mg/L), 4 (2 mg/L) and 4 (1–2 mg/L) isolates, respectively [Figure 1 and Table S1 (available as Supplementary data at JAC Online)]. Isolates resistant to voriconazole, itraconazole and posaconazole also exhibited resistance to fluconazole.
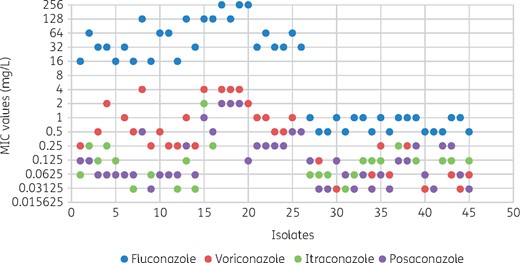
BMD susceptibility results for 45 C. tropicalis isolates with fluconazole, voriconazole, itraconazole and posaconazole. Green itraconazole dots are obscured by purple posaconazole dots for isolates 17, 18 and 19. This figure appears in colour in the online version of JAC and in black and white in the print version of JAC.
Standardization of different parameters to achieve optimum growth for MALDI-TOF MS-based resistance detection
| Growth medium | ||
|---|---|---|
| Characteristics | DMEM | RPMI |
| Cell concentration (cells/mL) | ||
| 1 × 10⁶ | no detectable growth | no detectable growth |
| 5 × 10⁶ | detectable growth | detectable growth |
| 1 × 10⁷ | detectable growth | detectable growth |
| 1 × 10⁸ | detectable growth | detectable growth |
| Drug concentration (mg/L) | ||
| 16 | growth | growth |
| 80 | reduced growth | reduced growth |
| 160 | growth inhibition of susceptible isolates | growth inhibition of susceptible isolates |
| Media components (g/L)a | ||
| G = 4; M = 0.30; L = 0.1 | no growth | no growth |
| G = 4; M = 0.60; L = 0.2 | slow growth | slow growth |
| G = 8; M = 0.30; L = 0.1 | slow growth | slow growth |
| G = 8; M = 0.60; L = 0.2 | efficient growth | efficient growth |
| G = 8; M = 0.12; L = 0.4 | efficient growth | efficient growth |
| G = 8; M = 0.24; L = 0.8 | efficient growth | efficient growth |
G, glucose; M, yeast synthetic drop-out medium supplements; L, lysine.
Growth conditions for resistance analysis
The deficiency and sufficiency of media components were standardized spectrophotometrically by measuring the increment in OD of the culture and the detectable incorporation of stable isotopes into the cells by MALDI-TOF MS after 4 h of incubation. The growth was described as ‘efficient’ in the case of increasing OD with detectable spectral change on MALDI-TOF after 4 h and ‘slow’ in the case of a rise in OD but a spectral change not being detected, even after 4 h of incubation. We determined that 8 g/L glucose, 0.6 g/L medium supplements and 0.2 g/L lysine is sufficient for growth. A cell count of 5 × 10⁶ cells/mL was sufficient to allow detection by MALDI-TOF MS after 4 h of incubation and 160 mg/L fluconazole was needed to efficiently inhibit the growth of susceptible isolates of C. tropicalis (Table 1). There was no significant difference between the spectra of cells grown in DMEM and RPMI medium (Figure S1). Hence, RPMI was used for rest of the experiments.
Direct evaluation of spectra by using the database
All the acquired spectra were matched with the existing database. In the case of the 26 resistant isolates, following growth in media containing HL + fluconazole (HL + FLC) the spectra were completely different from the spectra for growth in NL-containing media. Consequently, none of the resistant isolates harvested from the media containing HL + FLC could be identified as C. tropicalis. In contrast, out of 19 susceptible isolates 13 (68.4%) isolates were identified as C. tropicalis with low log scores between 1.4 and 1.71, as the HL + FLC spectrum was highly similar to the NL spectrum (Table S2).
Peaks specific for media with HL and NL obtained by flexAnalysis software
| Peak no. | Biomarker mass with NL (m/z) | Biomarker mass with HL (m/z) | Change in m/z | No. of heavy isotope incorporations |
|---|---|---|---|---|
| 1 | 3028 | 3068 | 40 | 5 |
| 2 | 3097 | 3129 | 32 | 4 |
| 3 | 3233 | 3249 | 16 | 2 |
| 4 | 3457 | 3521 | 64 | 8 |
| 5 | 3498 | 3538 | 40 | 5 |
| 6 | 3567 | 3615 | 48 | 6 |
| 7 | 5010 | 5050 | 40 | 5 |
| 8 | 5195 | 5259 | 64 | 8 |
| 9 | 6059 | 6139 | 80 | 10 |
| 10 | 6196 | 6260 | 64 | 8 |
| 11 | 6467 | 6499 | 32 | 4 |
| 12 | 6922 | 7042 | 120 | 15 |
| 13 | 6993 | 7081 | 88 | 11 |
| 14 | 7136 | 7232 | 96 | 12 |
| 15 | 7210 | 7314 | 104 | 13 |
Selection of resistance-specific spectral shift
The acquired raw spectra were visualized and pre-processed using flexAnalysis software for further analysis. A significant spectral shift was observed for the cells treated with HL, which indicated that HL was incorporated into the newly synthesized protein and that cells were growing normally in its presence. We selected 15 significant peak shifts between the mass ranges of 2000 and 10 000 Da (m/z). A mass tolerance of ±3 Da was denoted as the same peak whereas higher values were considered different peaks. The difference between isolates grown in NL and their corresponding HL peaks ranged from 16 to 120 Da. Each peak shift was a multiple of 8, as it was known that a single isotope incorporation resulted in an increase in the mass by 8 Da. We observed that 2 to 15 heavy isotopes were incorporated into the signature spectra (Table 2).
Discrimination of resistance profile by direct observation of spectra
Spectra from each condition [(i) media with NL; (ii) media with HL; and (iii) media with HL + FLC] were visualized using flexAnalysis software. The direct observation of spectral shifts clearly demonstrated the differences between resistant and susceptible isolates. For each isolate, the first setup produced spectra representing the normal spectrum, the second setup produced spectra representing the heavy spectrum and the third setup determined the resistance profile of each isolate. In the case of resistant isolates, the newly dividing cells incorporated the HL into their proteins as fluconazole did not affect growth. As a result, the proteins of dividing cells were labelled with heavy isotopes of lysine and the spectra from the third setup containing fluconazole were similar to the second setup containing HL (without fluconazole) and entirely different from the first setup containing NL. In the case of susceptible isolates, the growth was suppressed in the presence of fluconazole; since it is a fungistatic drug this inhibition was not immediate. Thus, a very much lower number of heavy isotopes were incorporated into the dividing cells and the resulting spectra exhibited similarity to both the spectra from isolates grown in media with NL and HL (Figure 2).
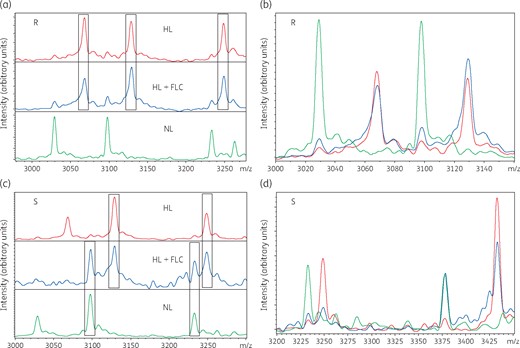
Comparison of spectra captured from susceptible and resistant isolates of C. tropicalis using three different setups (NL, HL and HL + FLC). (a) In resistant isolates, the HL + FLC spectrum was similar to the HL spectrum and different from the NL spectrum. (b) The overlapping view of spectra shows higher similarity between HL + FLC and HL in a resistant isolate. (c) In susceptible isolates, the HL + FLC spectrum had similarity with both NL and HL spectra and the NL spectrum was completely different from the HL spectrum. (d) The overlapping view of spectra shows similarity of HL + FLC with both NL and HL in a susceptible isolate. R, resistant isolate; S, susceptible isolate; FLC, fluconazole. This figure appears in colour in the online version of JAC and in black and white in the print version of JAC.
CCI analysis of resistant and susceptible isolates
The results observed by direct visual inspection were further analysed by calculating the CCI values and by constructing the CCI matrix. Figure 3 represents the comparison of CCI values for all the isolates used in this study. We calculated the criteria to differentiate between resistant and susceptible on the basis of their CCI values with HL + FLC/NL and HL + FLC/HL. In the case of resistant isolates, the CCI values for HL + FLC/NL and HL + FLC/HL were ≤0.33 and ≥0.76, respectively, whereas for susceptible isolates they were ≥0.55 and ≤0.6, respectively (Figure 3 and Table S1). The CCI values with HL + FLC/NL and HL + FLC/HL for both resistant and susceptible isolates were highly specific (P value <0.05). Among the 26 fluconazole-resistant isolates, two resistant isolates showed similarity to susceptible isolates with CCI values for HL + FLC/NL, HL + FLC/HL of 0.65, 0.62 and 0.44, 0.47 respectively (Table S1). The remainder of the 24 resistant isolates had more accurate results when CCI values were automatically converted to a heat map and the CCI matrix was generated. The colours of HL + FLC/HL were hot, whereas HL+FLC/NL and HL/NL were cold for resistant isolates in the CCI matrix. For the susceptible isolates, HL + FLC/NL and HL + FLC/HL were represented as hot colours, whereas HL/NL were designated as cold colours (Figure 4).
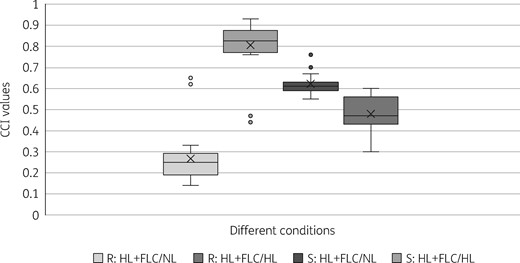
Determination of the cut-off values to differentiate resistant and susceptible isolates using the CCI values for HL + FLC/NL and HL + FLC/HL obtained for each isolate. R, resistant isolate; S, susceptible isolate; FLC, fluconazole.
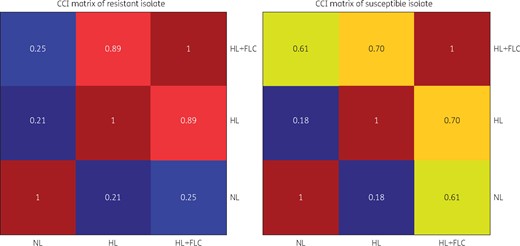
CCI matrix of representative resistant and susceptible isolates of C. tropicalis. Highly similar spectra are represented by colours between yellow and deep red, whereas less similar spectra are represented by colours between green and deep blue. In resistant isolates, the HL + FLC/HL spectra are highly similar, whereas the HL + FLC/NL and HL/NL spectra are less similar. In susceptible isolates, the HL + FLC/HL and HL + FLC/NL spectra have similarity, whereas the HL/NL spectrum is less similar. FLC, fluconazole. This figure appears in colour in the online version of JAC and in black and white in the print version of JAC.
Virtual gel and PCA dendrogram analysis for reconfirmation
Both virtual gel and PCA dendrogram analysis reconfirmed the result obtained by CCI analysis. Similar to the CCI matrix analysis and virtual gel, the PCA dendrogram represented the similarity between HL + FLC/NL, HL + FLC/HL and HL/NL. The HL + FLC and HL spectra produced a similar banding pattern and formed a single clade, whereas the NL spectra produced a distinct banding pattern and produced a different clade for resistant isolates. In the case of susceptible isolates, the HL + FLC bands were more highly similar to the NL bands than HL bands and formed a single clade, whereas the HL bands were less similar to NL bands and produced a different clade (Figures S2 and S3).
We also calculated the sensitivity and specificity of our standardized protocol. The sensitivity, specificity, positive predictive value, negative predictive value and accuracy were 92.31%, 100%, 100%, 90.48% and 95.56%, respectively.
Discussion
Antimicrobial susceptibility testing using MALDI-TOF MS is an innovative approach and well-studied for bacteria.15–19 However, studies on MALDI-TOF MS-based AFST (ms-AFST) are limited.20–23 Sparbier et al.24 first introduced an innovative approach for rapid resistance profiling in bacteria using SILAC. To the best of our knowledge, this is the first study where a SILAC approach has been successfully employed for AFST. We tested clinical isolates of C. tropicalis as we observed increased fluconazole resistance in this species.1 The rapid detection of fluconazole resistance would help in choosing proper antifungal therapy.
SILAC is a well-established approach for quantitative proteomics.26 We standardized the protocol for detection of fluconazole resistance in C. tropicalis. Lysine appears frequently in ribosomal proteins and can be detected in the spectra profile using MALDI Biotyper.27,28 We used isotopically labelled lysine to determine the spectral changes between resistant and susceptible C. tropicalis isolates. Since several cell cycles are required for incorporation of HL and the production of proteins in the presence of fluconazole, this would not be possible in susceptible isolates in the presence of the drug. We found that 4 h of incubation was optimum for heavy isotope labelling and MALDI-TOF MS could accurately detect the resistant isolates within 5 h.
In this study, we standardized the growth media, glucose, drop-out medium supplements and lysine concentration for sufficient growth of C. tropicalis isolates. We also standardized the cell count and fluconazole concentration for MALDI-TOF MS-based rapid resistance detection.
We compared the acquired spectra with an existing database to check the identification status. As the spectra of resistant isolates in the presence of HL + FLC were completely different from the normal spectra, the resistant isolates could not be identified as C. tropicalis in the presence of the drug. In contrast, the spectra of susceptible isolates in HL + FLC were highly similar to those with NL and the isolates were identified as C. tropicalis with low log scores. Six (31.6%) susceptible isolates were not identified as C. tropicalis, probably owing to the fungistatic nature of fluconazole, which may cause partial incorporation of HL and may cause spectral alteration.
According to the previous studies, direct visual inspection of the spectra for resistance detection is time-consuming, as it is difficult to compare multiple spectra.24,25 We overlapped the spectra obtained from three different conditions using flexAnalysis software, visualizing all spectra in a single window (stacked format), enabling us to differentiate the resistant and susceptible isolates. This could also be achieved by comparing the m/z values of 15 NL peaks and their corresponding HL peaks.
CCI analysis was used to define a breakpoint to differentiate between resistant and susceptible isolates. A CCI below 0.6 (HL + drug/NL) has been previously described for the detection of resistant bacterial isolates.24,25 In our study, the CCI was ≤0.33 for HL + FLC/NL and ≥0.76 for HL + FLC/HL in resistant isolates and ≥0.55 for HL + FLC/NL and ≤0.6 for HL + FLC/HL in susceptible isolates. Of 39 isolates used for evaluation, 37 met these criteria. The remaining two isolates had MICs of 16 mg/L, which is very close to the cut-off value (≥8 mg/L). This could have resulted in growth inhibition at the standardized (160 mg/L) drug concentration and a similar CCI to susceptible isolates.
In the CCI matrix, the colour of HL + FLC/HL in resistant isolates and HL + FLC/NL in susceptible isolates was hot and a similar banding pattern was observed on virtual gel analysis. Comparable findings have been observed by Sparbier et al.24 We also constructed a PCA dendrogram, which reconfirmed the reproducibility and consistency of our results. The results of the present study indicate that this standardized method has good sensitivity and specificity for fluconazole resistance detection in C. tropicalis.
Compared with other ms-AFST methods, the SILAC method is clearly time-saving over the CLSI- or EUCAST-based BMD method (5 h versus 24 h). It is also easy to perform and provides consistent results. The cost of using the SILAC technique is much lower; our internal estimates indicate ∼1 US dollar per test in comparison with 50 US dollars for AFST with the BMD method. Thus, this approach is not only rapid and accurate but also cost-effective for laboratories with pre-existing MALDI-TOF facilities. The currently available ms-AFST methods are based on the detection of mutations in antifungal target genes or the presence of drug-degrading and -modifying enzymes.20–23 As the detection of resistance by the SILAC approach is based on the differential metabolic activity of the resistant and susceptible cells in the presence of antifungal drug, this technique can detect resistance to any antifungal, irrespective of the mechanism imparting it.
Additional standardization using a larger number of isolates is necessary to validate the suggested breakpoint and to differentiate the intermediately resistant isolates. In this study, we have evaluated this approach for detection of fluconazole resistance in C. tropicalis only. However, we have also conducted a pilot study on the ms-AFST of Candida albicans and Candida glabrata using the SILAC approach and preliminary results are encouraging (Figures S4 and S5). Future studies including a large number of resistant and susceptible isolates of different Candida species are needed to validate the robustness and reproducibility of this technique.
In conclusion, MALDI-TOF MS-based resistance detection using SILAC is a promising approach for routine detection of resistance in C. tropicalis.
Funding
This study was supported by the grants from Department of Science and Technology (DST) and Indian Council of Medical Research (ICMR), Government of India.
Transparency declarations
None to declare.
References
Clinical and Laboratory Standards Institute.
Clinical and Laboratory Standards Institute.
EUCAST. Antifungal Agents Breakpoint Tables for Interpretation of MICs. Basel, Switzerland: EUCAST,
