


Abstract
ART in the developing world has moved to a new era with the WHO recommendation to test and immediately treat HIV-positive individuals. A high frequency of pretreatment HIV drug resistance (PDR) can compromise ART efficacy. Our study presents updated estimates of PDR in seven countries from West Africa (Burkina Faso, Cameroon, Côte d’Ivoire, Mali and Togo) and Southeast Asia (Thailand and Vietnam).
Eligible study participants were adult ART initiators, recruited from December 2015 to November 2016 in major ART clinics in each country. HIV drug resistance (HIVDR) tests were performed for all specimens and interpretation was done using the Stanford algorithm.
Overall, 1153 participants were recruited and 1020 nt sequences were generated. PDR frequency among all initiators was 15.9% (95% CI: 13.8%–18.3%) overall, ranging from 9.6% and 10.2% in Burkina Faso and Thailand, respectively, 14.7% in Vietnam, 15.4% in Mali, 16.5% in Côte d’Ivoire and 19.3% in Cameroon, to 24.6% in Togo. The prevalence of NNRTI resistance mutations was 12%; NRTI and PI PDR prevalences were 4% and 3%, respectively.
Our study shows that in most countries PDR exceeded 10%, warranting the conduct of nationally representative surveys to confirm this trend. In the meantime, actions to prevent drug resistance, including transition from NNRTIs to more robust drug classes should be urgently implemented.
Introduction
HIV drug resistance (HIVDR) represents the ability of a virus to replicate in the presence of antiretroviral drugs (ARVs). RNA viruses such as HIV are highly prone to sporadic mutations due to the error-prone nature of their reverse transcriptase (RT) enzyme and the high viral replication turnover.1,2 HIV mutants with the ability to escape inhibitory substances are therefore common and this unstoppable virological process can significantly affect the management of this infection and is recognized as a major health problem for HIV treatment and future eradication.3 HIVDR can develop in individuals while on treatment through drug selection pressure [defined as acquired HIV drug resistance (ADR)]. ADR is generally associated with virological failure and thus forces treatment changes.4 In addition, a resistant virus may be present prior to ART initiation [known as pretreatment HIV drug resistance (PDR)]. PDR is also associated with poor response to first-line treatment, premature virological failure and further accumulation of drug resistance mutations (DRMs).5,6
In the context of low- and middle-income countries (LMICs), management of HIVDR is associated with major challenges that include: the high number of individuals on ART or in need of ART; difficulties in preventing ART failure owing to a lack of timely identification of virological failures, for example with routine viral load (VL) monitoring; and operational threats that affect the delivery of ART services (suboptimal retention on ART, poor adherence to ART and stock-outs of ARVs).7 Virological failure and subsequent development of ADR is therefore frequently reported in these countries.8,9 Since 2006, the WHO has recommended population-level investigations to assess and prevent PDR in LMICs and the majority of studies and surveys conducted to date indicate increasing levels of PDR, especially in sub-Saharan Africa.6,7,10,11 PDR in LMICs more often includes low levels of PI mutations (<2%–3%), moderate levels of NRTI mutations (∼5%) and moderate to elevated levels of NNRTI mutations (10%).7 Moreover, several studies reported increasing trends of PDR in LMICs, following ART rollout since the 1990s.12,13 A recently conducted systematic review and meta-analysis, representing up to 56 044 adults in 63 countries, found that the prevalence of pretreatment NNRTI resistance is rising, with a substantial annual increase in the odds of PDR of 23% (95% CI: 16%–29%) in southern Africa, 17% (95% CI: 5%–30%) in eastern Africa, 17% (95% CI: 6%–29%) in western and central Africa, 11% (95% CI: 5%–18%) in Latin America and the Caribbean, and 11% (95% CI: 2%–20%) in Asia.14
In July 2017, to respond to the continuous threat of increasing levels of PDR in LMICs, the WHO launched new guidelines on the public health actions to address PDR and mainly recommended the urgent introduction of alternative first-line ART regimens that do not contain NNRTIs (as defined in the 2016 WHO consolidated ARV guidelines15) in countries in which the prevalence of PDR to NNRTIs among people initiating first-line ART is ≥10%.16 Countries are therefore encouraged to conduct national-level studies to determine the level of PDR to NNRTIs and define further actions. However, such studies are costly and necessitate important human resources and operational logistics, and only a minority of countries have conducted or initiated such investigations.7 Therefore, alternative strategies should be considered to help to address this critical situation and guide urgent programmatic decisions.
In this study, we investigated PDR prevalence in ART initiators attending major ART clinics in five countries in West Africa (Burkina Faso, BF; Cameroon, CM; Côte d’Ivoire, CI; Mali, ML; and Togo, TG) and two countries in Southeast Asia (Thailand, TH; and Vietnam, VN).
Patients and methods
Study sites and participants
The study was designed as a pilot approach of the generic 2014 WHO PDR protocol.17 The study sites included seven countries: BF, CM, CI, ML and TG in West Africa; and TH and VN in Southeast Asia. In each site/country, participants were enrolled in one to five major ART clinics, mostly located in major and/or capital cities. These clinics included: CHU Médecine Interne/Maladies infectieuses in BF; Hôpital Central Yaoundé in CM; CIRBA and CEPREF in CI; Centre d’Ecoute de Soins et d’Animation Communautaire (CESAC) de Bamako and Unité de Soins et d’Animation Communautaire (USAC) in ML; CHU Sylvanus Olympio in TG; Chonburi, Mahasarakam and Phayao hospitals in TH; and OPC4, OPC8 and OPC Thu duc in VN. The annual patient population in these clinics was 4800, 9900, 8690, 9557, 6928, 3634 and 2779 individuals in BF, CM, CI, ML, TH, TG and VN, respectively. Access to VL monitoring in these clinics was only possible in BF, CI and TH. However, all the countries involved had capacity for VL testing.
The required sample size per site was estimated to be 175 and was calculated to obtain an estimate of drug resistance with a CI of ±5%, assuming drug resistance prevalence between 5% and 10%, and a genotyping failure rate of 10%. Participants were recruited if they were HIV-1 positive, aged ≥18 years, were initiating ART irrespective of their prior exposure status to ARVs and they provided written informed consent. Minimal sociodemographic and clinical data on participant age, gender, planned ART regimen and information on prior exposure to ARVs were collected using a questionnaire. Overall, patients were recruited from December 2015 to November 2016 but recruitment duration in each country did not exceed 6 months.
Laboratory strategies
In each country, whole blood samples were collected from eligible participants and sent within a maximum of 6 h to the dedicated genotyping laboratories for processing, storage of plasma aliquots at −80°C and subsequent analysis. HIVDR testing was performed on plasma specimens, using the National Agency for AIDS Research (ANRS) in-house protocol to amplify and sequence both viral protease and RT regions. Details of this protocol including primer sequences and PCR conditions are available online (http://www.hivfrenchresistance.org/ANRS-procedures.pdf). Relevant DRMs were identified using the Stanford algorithm, version 8.5 (https://hivdb.stanford.edu/hivalg/by-mutations/). All samples failing PCR amplification were tested for VL using the routine procedures in each laboratory to verify that the VL was not below the amplification threshold of the genotyping protocol (∼1000 copies/mL).
ARV plasma concentration determination
Since information on prior exposure status to ARVs was based on participant declarations that could not be verified, in contexts where unofficial circulation of ARVs cannot be excluded, we introduced ARV plasma concentration measures for all participants identified with major DRMs. This test was performed on plasma samples or dried plasma spots (DPSs). DPSs were prepared using stored plasma aliquots. Briefly, 50 μL of plasma was spotted onto each of the five circles of a 903 Whatman filter paper and dried at ambient temperature for 3 h. DPS cards were individually packed into zipper closure plastic bags containing two silica desiccants and stored at room temperature until shipment to the testing laboratory. Drug levels were measured using LC-MS assays with the lower limit of detection of 20 ng/mL for lamivudine, zidovudine, emtricitabine and tenofovir and 50 ng/mL for efavirenz and nevirapine.18
Statistical analysis
The outcomes generated included the overall PDR among all ART initiators and PDR among treatment initiators with and without prior exposure to ARVs. All analyses were performed using Stata (Stata 15, StataCorp, College Station, TX, USA). Proportions are presented with 95% CI.
Sequence accession number
Protease and RT sequences generated in this study are available in GenBank under the following accession numbers: MH623080–MH624103.
Ethics
The study protocol was approved by the National Ethics Committee of each of the seven countries where the study was conducted. All study participants provided written informed consent and anonymous identifiers were used throughout the study to safeguard participant confidentiality.
Results
Participant characteristics
Between December 2015 and November 2016, a total of 1153 participants were enrolled. These participants were from BF (n = 151), CM (n = 212), CI (n = 127), ML (n = 175), TG (n = 156), TH (n = 180) and VN (n = 152) (Table 1). Female participants predominated in West African sites, representing 59% to 75% of participants per site, whereas male participants represented the major group in the Asian population in TH and VN, 71% and 74% respectively. The median ages ranged between 31 years and 39 years and the median CD4 counts from 130 cells/mm3 to 405 cells/mm3. ARVs planned for ART initiation predominantly included tenofovir plus lamivudine plus efavirenz, 889/1135 (78%) overall. Other ARV combinations included tenofovir or zidovudine, plus lamivudine or emtricitabine, plus efavirenz or nevirapine (Table 1). Overall, 1052 out of 1136 (93%) participants indicated no prior exposure to ARVs and 83/1136 participants indicated potential prior exposure to ARVs. The highest level of prior exposure to ARV was observed in participants from TG, 23/156 (15%), and the lowest levels were observed in participants from CI and TH, 3% respectively. The main reasons for exposure to ARVs were ART and prevention of mother-to-child transmission (PMTCT) of HIV, respectively 44% and 52% overall.
Study population and characteristics
| BF | CM | CI | ML | TG | TH | VN | Overall | |
|---|---|---|---|---|---|---|---|---|
| Total recruited | 151 | 212 | 127 | 175 | 156 | 180 | 152 | 1153 |
| Female, n (%)a | 98 (65) | 134 (69) | 69 (59) | 110 (66) | 116 (75) | 53 (29) | 40 (26) | 620 (56) |
| Age, years, median (IQR)b | 37 (31–43) | 39 (31–46) | 39 (35–45) | 35 (30–42) | 37 (30–45) | 32 (25–41) | 31 (26–35) | 35 (30–43) |
| CD4 count, cells/mm3, median (IQR)c | 235 (88–348) | 226 (112–381) | 211 (189–293) | 130 (44–283) | 222 (96–392) | 268 (67–464) | 405 (244–503) | 223 (95–398) |
| First-line (planned)d | ||||||||
| TDF + 3TC + EFV | 8 (5) | 197 (94) | 100 (80) | 174 (99) | 127 (84) | 141 (79) | 142 (97) | 889 (78) |
| TDF + FTC + EFV | 113 (76) | 0 | 8 (6) | 0 | 0 | 4 (2) | 2 (1) | 127 (11) |
| TDF + 3TC + NVP | 6 (4) | 2 (1) | 0 | 0 | 0 | 4 (2) | 0 | 12 (1) |
| ZDV + 3TC + EFV | 15 (10) | 4 (2) | 5 (4) | 1 (1) | 0 | 12 (7) | 2 (1) | 39 (3) |
| ZDV + 3TC + NVP | 4 (3) | 7 (3) | 7 (6) | 0 | 18 (12) | 0 | 1 (1) | 37 (3) |
| other | 2 (1) | 0 | 5 (4) | 0 | 7 (5) | 17 (10) | 0 | 30 (3) |
| Previous exposure to ARVe | ||||||||
| no | 144 (97) | 191 (91) | 119 (97) | 165 (95) | 130 (85) | 173 (97) | 130 (87) | 1052 (93) |
| yes | 5 (3) | 20 (9) | 4 (3) | 8 (5) | 23 (15) | 5 (3) | 18 (12) | 83 (7) |
| unknown | 0 | 0 | 0 | 0 | 0 | 0 | 1 (1) | 1 (<1) |
| Type of exposure to ARV, n (%)f | ||||||||
| ART | 2 (40) | 12 (80) | 3 (75) | 2 (33) | 1 (5) | 0 | 13 (72) | 33 (44) |
| PMTCT | 3 (60) | 3 (20) | 0 | 4 (67) | 21 (95) | 5 (100) | 3 (17) | 39 (52) |
| other | 0 | 0 | 1 (25) | 0 | 0 | 0 | 2 (11) | 3 (4) |
TDF, tenofovir disoproxil fumarate; 3TC, lamivudine; FTC, emtricitabine; ZDV, zidovudine; EFV, efavirenz; NVP, nevirapine.
Data available for 1112 participants.
Data available for 1144 participants.
Data available for 1021 participants.
Data available for 1135 participants.
Data available for 1136 participants.
Data available for 75/83 participants.
Prevalence of PDR
Overall, 1020 nt sequences were successfully generated and were considered for interpretation analysis of HIVDR. The distribution of nt sequences per site was 94 in BF, 181 in CM, 127 in CI, 162 in ML, 130 in TG, 176 in TH and 150 in VN. HIV-1 subtype distribution included CRF02_AG (476), CRF01_AE (303), A (76), CRF06_cpx (59), G (25), B (19), CRF11_cpx (12), D (11), CRF09_cpx (9), C (5), F2 (5), CRF18_cpx (4), CRF13_cpx (3), K (3), H (2), single CRF08_BC, CRF25_cpx and CRF45_cpx sequences and 5 unclassified.
Overall, PDR prevalence was 15.9% (95% CI: 13.8%–18.3%) for any DRM and the level in each site was 9.6% (95% CI: 5.0%–17.6%) and 10.2% (95% CI: 6.5%–15.7%) in BF and TH respectively; 14.7% (95% CI: 9.8%–21.4%) and 15.4% (95% CI: 10.6%–21.9%) in VN and ML respectively; 16.5% (95% CI: 11.0%–24.2%) in CI; 19.3% (95% CI: 14.2%–25.8%) in CM; and 24.6% (95% CI: 17.9%–32.9%) in TG (Table 2). The overall PDR prevalence by ARV drug class was 3% for PI DRMs, 4% for NRTI DRMs and 12% for NNRTI DRMs. PI PDR prevalence was 1% in CI; 2% in BF, ML, TG and TH; 3% in CM; and 5% in VN. NRTI PDR prevalence was 1% in ML and VN; 3% in CM and TH; 4% in BF, 6% in CI; and 12% in TG. NNRTI PDR prevalence was 5% in TH; 6% in BF; 9% in VN; 14% in CI and ML, 17% in CM; and 18% in TG. The predominant PDR DRMs included: L33F, M46IL, Q58E and L90M for PIs; M41L, D67N, M184IV, T215FV and K219Q for NRTIs; and V108I, K103N, E138A, V179ET and G190A for NNRTIs.
HIV pretreatment DRM prevalence
| BF | CI | CM | ML | TG | TH | VN | Overall | |
|---|---|---|---|---|---|---|---|---|
| Total sequences interpreted | 94 | 127 | 181 | 162 | 130 | 176 | 150 | 1020 |
| DRMs, n (%) | ||||||||
| PI | 2 (2) | 1 (1) | 5 (3) | 3 (2) | 2 (2) | 4 (2) | 8 (5) | 25 (3) |
| NRTI | 4 (4) | 8 (6) | 5 (3) | 2 (1) | 16 (12) | 5 (3) | 2 (1) | 42 (4) |
| NNRTI | 6 (6) | 18 (14) | 30 (17) | 22 (14) | 23 (18) | 9 (5) | 13 (9) | 121 (12) |
| NRTI or NNRTI | 8 (9) | 20 (16) | 31 (17) | 22 (14) | 30 (23) | 14 (8) | 14 (9) | 139 (14) |
| NRTI and NNRTI | 2 (2) | 6 (5) | 4 (2) | 2 (1) | 9 (7) | 0 | 1 (1) | 24 (2) |
| Percentage HIVDR (95% CI) | 9.6 (5.0–17.6) | 16.5 (11.0–24.2) | 19.3 (14.2–25.8) | 15.4 (10.6–21.9) | 24.6 (17.9–32.9) | 10.2 (6.5–15.7) | 14.7 (9.8–21.4) | 15.9 (13.8–18.3) |
Overall, 940 sequences were generated from participants who declared no prior exposure to ARVs. The proportion of sequences carrying any DRM in this group was 14.3% (134/940). Sixty-three sequences were generated from participants who declared prior exposure to ARV and 38.1% (24/63) carried a least one DRM. Measurement of ARVs in plasma indicated the presence of drug in the plasma of 12 participants, mostly efavirenz plus lamivudine plus tenofovir, of whom 5 declared no prior exposure to ARVs. We found no drugs in the plasma of the remaining 106 participants tested.
Baseline viral susceptibility
Results generated with the Stanford algorithm showed the effects of the identified DRMs on susceptibility to all NRTIs, to which 1.7% to 2.9% of viruses were predicted to have some resistance. The highest effects were observed for lamivudine and emtricitabine, with prediction of 2.2% high-level resistance (Figure 1). For NNRTIs, 7.1% and 8.6% of viruses were predicted to be resistant to nevirapine and efavirenz, respectively, and 2.7% and 6.3% of viruses were predicted to have some resistance to etravirine and rilpivirine, respectively. Almost no virus was predicted to be resistant to any PI.
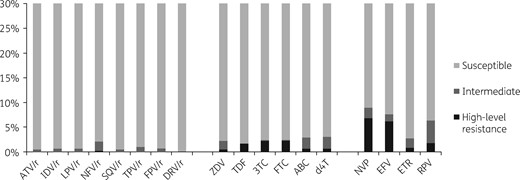
Predicted efficacy of ARVs using Stanford HIVdb algorithm, version 8.5. 3TC, lamivudine; ABC, abacavir; ATV, atazanavir; ZDV, zidovudine; d4T, stavudine; DRV, darunavir; EFV, efavirenz; ETR, etravirine; FPV, fosamprenavir; FTC, emtricitabine; IDV, indinavir; LPV, lopinavir; NFV, nelfinavir; NVP, nevirapine; RPV, rilpivirine; SQV, saquinavir; TDF, tenofovir disoproxil fumarate; TPV, tipranavir; ‘/r’ indicates ritonavir boosted.
Discussion
HIVDR in people starting ART is currently recognized as a major public health threat in LMICs. Indeed, high prevalence of PDR negatively affects the success of the public health response to the treatment of HIV and potentially endangers the attainment of the global targets to end the AIDS epidemic.19 To address that growing issue, the WHO has recently provided guidelines on the public health response to PDR.16 A key point in those guidelines is the fact that countries are encouraged to introduce non-efavirenz/nevirapine first-line drugs for ART initiators if nationally representative PDR to NNRTIs is ≥10%.
In this study, we assessed PDR in major ART delivery services in seven countries considered LMICs. Data were not generated at the national level, but we targeted major clinics that deliver ART in the countries. PDR prevalence for any DRM ranged from 10% to 25%, with the lowest prevalence observed in BF and TH and the highest level observed in TG. More importantly, prevalence of PDR to PIs and NRTIs was relatively low, respectively 3% and 4% overall, but PDR to NNRTIs represented the major contribution to HIV resistance in ART initiators in the seven countries. PDR to NNRTIs was found at 5% to 6% prevalence in BF and TH and reached 18% in TG, illustrating the high contribution of this class of DRM to PDR in all study sites. Similar findings were recently reported from other studies, including those conducted at the national level. A nationally representative study from Mexico recently reported 15.5% PDR prevalence and 10.6% for NNRTIs only.10 Bissio et al.11 recently reported 14% PDR prevalence in Argentina at the national level, with 2%, 3% and 11% prevalence for PIs, NRTIs and NNRTIs respectively. In addition, several sources of evidence indicate increasing levels of PDR alongside ART expansion in LMICs. A 2016 study from Kenya reported a PDR increase from 4% in 2006 to 11% in 2014 and predominance of NNRTI PDR.13 A recent meta-analysis reported levels of PDR to NNRTIs from 7.2% to 11% in sub-Saharan Africa, as well as significant increases per year.14 In our study, PDR in people with prior ARV exposure was extremely high, reaching almost 40%, and was more than 2.5 times higher than the prevalence in those with no prior exposure to ARVs. Other studies have reported similar findings11 and in its systematic review the WHO identified prior exposure to ARVs as independently associated with high risk of PDR.16 Our results, although not representing countries at the national level, indicate high levels of PDR in LMICs and call for urgent action.
The WHO has recently recommended revision of first-line ART regimens in countries where nationally representative PDR to NNRTIs is ≥10%. This revision mainly consisted of introducing non-efavirenz/nevirapine regimens, thus excluding these historically used NNRTI drugs, intensively used in previous PMTCT programmes in LMICs and characterized by their very low genetic barrier to resistance.20 Dolutegravir, a second-generation integrase strand transfer inhibitor (INSTI), has been recommended because of its outstanding antiviral potency, good tolerability and, more importantly, higher genetic barrier to resistance.21,22 Cost-effectiveness modelling studies have also indicated that transition from first-line regimens containing NNRTIs to regimens containing dolutegravir in adult ART initiators in LMICs was cost-effective at any prevalence of NNRTI PDR.23 However, field data from resource-limited settings on viral suppression and drug resistance when using dolutegravir are still limited and such studies should be implemented. Moreover, a recent surveillance study in Botswana reported an increased risk of neural tube defects in babies born to women who became pregnant while receiving dolutegravir (http://www.who.int/medicines/publications/drugalerts/Statement_on_DTG_18May_2018final.pdf) and therefore raised concerns about its safety at the population level. Options other than dolutegravir to replace NNRTIs are thus still needed. In addition, ART programmes should still be encouraged to implement and promote good practices that can contribute to the prevention of PDR, especially by reducing virological failure and acquisition of viral resistance in patients under ART. It is obvious that high prevalence of ADR leads to increasing PDR prevalence. In fact, in this study we observed high PDR prevalence in sites where we previously reported high prevalence of ADR and we found low levels of PDR in sites where we had reported low ADR prevalence.8 We conducted the ANRS 12186 study reporting ADR data from 2009–11, and ADR levels were 2.1% in BF, 9.8% in CI, 10.5% in CM, 29.1% in TG, 3.3% in TH and 8.3% in VN.
In conclusion, PDR prevalence is significantly high in the majority of LMICs and is mostly driven by resistance to NNRTIs, essentially efavirenz and nevirapine. Although not representing countries at the national level, our results provide important information for programmes and decision-makers and advocate for implementation of nationally representative studies. The recent WHO recommendation to phase out efavirenz and nevirapine in first-line regimens should be considered at any PDR prevalence and not only at the 10% threshold. In addition, ART programmes should still be encouraged to prevent HIVDR, especially by increasing access to VL monitoring.
Acknowledgements
We thank all patients who participated in this study, medical staff and the national health authorities of Burkina Faso, Cameroon, Côte d’Ivoire, Mali, Thailand, Togo and Vietnam.
Members of the ANRS 12333 Study Group
Avelin F. Aghokeng, Ahidjo Ayouba, Françoise Brun-Vézinet, Marie-Laure Chaix, Vincent Calvez, Anoumou Dagnra, Diane Descamps, Kania Dramane, Isabelle Fournier, Almoustapha Maiga, Laure-Amélie de Monteynard, Janin Nouhin, Coumba Touré Kane, Truong Xuan Lien, Nicole Ngo-Giang-Huong, Martine Peeters, Jean-Christophe Plantier, Richard Njouom, Edouard Tuaillon, Claire Rekacewicz and Toni Thomas d’Aquin (AC43 ANRS Resistance Working group); Armel Poda, Jacques Zougrana, Saidou Ouedraogo and Macaire Ouedraogo (collaborators in Burkina Faso); Armando Djiyou Djeuda, Charles Kouanfack, Nadia Mandeng and Eitel Mpoudi-Ngole (collaborators in Cameroon); Eugene Messou, Dechi Jean Jacques and Jean François Nguessan (collaborators in Côte D’Ivoire); Oumar Dolo, Zoumana Diarra and Mamadou Cisse (collaborators in Mali); Akouda Patassi, Mounérou Salou and Komla Ali-Edjé (collaborators in Togo); Chureeratana Bowonwatanuwong, Suchart Thongpaen, Virat Klinbuayaem and Laddawan Laomanit (collaborators in Thailand); and Que Anh Luong and Ton Tran (collaborators in Vietnam).
Funding
This work was supported by the French National Agency for research on AIDS and Viral Hepatitis under the terms of ANRS 12333.
Transparency declarations
None to declare.
References
Author notes
Members are listed in the Acknowledgements section.
