


Abstract
Emerging resistance to antiretroviral drugs may jeopardize the achievements of improved access to ART. We compared the prevalence of different resistance mutations in HIV-infected adults with virological failure in a cohort with regular routine viral load (VL) monitoring (Switzerland) and cohorts with limited access to VL testing (Uganda and Lesotho).
We considered individuals who had genotypic resistance testing (GRT) upon virological failure (≥1000 copies/mL) and were on ART consisting of at least one NNRTI and two NRTIs. From Lesotho, individuals with two subsequent VLs ≥1000 copies/mL despite enhanced adherence counselling (n = 58) were included in the analysis. From Uganda, individuals with a single VL ≥1000 copies/mL (n = 120) were included in the analysis. From the Swiss HIV Cohort Study (SHCS), a population without history of monotherapy or dual therapy with the first GRT upon virological failure (n = 61) was selected.
We found that 50.8% of individuals in the SHCS, 72.5% in Uganda and 81.0% in Lesotho harboured HIV with high-level resistance to at least two drugs from their current regimen. Stanford resistance scores were higher in Uganda compared with Switzerland for all drugs used in first-line treatment except zidovudine and tenofovir (P < 0.01) and higher in Lesotho compared with Uganda for all drugs used in first-line treatment except zidovudine (P < 0.01).
Frequent VL monitoring and possibly pretreatment GRT as done in the SHCS pays off by low levels of resistance even when treatment failure occurs. The high-level resistance patterns in Lesotho compared with Uganda could reflect a selection of strains with multiple resistance during enhanced adherence counselling.
Introduction
Emerging HIV resistance to currently used first- and second-line ART in Sub-Saharan Africa endangers the success of the universal test-and-treat strategy.1 In the 2017 HIV Drug Resistance Report,2 the WHO stressed the need to scale up viral load (VL) testing, promptly switch treatment of individuals with confirmed virological failure and strengthen adherence support. The report emphasizes the necessity for further documentation of ART resistance in individuals failing therapy.
Since 2013 the WHO has recommended routine VL monitoring in resource-limited settings at 6 months after ART initiation and then at least every 12 months thereafter.3 For individuals with VLs ≥1000 copies/mL enhanced adherence counselling (EAC) is recommended for 3–6 months followed by a confirmatory VL. Sustained VL ≥1000 copies/mL shall then trigger the switch to second-line ART.4 However, regular VL monitoring and genotypic resistance testing (GRT) remain out of reach for many ART programmes in Sub-Saharan Africa5,6 and data on resistance remain limited.
Here, we report and compare genotypic resistance patterns in two Sub-Saharan African cohorts (Uganda and Lesotho)7,8 prior to access to routine VL monitoring who had virological failure while taking first-line NNRTI-containing ART. Data are compared with a sub-cohort of the Swiss HIV Cohort Study (SHCS) taking NNRTI-based ART who had regular routine VL monitoring and a first-time GRT upon presentation with VL ≥1000 copies/mL. As resistance mutations impact therapeutic outcomes, GRT has been done routinely in the SHCS since 2002 before starting treatment and before switching regimens upon viral failure. However, GRT remains costly and is therefore reserved for research or privately paid for in resource-limited countries, e.g. Uganda and Lesotho.
Methods
Study design and participants
Our study population is diverse, including an African rural population from Lesotho, an African urban population from Uganda and individuals enrolled in the SHCS. The Lesotho population-based HIV impact assessment 2016–17 estimated that the HIV prevalence of individuals aged 15–59 years in Lesotho was 25.6%,9 whereas according to the Ugandan population-based HIV impact assessment 2016–17 the HIV prevalence was 6.2% among adults aged 15–64 years10 and in Switzerland, HIV prevalence was ∼0.2% in 2016.11
In Uganda, a cross-sectional study was performed at the Infectious Diseases Institute, Makerere University in Kampala, Uganda, in 2015. The setting has been described previously.8 Participants were included in our comparison analysis when they fulfilled the following criteria: (i) sequencing upon VL ≥1000 copies/mL, and (ii) treatment failure defined as one VL ≥1000 copies/mL with WHO-recommended first-line ART consisting of two NRTIs plus an NNRTI. This study was reviewed and approved by the Makerere University Faculty of Biomedical Research and Ethics Committee and the Uganda National Council for Science and Technology. Written informed consent was obtained from all participants prior to enrolment.
In Lesotho, participants were recruited in 2014 for a cross-sectional study that assessed virological outcomes and comorbidities among individuals attending routine ART care. The setting has been described previously.7 The eligibility criterion was prior continuous first-line ART for ≥6 months. Participants were included in our comparison analysis when they fulfilled the following criteria, i.e. (i) two subsequent unsuppressed VLs (≥1000 copies/mL) despite EAC and sequencing done upon the second unsuppressed VL, and (ii) treatment failure defined as two VLs ≥1000 copies/mL with WHO-recommended first-line ART consisting of two NRTIs plus an NNRTI. This study was approved by the Ethics Committee of the Ministry of Health of Lesotho. Written informed consent was obtained from all participants prior to enrolment.
The SHCS is a nation-wide, observational study that started to collect data and store blood samples from all participants in 1995 and includes clinical data from 1981 onwards.12 Participants were included in our comparison analysis if they fulfilled the following inclusion criteria: (i) sequencing upon first VL ≥1000 copies/mL; (ii) NNRTI- and NRTI-based treatment regimen at the time of failure, defined as one VL ≥1000 copies/mL; (iii) the same regimen for at least 24 weeks; and (iv) no history of monotherapy or dual therapy. The SHCS was approved by the Ethics Committees of the participating institutions and written informed consent was obtained from all participants.
Resistance mutations and resistance scores
We aligned the viral sequences to HXB2 (positions 2253–3870) using the software MUSCLE13 and custom scripts (R version 3.3.2). Using the software trimAl for the automated removal of poorly aligned regions with a cut-off of 80%,14 we got an alignment of 1187 nucleotides. Removing insertions from the alignment, we still had a median sequence length of 1175 in Lesotho and 1187 in Uganda and the SHCS—variations in length did not lead to a difference in the number of resistance mutations that were detected. We used Python 2.7 and the package sierrapy to obtain the resistance mutations and resistance scores from the Stanford Drug Resistance Database. We considered Stanford resistance scores against the following antiretrovirals used in first-line therapy: tenofovir disoproxil fumarate; zidovudine; lamivudine or emtricitabine; abacavir; efavirenz; and nevirapine. Scores between 15 and 29 indicate low-level resistance, scores between 30 and 59 intermediate resistance and scores of ≥60 high-level resistance.15
Statistical analysis
The resistance scores were compared using the Wilcoxon rank sum test with continuity correction.
Results
Table 1 displays characteristics of the three cohorts. In comparison with individuals from the two African settings, the population from the SHCS is dominated by older male individuals. The median HIV-1 copies/mL plasma RNA values at treatment failure were the highest in Uganda (24 613.5) and the lowest in the SHCS (10 244), whereas the median CD4+ T cells/mm3 were the lowest in Uganda (257.5) and the highest in the SHCS (431). In terms of regimens at treatment failure, there was a similar distribution of NNRTIs, but more variability in terms of NRTIs. Notably, in Uganda 15.0% of individual genotyping did not reveal low-level resistance (or higher) to any drug of their ART regimen at virological failure, whereas in Switzerland this was the case for 31.2% and in Lesotho for 6.9% of the individuals. In Uganda 15.0%, in Lesotho 39.7% and in the SHCS 3.3% of the individuals had high-level resistance to all three drugs of their first-line regimen. A high number of individuals (72.5% in Uganda, 81.0% in Lesotho and 50.8% in the SHCS) harboured HIV with high-level resistance to at least two drugs of their first-line regimen (Table 1), implying they were at most on one ‘fully active’ drug at the time of treatment failure. In our Supplementary data (available at JAC Online), this analysis was repeated only considering resistance to NRTIs, as they are the most essential for future treatment limitations in these patients.
Individuals’ characteristics at time of virological failure stratified by the geographical setting
| Setting | |||
|---|---|---|---|
| Uganda | Lesotho | SHCS | |
| Characteristics | |||
| n | 120 | 58 | 61 |
| male, % | 30 | 31.03 | 70.49 |
| age, years, median (IQR) | 35 (28–42) | 40.79 (32.37–49.63) | 48 (42–54) |
| HIV-1 copies/mL plasma RNA, median (IQR) | 24 613.5 (8381.25–82 742) | 11 000.15 (4801.56–36 490.08) | 10 244 (2720–49 500) |
| CD4+ T cells/mm3, median (IQR) | 257.5 (103.25–404.5) | 278 (162–435) | 431 (219–551) |
| time since first ART, years, median (IQR) | 3.36 (1.86–5.18) | 4.9 (2.79–6.24) | 2.05 (0.96–5.78) |
| Current ART containing, % | |||
| tenofovir disoproxil fumarate | 49.17 | 50 | 36.07 |
| zidovudine | 51.67 | 50 | 36.07 |
| lamivudine or emtricitabine | 100 | 100 | 90.16 |
| abacavir | 0 | 0 | 14.75 |
| efavirenz | 51.67 | 60.34 | 62.3 |
| nevirapine | 47.5 | 39.66 | 34.43 |
| At least low-level resistance to drugs of current ART regimen, % | |||
| to zero drugs | 15 | 6.9 | 31.15 |
| to at least one drug | 85 | 93.1 | 68.85 |
| to at least two drugs | 75 | 84.48 | 55.74 |
| to at least three drugs | 49.17 | 67.24 | 29.51 |
| At least intermediate-level resistance to drugs of current ART regimen, % | |||
| to zero drugs | 15.83 | 8.62 | 36.07 |
| to at least one drug | 84.17 | 91.38 | 63.93 |
| to at least two drugs | 74.17 | 82.76 | 54.1 |
| to at least three drugs | 39.17 | 65.52 | 21.31 |
| High-level resistance to drugs of current ART regimen, % | |||
| to zero drugs | 16.67 | 8.62 | 36.07 |
| to at least one drug | 83.33 | 91.38 | 63.93 |
| to at least two drugs | 72.5 | 81.03 | 50.82 |
| to at least three drugs | 15 | 39.66 | 3.28 |
Drugs of current ART regimen: at least low-level resistance corresponds to a Stanford resistance score of at least 15, at least intermediate-level resistance corresponds to a Stanford resistance score of at least 30 and high-level resistance corresponds to a Stanford resistance score of at least 60.
Considering all resistance mutations that appeared at least 15 times in our combined dataset, for the majority of resistance mutations their frequency was highest in Lesotho, followed by Uganda (Figure 1a). Notably, 65.8% of individuals with treatment failure in Uganda exhibited the M184V mutation while in Lesotho it was 79.3% and in the SHCS 42.6%. The second most frequent resistance mutation was K103N, appearing in 46.7%, 48.3% and 34.4% of individuals from Uganda, Lesotho and the SHCS, respectively. The K65R mutation was present in 20.8% in Uganda, in 31% in Lesotho and in 13.1% in the SHCS. An analysis without the threshold of 15 can be found in our Supplementary data (Section 2).
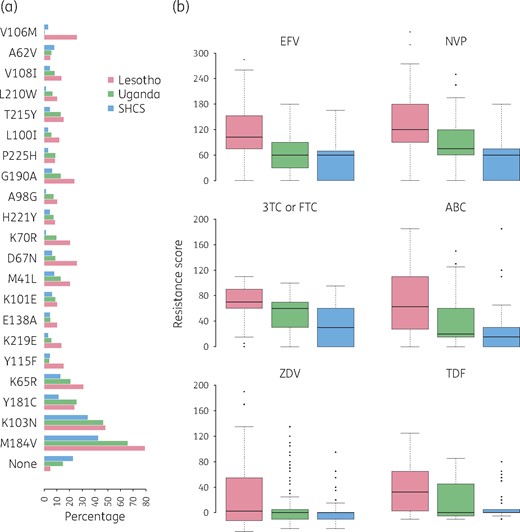
(a) Bar plot showing the percentage of individuals exhibiting the resistance mutations named on the y-axis upon virological failure, stratified by setting. (b) Box plot of resistance scores to EFV, NVP, 3TC or FTC, ABC, ZDV and TDF. The black line in each box represents the median value, and the box depicts the IQR. Whiskers extend to 1.5× IQR (which represents the default in R). Points above and below the whiskers represent outliers. EFV, efavirenz; NVP, nevirapine; 3TC or FTC, lamivudine or emtricitabine; ABC, abacavir; ZDV, zidovudine; TDF, tenofovir disoproxil fumarate. This figure appears in colour in the online version of JAC and in black and white in the print version of JAC.
To quantify the impact of the detected resistance mutations, we considered Stanford resistance scores to the antiretroviral drugs frequently used (Figure 1b). Notably, resistance scores were particularly high for NNRTIs in Lesotho, with a median resistance score of 102.5 to efavirenz and 120 to nevirapine (Stanford threshold for high-level resistance is 60). We compared the resistance scores of the three settings and found that resistance scores for both efavirenz and nevirapine were significantly higher in Lesotho than in Uganda (P < 0.01) and at the same time resistance scores in Uganda were significantly higher than in the SHCS (P < 0.01). For all NRTIs tested, except zidovudine, the population from Lesotho exhibited significantly higher resistance scores compared with Uganda (P < 0.01). At the same time, for lamivudine or emtricitabine and abacavir the population from Uganda exhibited significantly higher resistance scores compared with the SHCS (P < 0.01). We included a regression analysis in our Supplementary data, which showed that the resistance scores were not driven by the time of exposure to ART (Figure S1, available as Supplementary data).
Discussion
Compared with Uganda and Lesotho, we found low resistance scores among individuals with virological failure in the SHCS. This can most likely be explained by the frequent virological monitoring in SHCS (VL in general every 3 months but at least twice a year) leading to early detection of virological failure or periods of poor adherence before acquisition of multiple drug resistance mutations. In addition, VL testing is repeated within 2–4 weeks if a VL is >50 copies/mL as recommended in resource-rich settings.16 A regression analysis (Supplementary data, Section 1) confirmed that the resistance score differences were after correction for different risk factors still driven by the cohorts, which supports the hypothesis of infrequent versus frequent VL monitoring as the cause of the resistance score differences. This finding is in line with the large differences in the frequency of major resistance mutations in virologically failing patients under infrequent versus frequent VL monitoring previously described.17 Timely detection of treatment failure in the SHCS is reflected in the comparatively low VLs and high CD4+ T cell counts in this population (Table 1). In Lesotho and Uganda, ART monitoring was performed using immunological and clinical criteria at the time the studies were conducted, which have poor positive predictive values for virological failure.18 More than half of the individuals from the SHCS included in this study had pre-ART GRT to guide first-line therapy choices and avoid virological failure in the case of transmitted drug resistance,19 which could contribute to the low resistance patterns.
This study is not without limitations. As pre-ART GRT is currently not feasible in resource-limited settings and was not performed in the SHCS before 2002 on a routine basis, we might not only observe acquired but also pretreatment drug resistance in our analysis in Lesotho, Uganda and partly in the SHCS. Although, for the latter, systematic retrospective sequencing from biobank samples has improved coverage of drug-naive patients.20 Additionally, the different subtype distributions could lead to differences in the acquisition of mutations. As the patterns of frequency differences among the settings are not driven by specific mutations, it is likely that only a small but unknown fraction of the differences can be explained by subtype.
Further, the interpretation of the effect of the 3 month EAC period in Lesotho on the high-level resistance patterns in this setting is challenging. The causality between adherence, resistance and treatment failure is complex and cannot be fully disentangled: non-adherence can cause virological failure directly and/or resistance, resistance causes therapy failure and at the same time, being and remaining on a failing regimen causes further resistance. One hypothesis is that with EAC individuals with treatment failure, which cannot only be explained by non-adherence at the time of GRT, are selected. Another hypothesis is that the high-level resistance patterns observed in Lesotho reflect the development of further resistance mutations during EAC, while individuals stay on a failing regimen.
The high number of individuals with resistance to all drugs after their first-line regimen failure is a serious public health concern, particularly considering the spread of pretreatment drug resistance, which is known to be on the rise.2 This trend will not solely be reversed with the introduction of dolutegravir in Sub-Saharan Africa, as dolutegravir will also be prescribed with an NRTI backbone. Even though challenges of virological monitoring include costs, complexity and both patient and clinician awareness,21 our results highlight the importance of further upscaling virological monitoring in resource-limited settings.
Acknowledgements
We thank the patients for their participation, the study nurses and physicians for their excellent patient care, A. Scherrer, A. Traytel and S. Wild for their excellent data management and D. Perraudin and M. Amstutz for their administrative assistance.
Members of the Swiss HIV Cohort Study
Anagnostopoulos A, Battegay M, Bernasconi E, Böni J, Braun DL, Bucher HC, Calmy A, Cavassini M, Ciuffi A, Dollenmaier G, Egger M, Elzi L, Fehr J, Fellay J, Furrer H, Fux CA, Günthard HF (President of the SHCS), Haerry D (deputy of ‘Positive Council’), Hasse B, Hirsch HH, Hoffmann M, Hösli I, Huber M, Kahlert CR (Chairman of the Mother & Child Substudy), Kaiser L, Keiser O, Klimkait T, Kouyos RD, Kovari H, Ledergerber B, Martinetti G, Martinez de Tejada B, Marzolini C, Metzner KJ, Müller N, Nicca D, Paioni P, Pantaleo G, Perreau M, Rauch A (Chairman of the Scientific Board), Rudin C, Scherrer AU (Head of Data Centre), Schmid P, Speck R, Stöckle M (Chairman of the Clinical and Laboratory Committee), Tarr P, Trkola A, Vernazza P, Wandeler G, Weber R, Yerly S.
Funding
This study was partly supported by Swiss National Science Foundation grant BSSGI0_155851 (to R. D. K.). J. F. received project and travel grants from AbbVie, Gilead Sciences, Janssen, Merck and ViiV Healthcare. N. D. L. received travel grants from Gilead Sciences Sarl to the following conferences: HIV Glasgow 2016 and CROI 2018. The Resistance in HIV-infected individuals in North and South (RHINOS) study was supported by Gilead Sciences and the Swiss HIV Cohort Study. This project was supported in part by the SystemsX project (hiv.x) no. 51MRPO 158328.
Transparency declarations
None to declare.
References
Author notes
Authors Nadine Bachmann, Amrei von Braun and Niklaus D. Labhardt contributed equally.
Authors Roger D. Kouyos and Jan Fehr contributed equally.
Members are listed in the Acknowledgements section.
