


Background: Antibiotic stewardship is a required organizational practice for Canadian acute care hospitals, yet data are scarce regarding the quantity and composition of antibiotic use across facilities. We sought to examine the variability, and risk-adjusted variability, in antibiotic use across acute care hospitals in Ontario, Canada’s most populous province.
Methods: Antibiotic purchasing data from IMS Health, previously demonstrated to correlate strongly with internal antibiotic dispensing data, were acquired for 129 Ontario hospitals from January to December 2014 and linked to patient day (PD) denominator data from administrative datasets. Hospital variation in DDDs/1000 PDs was determined for overall antibiotic use, class-specific use and six practices of clinical or ecological significance. Multivariable risk adjustment for hospital and patient characteristics was used to compare observed versus expected utilization.
Results: There was 7.4-fold variability in the quantity of antibiotic use across the 129 acute care hospitals, from 253 to 1873 DDDs/1000 PDs. Variation was evident within hospital subtypes, exceeded that explained by hospital and patient characteristics, and included wide variability in proportion of broad-spectrum antibiotics (IQR 36%–48%), proportion of fluoroquinolones among respiratory antibiotics (IQR 40%–62%), proportion of ciprofloxacin among urinary anti-infectives (IQR 44%–60%), proportion of antibiotics with highest risk for Clostridium difficile (IQR 29%–40%), proportion of ‘reserved-use’ antibiotics (IQR 0.8%–3.5%) and proportion of anti-pseudomonal antibiotics among antibiotics with Gram-negative coverage (IQR 26%–40%).
Conclusions: There is extensive variability in antibiotic use, and risk-adjusted use, across acute care hospitals. This could motivate, focus and benchmark antibiotic stewardship efforts.
Introduction
Antibiotic resistance has emerged as a critical public health concern. Coupled with the slowing of new drug synthesis, increased resistance leaves clinicians with limited effective antibiotic choices,1–3 and is associated with greater morbidity, mortality and healthcare expenditures.2,4 One of the main drivers of resistance is excessive and inappropriate inpatient antibiotic use.2 Antibiotic prescriptions in hospitals are increasing worldwide,5,6 and up to 50% may be unnecessary or inappropriate.7,8
Antibiotic stewardship, which promotes prudent antibiotic prescribing while limiting inappropriate use, has been widely accepted as a critical intervention against resistance. However, the lack of systematic and accurate assessments of hospital-level antibiotic utilization presents a major obstacle, as stewardship programmes are unable to evaluate intra-hospital use and make inter-hospital comparisons. The CDC and the Association of Medical Microbiology and Infectious Diseases Canada have identified significant gaps in the monitoring of antibiotic use in North America.9,10 In Canada, measurement has only been analysed at the provincial level,11 with no comparisons between individual hospitals. Furthermore, joint guidelines by the IDSA and the Society for Healthcare Epidemiology of America for the development of stewardship programmes have recommended risk adjustment in order to benchmark antibiotic use across hospitals, but efforts so far have been limited.7 We sought to describe the quantity, composition and variability of inpatient antibiotic use across acute care hospitals in Ontario, the most populous province in Canada, and apply risk-adjustment methods to facilitate inter-hospital comparisons.
Methods
General study design
We conducted a province-wide analysis of antibiotic utilization among acute care hospitals in Ontario between 1 January 2014 and 31 December 2014.
Ethics
Study approval was obtained from the Research Ethics Board of Sunnybrook Health Sciences Centre, Toronto, Ontario, Canada.
Data sources
Antibiotic purchasing data were obtained from IMS Health, an international organization that provides information to the healthcare industry. The IMS Health Canadian Drug Store and Hospital Purchases Audit captures both direct drug sales from pharmaceutical manufacturers and indirect drug sales from wholesalers and warehouses to hospitals and pharmacies across Canada.12 Our dataset comprised the monthly quantities of individual antibiotics purchased by all hospitals across Ontario. Validation of this dataset confirmed a strong correlation with internal hospital records of antibiotic dispensing (correlation coefficient 0.88–0.91), substantiating it as an appropriate overall surrogate for antibiotic consumption.13 This strong correlation between antibiotic purchasing and dispensing data persisted at calendar intervals as short as 3 months.13 In the same validation study we determined that the parenteral formulations of nine antibiotics were consistently underestimated in the purchasing data from IMS Health: cefazolin, ceftazidime, cefuroxime, ciprofloxacin, levofloxacin, metronidazole, penicillin G, tobramycin and vancomycin. Therefore some potentially informative analyses involving these particular drugs were precluded.
These purchasing data were linked, at the hospital level, to well-validated healthcare administrative databases housed at the Institute for Clinical Evaluative Sciences (ICES). The Canadian Institutes of Health Information Discharge Abstracts Database describes all hospitalization events in Ontario; the Canadian Institutes of Health Information Same-Day Surgery database details all same-day surgeries in Ontario.
Data on antibiotic utilization
We included all systemic antibacterials administered via the enteral or parenteral route. Antifungal, antimycobacterial and anti-inflammatory agents, as well as local and topical treatments, were excluded. Antibiotic use was calculated in DDDs, a measure of drug use developed by WHO that standardizes drug consumption based on an assumed average daily maintenance dose.14 We omitted antibiotics, such as tigecycline, with low utilization across all hospitals in the IMS database (defined as <1 DDD/hospital/month), since estimates of their use would likely be imprecise.
Antibiotics were grouped by generic drug names and into the following pharmacological classes: tetracyclines, penicillins, cephalosporins, carbapenems, trimethoprim and/or sulphonamides, macrolides, lincosamides, aminoglycosides, fluoroquinolones, glycopeptides, metronidazole, nitrofurans, oxazolidinones and other antibacterials.
Data on acute care hospitals and hospitalizations
Hospitals that specialized only in psychiatric, surgical, outpatient, rehabilitation or long-term geriatric care were excluded. We also excluded two hospitals that purchased antibiotics for several nursing station outposts in their area, since inpatient antibiotic use would be overestimated by their purchasing data. Hospitals with shared purchasing or pooled administrative data were combined, such as multiple individual hospital sites within a single hospital corporation.
The number of patient days (PDs) from inpatient admissions and same-day surgeries in 2014 at each hospital was obtained from the administrative databases. We also collected information on hospital and patient characteristics that may influence the quantity and composition of antibiotic utilization. Hospital characteristics included hospital type (teaching, large community, medium community, small community),15–17 location (urban, rural), average resource intensity weight,18–20 presence of an infectious diseases physician,17 proportion of admissions by service (medical, surgical, maternal/obstetrical, neonatal, mental health)16,17,21–23 and by length of stay (proportion of admissions <2 days or >10 days in length),15,23,24 as well as proportion of admissions that were elective, that were transferred from other acute care hospitals, and that included an ICU stay.17,18 Aggregate patient characteristics included age and sex. Teaching hospitals were categorized based on full affiliation with the Council of Academic Hospitals of Ontario.25 Large, medium and small community designations were based on hospital volume.26 Resource intensity weights are measures of a hospital’s case mix complexity;27 we calculated the average resource intensity weight across all diagnosis-related groups. Hospitals with 52 or more infectious diseases consultation codes in 2014 (i.e. average of at least one consultation per week) were identified as having an available infectious diseases physician.
Outcome definition
The primary outcome was the total DDDs of all antibiotics used per 1000 PDs (DDDs/1000 PDs) at each hospital. This was calculated as the DDDs of antibiotics purchased by a hospital in 2014 (numerator) divided by its total PDs in 2014 (denominator) multiplied by 1000. We also calculated the DDDs/1000 PDs for each individual antibiotic drug and class.
The secondary outcomes evaluated a series of antibiotic use practices with high clinical or ecological significance. The following proportions were calculated for each hospital: the proportion of all antibiotics that were broad-spectrum (carbapenems, fluoroquinolones, glycopeptides, oxazolidinones, penicillin and β-lactamase inhibitor combinations, third-generation cephalosporins); the proportion of oral respiratory antibiotics (levofloxacin, moxifloxacin, clarithromycin, azithromycin) that were respiratory fluoroquinolones; the proportion of oral urinary anti-infectives (ciprofloxacin, nitrofurantoin, trimethoprim/sulfamethoxazole) that were ciprofloxacin; the proportion of all antibiotics that were high-risk for Clostridium difficile infection (clindamycin, fluoroquinolones, third-generation cephalosporins);28,29 the proportion of all antibiotics that were ‘reserved-use’ (daptomycin, ertapenem, linezolid, meropenem); and the proportion of antibiotics with Gram-negative coverage (aminoglycosides, second- and third-generation cephalosporins, fluoroquinolones, colistin, carbapenems, piperacillin/tazobactam, trimethoprim/sulfamethoxazole) that were anti-pseudomonal (aminoglycosides, ceftazidime, ciprofloxacin, colistin, meropenem, piperacillin/tazobactam).
Statistical analysis
Descriptive analyses
Descriptive analyses, comprising frequencies, and medians and IQRs of frequencies, were performed to examine the characteristics of Ontario acute care hospitals, as well as their quantity and composition of antibiotic utilization. Given anticipated differences in structural and patient characteristics across small community, medium community, large community and teaching hospitals, all descriptions of antibiotic utilization were stratified by these hospital types.
Risk adjustment of the primary outcome
A multivariable Poisson regression model, using the log of hospital PDs per 1000 as the offset, was developed to determine an expected quantity of total antibiotic use at each hospital. The model adjusted for the hospital and patient covariates from the administrative databases (listed above). The best-fitting model was generated by backward selection, with pre-specified, forced inclusion of hospital type, proportion of admissions by service, proportion of admissions that included an ICU stay and proportion of admissions by patient age. The expected quantity of antibiotics used at each hospital, in DDDs/1000 PDs, was determined using the multivariable regression model. Observed to expected ratios were then calculated. We also ranked the hospitals by observed and expected utilization, with a rank of 1 representing the highest use. Scatter plots of observed versus expected ranks, along with Spearman correlation coefficients, were generated to examine how risk adjustment changed the ranking orders.
Funnel plots for the secondary outcomes
We generated funnel plots to examine inter-hospital variation in the secondary outcomes.30 Each funnel plot provides a graphical representation of variations in an outcome (y-axis) as a function of hospital PDs in 2014 (x-axis), an index of the precision with which the outcome is being measured. More accuracy, and therefore less variability, is expected among hospitals with greater PDs.30,31
General
Analyses were performed with Microsoft Excel (Microsoft Corporation, Redmond, WA, USA), R statistical software version 3.2.2 (R Foundation for Statistical Computing, Vienna, Austria) and SAS statistical software version 9.3 (SAS Institute Inc., Cary, NC, USA).
Results
Description of acute care hospitals in Ontario
The final cohort included 129 unique institutions, comprising 17 teaching, 50 large community, 39 medium community and 23 small community hospitals (Table 1). About one-third (35.7%) of hospitals were located in rural settings, and all of these were small or medium community hospitals. Compared with the other hospital types, small community hospitals had proportionally greater medical admissions (median 86%; IQR 59%–92%) and fewer surgical (median 3%; IQR 1%–27%) and elective (median 18%; IQR 11%–39%) admissions. The majority (82.4%) of teaching hospitals and a minority (22%) of large community hospitals had an infectious diseases physician; no medium or small community hospitals had access to regular infectious diseases consultations. During the study year, these Ontario acute care hospitals admitted 1 562 379 patients with unique health card numbers, for a total of 7 525 599 PDs.
Characteristics of Ontario acute care hospitals
| Characteristic | Small community | Medium community | Large community | Teaching | Overall |
|---|---|---|---|---|---|
| Number of hospitals | 23 | 39 | 50 | 17 | 129 |
| DDDs/1000 PDs, median (IQR) | 788.4 (516.7–1050.3) | 502.1 (427.3–608.1) | 475.0 (402.1–564.0) | 521.1 (442.6–633.1) | 511.0 (427.8–636.5) |
| Hospital characteristicsa | |||||
| urban location, n (%) | 2 (8.7) | 14 (35.9) | 50 (100) | 17 (100) | 83 (64.3) |
| admitting service | |||||
| medical | 86 (59–92) | 31 (24–36) | 22 (19–27) | 24 (17–30) | 28 (21–38) |
| surgical | 3 (1–27) | 60 (56–67) | 64 (58–68) | 64 (58–69) | 60 (50–67) |
| maternal/obstetrical | 1 (0–3) | 4 (0–5) | 7 (5–9) | 6 (0–8) | 5 (0–7) |
| neonatal | 0 (0–2) | 3 (0–5) | 7 (5–8) | 6 (4–7) | 5 (0–7) |
| mental health | 6 (4–10) | 2 (1–2) | 1 (1–1) | 1 (1–1) | 1 (1–2) |
| elective admission | 18 (11–39) | 64 (60–69) | 66 (61–70) | 64 (55–68) | 64 (55–68) |
| ICU stay | 0 (0–0) | 4 (0–10) | 5 (4–6) | 7 (5–10) | 4 (0–7) |
| transfer from other acute care hospitals | 5 (4–13) | 2 (2–3) | 1 (1–2) | 3 (2–3) | 2 (1–3) |
| length of stay | |||||
| <2 days | 41 (32–65) | 73 (69–78) | 77 (73–79) | 69 (64–74) | 73 (66–78) |
| >10 days | 15 (10–26) | 8 (6–9) | 6 (5–8) | 9 (7–12) | 8 (6–11) |
| RIW, mean (SD) | 1.49 (0.69) | 0.63 (0.13) | 0.74 (0.30) | 1.06 (0.36) | 0.88 (0.49) |
| infectious diseases physician, n (%) | 0 (0) | 0 (0) | 11 (22) | 14 (82.4) | 25 (19.4) |
| Patient characteristicsa | |||||
| female sex | 52 (49–55) | 54 (51–56) | 55 (54–57) | 54 (50–55) | 54 (52–56) |
| age group | |||||
| <18 years | 3 (1–6) | 6 (1–8) | 12 (9–13) | 8 (6–18) | 8 (3–13) |
| 18–64 years | 40 (34–53) | 50 (48–56) | 51 (46–54) | 53 (51–55) | 51 (46–54) |
| ≥65 years | 50 (39–65) | 44 (34–49) | 38 (33–42) | 37 (31–41) | 40 (34–47) |
| age (years), median (IQR) | 65 (56–67) | 59 (55–62) | 52 (51–56) | 54 (48–56) | 56 (52–61) |
RIW, resource intensity weight.
Median percent (IQR), unless otherwise specified.
Overall antibiotic utilization across Ontario hospitals
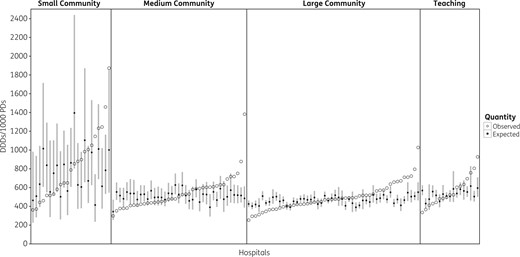
Variability in observed and expected antibiotic use across Ontario acute care hospitals. There was substantial variability in observed overall antibiotic DDDs/1000 PDs within each hospital type in Ontario (open circles). For many hospitals, the observed antibiotic use was significantly higher or lower than the expected antibiotic use based on a multivariable model accounting for hospital and aggregate patient characteristics (filled circles for model point estimate, grey bars for 95% CIs).
Risk-adjusted overall antibiotic utilization across Ontario hospitals
Multivariable Poisson regression was used to model overall hospital antibiotic use based on hospital and aggregate patient characteristics (Table 2). Small community hospital-type was the strongest predictor of overall antibiotic use, associated with a 2.4-fold increase in consumption compared with large community hospitals (95% CI 1.39–4.13). Teaching hospitals were also associated with greater utilization (relative risk 1.17; 95% CI 1.01–1.36). The proportion of short- and long-stay admissions was associated with reduced antibiotic use, with each 10% increase in admissions <2 or >10 days associated with decreased antibiotic use by 30% and 50%, respectively (Table 2).
Multivariate Poisson regression modelling the impact of hospital and aggregate patient characteristics on overall antibiotic utilization across Ontario acute care hospitals
| Characteristic | Relative risk | 95% CI | P |
|---|---|---|---|
| Hospital characteristics | |||
| hospital type | |||
| teaching | 1.17 | 1.01–1.36 | 0.04 |
| large community | reference | ||
| medium community | 1.17 | 0.96–1.42 | 0.11 |
| small community | 2.39 | 1.39–4.13 | 0.002 |
| proportion of admissions by service | |||
| medical | 1.02 | 0.92–1.14 | 0.7 |
| surgical | 1.03 | 0.93–1.15 | 0.5 |
| maternal/obstetrical | reference | ||
| neonatal | 1.05 | 0.84–1.31 | 0.7 |
| mental health | 1.01 | 0.89–1.14 | 0.9 |
| proportion of admissions with ICU stay | 1.00 | 0.98–1.02 | 0.8 |
| proportion of admissions by length of stay | |||
| <2 days | 0.97 | 0.95–0.995 | 0.02 |
| 2–10 days | reference | ||
| >10 days | 0.95 | 0.91–0.99 | 0.01 |
| Patient characteristics | |||
| proportion of female patients | 1.02 | 0.999–1.04 | 0.07 |
| proportion of admissions by patient age | |||
| <18 years | 1.01 | 1.00–1.02 | 0.3 |
| 18–64 years | reference | ||
| ≥65 years | 1.01 | 1.00–1.02 | 0.2 |
Figure 1 compares observed antibiotic utilization (open circles) with expected antibiotic utilization (filled circles for point estimate, grey bars for 95% CIs) calculated using the multivariate model. Observed antibiotic use was significantly higher than expected use at 3 small community (13%), 8 medium community (20.5%), 16 large community (32%) and 4 teaching (23.5%) hospitals. Observed use was significantly less than expected at 3 small community (13%), 8 medium community (20.5%), 12 large community (24%) and 4 teaching (23.5%) hospitals.
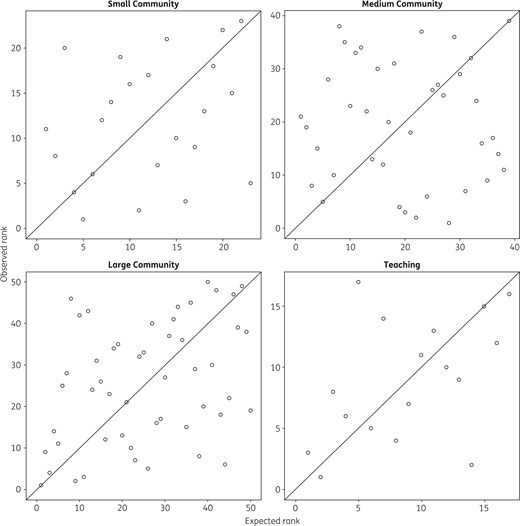
Observed versus expected hospital antibiotic use rankings. Within each hospital type, hospitals are ranked from highest (rank 1) to lowest antibiotic use based on observed DDDs/1000 PDs (y-axis) and expected DDDs/1000 PDs based on output from the risk adjustment model (x-axis). There was only poor to moderate correlation between observed and expected hospital rankings.
Class-specific antibiotic utilization
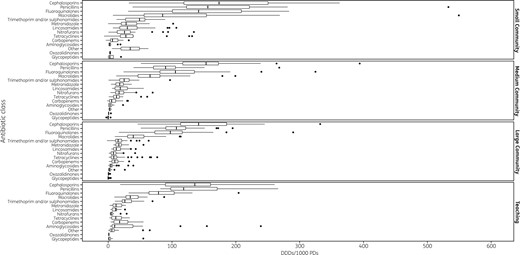
Variability in use of individual antibiotic classes across Ontario acute care hospitals. This box-and-whisker plot displays the variability in utilization of individual antibiotic classes in DDDs/1000 PDs, within each hospital type. Vertical lines represent median use, box margins represent the IQR and filled circles represent outlier use >1.5 IQRs above the upper quartile.
Variability in antibiotic utilization practices
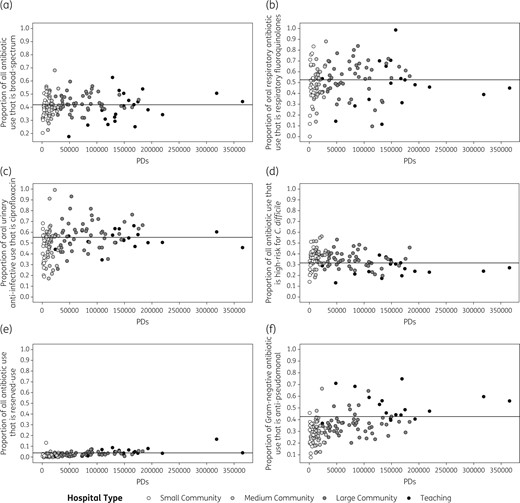
Variability in specific antibiotic use practices across Ontario acute care hospitals. In these funnel plots, variability in antibiotic use practices (y-axes) are plotted against total hospital PDs in 2014 (x-axes). Each circle represents an individual hospital and shading denotes hospital type. Each plot examines a unique antibiotic use practice: (a) the proportion of all antibiotics that were broad-spectrum (carbapenems, fluoroquinolones, glycopeptides, oxazolidinones, penicillin and β-lactamase inhibitor combinations, third-generation cephalosporins); (b) the proportion of oral respiratory antibiotics (respiratory fluoroquinolones and macrolides) that were respiratory fluoroquinolones; (c) the proportion of oral urinary anti-infectives (ciprofloxacin, nitrofurantoin, trimethoprim/sulfamethoxazole) that were ciprofloxacin; (d) the proportion of all antibiotics that were high-risk for C. difficile infection (clindamycin, fluoroquinolones, third-generation cephalosporins); (e) the proportion of all antibiotics that were ‘reserved-use’ (daptomycin, ertapenem, linezolid, meropenem); and (f) the proportion of antibiotics with Gram-negative coverage (aminoglycosides, second- and third-generation cephalosporins, fluoroquinolones, colistin, carbapenems, piperacillin/tazobactam, trimethoprim/sulfamethoxazole) that were anti-pseudomonal (aminoglycosides, ceftazidime, ciprofloxacin, colistin, meropenem, piperacillin/tazobactam).
Median (IQR) oral respiratory fluoroquinolone use, as a proportion of oral respiratory fluoroquinolones and macrolides, was 51.9% (40.3%–62.4%), and ranged from 0% in one small community hospital to 100% in one teaching hospital. The proportional use of oral respiratory fluoroquinolones was similar across hospital types (P = 0.26) (Figure 4b).
Proportional ciprofloxacin use among oral urinary anti-infectives varied substantially, ranging from 17% to 99% (median 52.9%; IQR 43.8%–60.1%). Use was highest in large community hospitals (median 57.4%; IQR 49.1%–62.9%), followed by teaching (median 53%; IQR 50.2%–57.7%), medium community (median 50.4%; IQR 41.4%–58.2%) and small community (median 47.1%, IQR 32.3%–54.1%) hospitals (P = 0.002) (Figure 4c).
Use of antibiotics posing the highest risk for C. difficile infection ranged from 13.2% to 56% of all antibiotics (median 33.9%; IQR 29.4%–40%). Teaching hospitals had lower use (median 26.3%; IQR 22.9%–30.5%) compared with large (median 33.9%; IQR 29.4%–39.9%), medium (median 39.5%; IQR 32.5%–42.1%) and small (median 34.7%; IQR 30.7%–38.4%) community hospitals (P < 0.001) (Figure 4d).
‘Reserved-use’ antibiotics only comprised a small proportion of total antibiotic use at most hospitals, with a median of 2.1% (IQR 0.8%–3.5%). However, they represented >5% of antibiotic use at 13 hospitals and >10% at 2 hospitals, including 1 small community hospital. Use was significantly higher in teaching (median 4.1%; IQR 3.4%–6.4%) and large community (median 2.2%; IQR 1.4%–3.4%) hospitals compared with medium community (median 1.3%; IQR 0.5%–2.6%) and small community (median 1.1%; IQR 0.6%–2.6%) hospitals (P < 0.001) (Figure 4e).
Lastly, anti-pseudomonal antibiotic use, as a proportion of Gram-negative antibiotic use, varied widely from 7.6% to 74.9% (median 33.4%; IQR 26.2%–40%). Teaching hospitals had the highest proportional consumption of anti-pseudomonal antibiotics (median 48.5%; IQR 43.9%–58.9%), followed by large (median 35.3%; IQR 30.2%–38.2%), medium (median 28.5%; IQR 21.5%–33.8%) and small (median 25.5%; IQR 20.5%–30.6%) community hospitals (P < 0.001) (Figure 4f).
Discussion
Our analysis of 129 acute care hospital corporations in Ontario has documented considerable inter-hospital variability in the quantity and composition of antibiotic use. The greatest variability in overall antibiotic use was seen among small community hospitals (5.2-fold difference between hospitals with highest and lowest antibiotic use), but extensive variability was also seen within medium community hospitals (4.6-fold variation), large community hospitals (4.1-fold variation) and teaching hospitals (2.8-fold variation). Even after adjustment for numerous hospital and aggregate patient characteristics, the observed antibiotic use in many hospitals was significantly higher or lower than expected values. Not only did overall antibiotic utilization vary across hospitals, but so too did the use of each individual antibiotic class, as well as general prescribing practices such as use of broad-spectrum antibiotics, use of fluoroquinolones among respiratory antibiotics, use of ciprofloxacin among urinary anti-infectives, use of drugs at highest risk of causing C. difficile infection, use of ‘reserved-use’ antibiotics and use of anti-pseudomonal antibiotics among Gram-negative antibiotics.
Our results are in keeping with prior literature that has shown significant inter-hospital variability in overall antibiotic use in other jurisdictions.5,18,20,22,23 One study of antibacterial use in 158 acute care hospitals in England found an even wider range of 81 to 2868 DDDs/1000 PDs, an almost 5-fold greater span than across Ontario hospitals.5 Another analysis of 530 French hospitals revealed a 3.8-fold difference in mean use between local and teaching hospitals.17 Furthermore, our finding that cephalosporins, penicillins and fluoroquinolones were the most commonly used antibiotic classes is corroborated by a province-level analysis of hospital antibiotic purchasing in Canada; 6 of the top 10 most purchased antibiotics belonged to one of these three classes.11
Wide variability was seen for our secondary outcomes as well, which we constructed to measure antibiotic use practices of high clinical and ecological significance. Although we expected less spread among hospitals with greater PDs, substantial variability remained at these larger hospitals, in particular in the use of oral respiratory fluoroquinolones (as a proportion of oral respiratory fluoroquinolones and macrolides), ‘reserved-use’ drugs (as a proportion of all antibiotics) and anti-pseudomonal antibiotics (as a proportion of antibiotics with Gram-negative coverage). Taken together, our findings indicate that wide practice variation in overall antibiotic use and antibiotic selection exists across facilities. Hospitals can use our analyses to determine how their quantity and composition of antibiotic utilization compares with similar facilities, and find areas for improvement. The large variability may also motivate clinicians and antimicrobial stewardship programmes to re-evaluate their antibiotic use practices, and establish or strengthen existing systems for monitoring utilization.
We also demonstrated the importance of risk adjustment for comparisons of overall antibiotic utilization across hospitals. Of the covariates we measured, hospital type, length of hospital stay and patient age were significantly associated with antibiotic use. The proportion of admissions by service and the proportion that included an ICU stay, which prior studies have identified as important predictors, were not significant in our model. There were substantial differences between the rank order of hospitals by observed and expected use, suggesting that risk adjustment is critical to inter-hospital comparisons of antibiotic utilization. However, the non-modifiable factors included in our model could not fully account for the observed inter-hospital variability in antibiotic use. Many hospitals had greater than expected use, with 31 hospitals having observed antibiotic use exceeding the 95% upper limit of expected use. It is likely that some of this variation may be explained by other unmeasured, non-modifiable hospital factors such as nuances in patient admission types (e.g. burns, organ transplantation, oncology). However, it is also likely that much of the discrepancy represents modifiable differences in local antibiotic prescribing practices, policy and culture. For example, the wide variation in the use of oral respiratory fluoroquinolones versus macrolides and the use of ciprofloxacin versus other urinary anti-infectives indicates that there is likely practice variation in the treatment of two of the most common syndromes of bacterial infection. In addition, 22 hospitals had observed use less than the 95% lower limit of predicted. Although it is possible that these hospitals are under-using antibiotics, given that extensive hospital audit literature has detected high rates of inappropriate and unnecessary antibiotic use,7,8 the high outliers are more likely than the low outliers to benefit from antibiotic stewardship interventions.
Our study is subject to limitations associated with the use of an external database of hospital antibiotic purchasing. Although purchasing data are an indirect measure of patient-level antibiotic consumption, our validation of this dataset found a strong correlation with internal hospital dispensing data.13 In the same validation study, we determined that nine parenteral antibiotics were consistently underestimated in the purchasing data from IMS Health. IMS Health confirmed that these are the drugs for which only partial sales information was available in Ontario for the study period. Therefore, we were unable to examine some potentially relevant practice variations, such as the proportion of fluoroquinolone treatment that was intravenous versus oral, or the proportion of Gram-positive antibiotic use that was vancomycin use. The secondary outcome evaluating anti-pseudomonal antibiotic utilization may also have been affected by the underestimation of ceftazidime, ciprofloxacin and tobramycin use. However, repeating our descriptive analyses with these drugs removed resulted in a similar extent of variability across hospitals (data not shown). In addition, we excluded parenteral levofloxacin and ciprofloxacin from our secondary analyses on respiratory fluoroquinolone use and ciprofloxacin use, respectively.
The availability of only aggregate antibiotic use data at the hospital level meant that we could not link antibiotic use to individual patients. Our use of retrospective administrative data may also have introduced inaccuracies, but these databases have been rigorously validated and the variables in our study are among the most accurate components of these datasets.32 Another limitation of using hospital-level data was that the indications for using an antibiotic were not known. Therefore, although our secondary outcomes on respiratory fluoroquinolone and ciprofloxacin use were meant to reflect treatment of community-acquired pneumonia and urinary tract infections, respectively, the numerators and denominators would also have included some DDDs used for treatment of other infections (e.g. soft tissue infection), and would have excluded some patients treated with alternative antibiotics (e.g. β-lactam monotherapy). Lastly, using DDDs to quantify drug utilization may be inaccurate for certain populations (e.g. paediatrics, renal impairment) and does not reflect differences in dosing practices between institutions. However, the DDD is the only metric that can be calculated using purchasing data, and has been used widely in studies on antibiotic consumption.33–35
Our study reveals extensive variability in antibiotic use across Ontario acute care hospitals, and finds that much of this variability cannot be explained by non-modifiable hospital and patient factors. Additional research is needed to compare antibiotic utilization between hospitals with higher- and lower-than-expected use; doing so may reveal inappropriate practices that should be discouraged and prudent strategies that can be adopted at other facilities. In addition, future work should link variability in hospital-level antibiotic use and practice patterns with patient-level outcomes at these facilities, to determine whether this variability is driving rates of C. difficile infection, antibiotic-resistant organisms, infection-related treatment failures and other harms. This will potentially identify practices associated with adverse outcomes, and guide stewardship interventions to improve the safety of both direct recipients and non-recipients of antibiotics in hospital. In the meantime, these findings demonstrate the feasibility of using purchasing data to measure and benchmark hospital-level antibiotic use, and stress the need for ongoing surveillance of utilization to support antibiotic stewardship efforts.
Acknowledgements
This study was conducted at the Institute for Clinical Evaluative Sciences, which is funded by an annual grant from the Ontario Ministry of Health and Long-Term Care. The opinions, results and conclusions reported in this paper are those of the authors and are independent from the funding sources.
Funding
This work was supported by N. D.’s Canadian Institutes of Health Research Clinician Scientist Salary Award, and an Applied Health Research Question fund via the Institute for Clinical Evaluative Sciences.
Transparency declarations
None to declare.
Disclaimer
No endorsement by the Institute for Clinical Evaluative Sciences or the Ontario Ministry of Health and Long-Term Care is intended or should be inferred.
References
Definition and General Considerations. WHO Collaborating Centre for Drug Statistics Methodology,
