


Abstract
CD4 cell recovery following first-line combination ART (cART) is poorer in HIV-2+ than in HIV-1+ patients. Only large comparisons may allow adjustments for demographic and pretreatment plasma viral load (pVL).
ART-naive HIV+ adults from two European multicohort collaborations, COHERE (HIV-1 alone) and ACHIeV2e (HIV-2 alone), were included, if they started first-line cART (without NNRTIs or fusion inhibitors) between 1997 and 2011. Patients without at least one CD4 cell count before start of cART, without a pretreatment pVL and with missing a priori-defined covariables were excluded. Evolution of CD4 cell count was studied using adjusted linear mixed models.
We included 185 HIV-2+ and 30321 HIV-1+ patients with median age of 46 years (IQR 36–52) and 37 years (IQR 31–44), respectively. Median observed pretreatment CD4 cell counts/mm3 were 203 (95% CI 100–290) in HIV-2+ patients and 223 (95% CI 100–353) in HIV-1+ patients. Mean observed CD4 cell count changes from start of cART to 12 months were +105 (95% CI 77–134) in HIV-2+ patients and +202 (95% CI 199–205) in HIV-1+ patients, an observed difference of 97 cells/mm3 in 1 year. In adjusted analysis, the mean CD4 cell increase was overall 25 CD4 cells/mm3/year lower (95% CI 5–44; P = 0.0127) in HIV-2+ patients compared with HIV-1+ patients.
A poorer CD4 cell increase during first-line cART was observed in HIV-2+ patients, even after adjusting for pretreatment pVL and other potential confounders. Our results underline the need to identify more potent therapeutic regimens or strategies against HIV-2.
Introduction
HIV-2 is less prevalent than HIV-1 and HIV-2+ individuals live mainly in West Africa, followed by Angola, Mozambique and Europe (primarily Portugal and France).1 HIV-2 infection is characterized by a lower plasma viral load (pVL) and a slower clinical progression.2–7 ART options for HIV-2 are restricted due to its natural resistance to NNRTIs and fusion inhibitors, and because some PIs have shown lower efficacy.8–11
The 2013 WHO guidelines for treatment of HIV-2 infection recommended either triple NRTIs or two NRTIs combined with a ritonavir-boosted PI (PI/r) as first-line combination ART (cART), with a lopinavir-containing regimen as preferred option.12,13 In Europe, the recommended first-line cART regimen for HIV-2 infection consisted of two NRTIs and one PI or one PI/r since 2010.14,15 Of note, performing a randomized clinical trial designed to inform about optimal cART strategies for HIV-2 therapy is not feasible in Europe due to the low prevalence of HIV-2 infection, but is ongoing in West Africa.
CD4 cell recovery in HIV-2+ patients receiving first-line cART has been reported to be lower and slower than in HIV-1+ patients.16–18 Two observational studies have reported a better immunological response in HIV-2+ patients with a PI/r-based regimen compared with a triple NRTI regimen.19,20
Comparative studies between HIV-1 and HIV-2 are often hampered by the small number of patients infected with HIV-2 under similar standardized follow-up.3,21 Contradictory results regarding CD4 cell recovery have been reported when pretreatment pVL was taken into account.3,21,22 The lower replication rate of HIV-2 has been hypothesized as one possible explanation, leading to a poorer CD4 response to therapy. We compared immunological outcome in HIV-2+ and HIV-1+ patients under standard follow-up in Europe, by adjusting for pretreatment pVL levels at initiation of first cART, and other potential confounders.
Methods
Data collection
COHERE (HIV-1+ patients) and ACHIeV2e (HIV-2+ patients) are prospective, multinational, observational cohort collaborations. Data were pooled in the COHERE in EuroCoord 2011 and ACHIeV2e 2011 data merger. COHERE is a collaboration of 40 cohorts from across Europe23 and is part of the EuroCoord network (www.EuroCoord.net). The 23 cohorts participating in the present study through the COHERE network and the 9 cohortsparticipating through the ACHIeV2e network24,25 (listed in the Acknowledgements section) submitted a defined dataset (patient demographics, current cART, CD4 counts and HIV RNA values, clinical status and events) to their network-specific Coordination Centre, using the HIV Cohort Data Exchange Protocol (HICDEP).26 The final data set was merged at the Bordeaux Regional Coordinating Centre for COHERE and ACHIeV2e, adhering to strict quality-assurance guidelines and performing data quality checks.
Study population
Adult patients aged ≥18 years infected with either HIV-2 or HIV-1 (dual-seropositive and dual-infected patients were excluded) who started a first-line cART regimen from 1997 to 2011 were included in the analysis. HIV-2+ and HIV-1+ patients receiving an NNRTI- or fusion inhibitor-containing regimen were not included because of the natural resistance of HIV-2 to these drug classes.11 Observations were excluded if patients presented without one pretreatment CD4 cell count in a window of 6 months before start of cART27 and without a pretreatment pVL based on quantification methods with a detection limit of ≤500 copies/mL. We used a cut-off of 500 copies/mL (2.7 log10 copies/mL) to define undetectable pVL, as a consensus shared by the majority of contributing centres in the dataset.24,25 Only patients with complete data for potential confounders (listed below) were included in all analyses (Figure S1, available as Supplementary data at JAC Online). Criteria used to initiate therapy of HIV-2 infection were those fitting the national treatment guidelines of each contributing centre effective at the time of cART start. The choice of antiretroviral combination was at the physician’s discretion based on these treatment guidelines.
Follow-up began at initiation of the first cART regimen (baseline). Follow-up was censored when the ART combination was modified for whatever reason, at death or at the last available CD4 cell counts, whichever occurred first.
Virological data and CD4 cell count
All serological results, pVL values and CD4 cell counts were obtained from laboratories of participating centres. HIV-1 and HIV-2 infections were diagnosed by ELISA tests confirmed by western blot. Quantification of HIV-2 viral load was assessed by in-house methods;25 the quality control assessments of quantification assays used by the ACHIeV2e network showed heterogeneity, which improved from 2006 to 2011.24,25 Pretreatment pVL and pretreatment CD4 cell counts were defined as the closest measurement in a window of 6 months before cART start.
Statistical analysis
We studied the effect of the HIV type on CD4 cell count at initiation of first cART (intercept) and on CD4 cell count change (cells/mm3/year) (slope) using linear mixed effect models with a random intercept and a random slope. The correlation between individual baseline CD4 value(s) and the subsequent CD4 slope(s) was handled through an unstructured covariance matrix of random effects. We checked the underlying model assumptions (normality and homoscedasticity of residuals).28
We studied the effect of the following a priori-defined covariables on CD4 cell count at cART initiation and on CD4 cell count change by introducing an interaction term with the slope: HIV type (HIV-2 versus HIV-1, the main exposure variable), pVL as a continuous covariable (log10 copies/mL with imputation of the limit of detection for undetectable pVL), age (per 10 year increase), sex, geographical origin (Europe, Africa, Asia, other/unknown), HIV transmission route (heterosexual, homosexual, drug use, other/unknown), prior AIDS diagnosis, cART regimen [two NRTIs plus one ritonavir-boosted PI (other than lopinavir/ritonavir and darunavir/ritonavir), two NRTIs plus lopinavir/ritonavir or darunavir/ritonavir, three NRTIs, other ART combinations (mainly two or three NRTIs plus an unboosted PI or combinations with integrase inhibitors)], period of cART initiation (1998–99, 2000–01, 2002–03, 2004–05, 2006–07, 2008–09, 2010–11) and time between HIV diagnosis and cART start. The slope was additionally adjusted for pretreatment CD4 cell count (per 100 cells/mm3 increase).
For all stratified or subgroup analyses described below we used the linear mixed regression models adjusted for the same covariables described above. Our main hypothesis was related to the potential for differences in pVL that might explain the differences in CD4 cell count evolution between HIV-2+ and HIV-1+ patients. To explore the stability of estimations, we further restricted the analysis to patients with a baseline pVL measured by a test with a limit of ≤100 copies/mL. We explored whether the effect of the virus type (HIV-2 or HIV-1) on CD4 cell response was modified by the level of baseline pVL by testing homogeneity of the association between HIV type and CD4 cell count evolution across baseline pVL strata (pVL <500 and ≥500 copies/mL) by integrating an interaction term in the linear mixed model.
We stratified the analyses of immunological response according to the type of cART received, i.e. three NRTIs, two NRTIs combined with a ritonavir-boosted PI (other than lopinavir/ritonavir and darunavir/ritonavir), and two NRTIs combined with either lopinavir/ritonavir or darunavir/ritonavir, to assess whether the cART regimen had an effect on the association between HIV type and CD4 cell response by testing homogeneity of the association of HIV type and CD4 cell count evolution across baseline cART regimen. The three categories of cART were chosen because these cART regimens were those recommended by WHO during the study period.13
Results are presented for 12 months of follow-up after cART initiation but analyses are based on all available CD4 cell counts after cART initiation up to 115 and 150 months in HIV-2+ and HIV-1+ patients. We described categorical variables with frequencies (%) and continuous variables with medians (IQR). CD4 cell count changes were described with means and 95% CI after having assessed the normality assumption. Categorical variables were compared between HIV-2+ and HIV-1+ (included and excluded) patients using χ2 tests or Fisher’s exact test as appropriate. Quantitative variables were compared between groups using the Wilcoxon–Mann–Whitney test.
All analyses were performed with SAS 9.2 (SAS Institute, Cary, NC, USA).
Results
Characteristics at cART start
In the ACHIeV2e dataset 243 HIV-2+ patients fulfilled inclusion criteria; 58 of these were excluded, giving a total of 185 HIV-2+ patients in the analyses (Figure S1). We observed no significant difference between included and excluded HIV-2+ patients (Table S1). In the COHERE dataset 66483 HIV-1+ patients fulfilled inclusion criteria; 36162 of these were excluded, giving a total of 30231 HIV-1+ patients in the analyses (Figure S1). Included HIV-1+ patients were less often of European origin, were less often injection drug users, and were more often treated with two NRTIs combined with either lopinavir/ritonavir or darunavir/ritonavir compared with non-included patients (Table S1).
Baseline characteristics are presented in Table 1. At start of first-line cART, HIV-2+ patients were significantly older [median age 46 years (IQR 36–52)] compared with HIV-1+ patients [median age 37 years (32–44)] (P < 0.0001). The proportion of HIV-2+ patients with a pVL <500 copies/mL was significantly higher compared with patients infected with HIV-1 (60% versus 12%; P < 0.0001). Median pVL (IQR) was 3.2 log10 copies/mL (2.2–4.2) and 4.8 log10 copies/mL (4.0–5.4) in HIV-2+ and HIV-1+ patients, respectively. Median time between HIV diagnosis and cART start was significantly longer in HIV-2+ compared with HIV-1+ patients (1.0 versus 0.6 years; P = 0.0390). Two NRTIs plus lopinavir/ritonavir or darunavir/ritonavir was the most frequent cART regimen in HIV-2+ and HIV-1+ patients (43% and 36.5%, respectively) followed by two NRTIs plus other boosted PIs (23.8% versus 22.6%). Three NRTIs were prescribed in 13% and 7.2% of HIV-2+ and HIV-1+ patients, respectively. Median pretreatment CD4 cell count was similar in HIV-2+ versus HIV-1+ patients [203 cells/mm3 (IQR 100–290) versus 223 cells/mm3 (IQR 100–353); P = 0.1480]. After adjustment for a priori-defined confounding covariables a significant difference in CD4 cell count at cART initiation remained between HIV-2+ and HIV-1+ patients. HIV-2+ patients had 56 CD4 cells/mm3 less at cART initiation compared with HIV-1+ patients (P < 0.0001).
Characteristics of patients at initiation of first cART
| Characteristic | HIV-1 (N = 30231) | HIV-2 (N = 185) | P |
|---|---|---|---|
| Age (years), median (IQR) | 37 (31–44) | 46 (36–52) | <0.0001 |
| Female, n (%) | 8179 (27.1) | 88 (47.6) | <0.0001 |
| Region of origin, n (%) | <0.0001 | ||
| Europe | 16517 (54.6) | 47 (25.4) | |
| Africa | 2495 (8.3) | 130 (70.3) | |
| Asia | 413 (1.4) | 2 (1.1) | |
| unknown/othera | 10806 (35.7) | 6 (3.2) | |
| Transmission risk group, n (%) | <0.0001 | ||
| heterosexual | 10783 (35.7) | 154 (83.2) | |
| homo/bisexual male | 11825 (39.1) | 7 (3.8) | |
| injecting drug user | 4887 (16.2) | 2 (1.1) | |
| mother-to-child | 26 (0.1) | ||
| unknown/other | 2710 (9.0) | 22 (11.9) | |
| Prior AIDS diagnosis, n (%) | 7169 (23.7) | 42 (22.7) | 0.7471 |
| First-line cART regimen, n (%) | 0.0002 | ||
| 2 NRTIs + 1 PI/RTV (not LPV or DRV) | 6823 (22.6) | 44 (23.8) | |
| 2 NRTIs + LPV/RTV or DRV/RTV | 11039 (36.5) | 79 (42.7) | |
| 3 NRTIs | 2180 (7.2) | 24 (13) | |
| other regimensb | 10189 (33.7) | 38 (20.5) | |
| Period of treatment initiation, n (%) | <0.0001 | ||
| 1998–99 | 6292 (20.8) | 13 (7.0) | |
| 2000–01 | 3708 (12.3) | 19 (10.3) | |
| 2002–03 | 3810 (12.6) | 32 (173) | |
| 2004–05 | 4613 (15.3) | 34 (18.4) | |
| 2006–07 | 5557 (18.4) | 44 (23.8) | |
| 2008–09 | 5102 (16.9) | 30 (16.2) | |
| 2010–11 | 1149 (3.8) | 13 (7.0) | |
| Pretreatment HIV RNA viral load | |||
| <500 copies/mL, n (%) | 3719 (12.3) | 110 (59.5) | <0.0001 |
| log10 copies/mL, median (IQR)c | 4.8 (4.0–5.4) | 3.2 (2.2–4.2) | <0.0001 |
| Pretreatment CD4 cell count (cells/mm3), median (IQR) | 223 (100–353) | 203 (100–290) | 0.1480 |
| Delay between first HIV seropositivity and cART start (years), median (IQR) | 0.61 (0.11–3.79) | 0.97 (0.21–5.25) | 0.0390 |
DRV, darunavir; LPV, lopinavir; RTV, ritonavir (boost).
HIV-1: for 9462 patients the geographical origin was reported as unknown and 1344 were from other regions (Oceania-not Australia, Australia and New Zealand, America, North America, Central and South America and Middle East). HIV-2: for two patients the geographical origin was reported as unknown, two patients were from America and two patients were from Central and South America.
Other regimens largely consisted of two or three NRTIs plus an unboosted PI or of combinations with integrase inhibitors [347 (1.1%) HIV-1-infected and 7 HIV-2-infected (3.8%) patients were treated with an integrase inhibitor].
For patients with a viral load below the detection limit of the test, the detection limit has been imputed for the calculation.
Follow-up data
Median follow-up from first-line cART start until treatment modification, death or last available CD4 cell count was 10 months (IQR 1–27) and 8 months (IQR 2–21) in HIV-2+ and HIV-1+ patients, respectively (P = 0.0412). A median of 3 (IQR 2–8) and 4 (IQR 2–8) CD4 cell counts per HIV-2+ and HIV-1+ patient were available, respectively (P = 0.1555). Among HIV-2+ and HIV-1+ patients, 4.3% and 5.4% were lost to follow-up (P = 0.5017) and 1.1% and 1.7% died (P = 0.5344), respectively.
CD4 cell count evolution
In patients still followed at 12 months, median observed CD4 cell counts at 12 months were 265 cells/mm3 (IQR 182–420) in HIV-2+ and 404 cells/mm3 (IQR 262–571) in HIV-1+ patients (Figure 1). The mean observed change in CD4 cell count from start of cART to month 12 was +105 (95% CI 77–134) in HIV-2+ and +202 (95% CI 199–205) in HIV-1+ patients, which is an observed difference of 97 CD4 cells/mm3 in CD4 cell increase in 1 year.
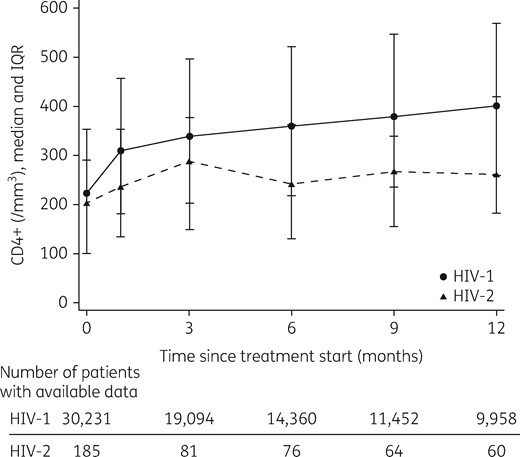
Median observed CD4 cell counts after first-line cART initiation in HIV-2- and HIV-1-infected patients up to 12 months of follow-up. Vertical bars represent the IQR.
After adjusting for pretreatment pVL only, the mean CD4 cell count increase remained significantly lower in HIV-2+ compared with HIV-1+ patients [difference of −41 CD4 cells/mm3/year (95% CI −20 to −61); P < 0.0001]. This difference persisted [difference of −25 CD4 cells/mm3/year (95% CI −44 to −5); P = 0.0127] after adjustment for pretreatment pVL and the other potential confounders (Table 2). All a priori-defined covariables were significantly and independently associated with CD4 cell count change. Of note, irrespective of the HIV type and all other variables included in the model, patients receiving three NRTIs had on average a significantly lower CD4 cell increase when compared with patients receiving a boosted PI-based cART regimen [difference in slope of −34 cells/mm3/year (95% CI −40 to −26); P < 0.0001; Table 2].
Estimated mean CD4 cell count differences at first-line cART start and CD4 cell count changes adjusted for all listed covariables
| CD4 cell count at initiation of first cART (cells/mm3) | CD4 cell count change (cells/mm3/year) | |||||
|---|---|---|---|---|---|---|
| mean | 95% CI | P | mean | 95% CI | P | |
| Intercept/slope | 533 | 518–549 | <0.0001 | 154 | 142–166 | 0.0003 |
| HIV type | ||||||
| HIV-2 versus HIV-1 | −56 | −86 to − 26 | <0.0001 | −25 | −44 to − 5 | 0.0127 |
| Pretreatment pVL (per additional 1 log10 copies/mL) | −26 | −28 to − 24 | <0.0001 | 9 | 8–10 | <0.0001 |
| Age at treatment initiation (per additional 10 years) | −22 | −25 to − 20 | <0.0001 | −9 | −10 to − 7 | <0.0001 |
| Sex | ||||||
| female versus male | 26 | 19–32 | <0.0001 | 10 | 6–15 | <0.0001 |
| Geographical origin | <0.0001 | <0.0001 | ||||
| Europe (reference category) | ||||||
| Africa | −31 | −40 to − 22 | −25 | −32 to 19 | ||
| Asia | −53 | −73 to − 33 | −7 | −21 to 6 | ||
| unknown/other | −18 | −23 to − 13 | −4 | −8 to − 1 | ||
| Transmission group | <0.0001 | <0.0001 | ||||
| heterosexual (reference category) | ||||||
| homo/bisexual male | 53 | 47–59 | 9 | 4–13 | ||
| injecting drug user | −25 | −33 to − 18 | −16 | −21 to − 10 | ||
| unknown/other | −9 | −17 to 0 | −12 | −18 to − 6 | ||
| Prior AIDS diagnosis | ||||||
| yes versus no | −126 | −132 to − 121 | <0.0001 | 6 | 2–10 | 0.0047 |
| cART regimen | <0.0001 | <0.0001 | ||||
| 2 NRTIs + 1 PI/RTV (reference category) | ||||||
| 2 NRTIs + LPV/RTV or DRV/RTV | −9 | −15 to − 3 | 4 | −1 to 8 | ||
| 3 NRTIs | 53 | 42–63 | −34 | −40 to − 26 | ||
| other regimensa | 24 | 17–32 | −5 | −11 to 0.5 | ||
| Period of cART initiation | <0.0001 | <0.0001 | ||||
| 1998–99 | −7 | −16 to 2 | −53 | −60 to − 46 | ||
| 2000–01 | −26 | −36 to − 17 | −59 | −66 to − 52 | ||
| 2002–03 | −14 | −23 to − 6 | −56 | −62 to − 49 | ||
| 2004–05 | −17 | −25 to − 9 | −50 | −57 to − 44 | ||
| 2006–07 | 3 | −4 to 11 | −38 | −44 to − 32 | ||
| 2008–09 (reference category) | ||||||
| 2010–11 | −11 | −24 to 3 | 130 | 108 to 153 | ||
| Delay between first HIV seropositivity and cART start (per additional year) | −0.8 | −1.4 to − 0.3 | 0.0039 | −1.1 | −1.5 to − 0.7 | <0.0001 |
| Pretreatment CD4 cell count (per additional 100 cells/mm3)b | – | – | – | −2 | −3 to − 1 | <0.0001 |
DRV, darunavir; LPV, lopinavir; RTV, ritonavir (boost).
For CD4 cell count changes, a negative value indicates a lower CD4 increase and a positive value indicates a higher CD4 increase. N = 30231 for HIV-1-infected patients and N = 185 for HIV-2-infected patients.
Other regimens largely consisted of two or three NRTIs plus an unboosted PI or of combinations with integrase inhibitors.
The reported difference in CD4 cell count change is for a difference of 100 CD4 cells/mm3 at baseline, i.e. in a patient with 400 CD4 cells/mm3 the increase is of 2 cells less than compared with a patient with 300 CD4 cells/mm3.
All subgroup and stratified analyses showed stable results. When considering only patients with a baseline pVL measured by an assay with a detection limit of ≤ 100 copies/mL (HIV-1 n = 27594; HIV-2 n = 129), CD4 cell increase was lower in HIV-2+ patients in adjusted analysis [difference of −29 CD4 cells/mm3/year (95% CI −4 to −53); P = 0.0227]. The effect of HIV type on CD4 cell count response was not modified by baseline pVL; thus, the effect of HIV on CD4 cell count response did not differ in those with a baseline pVL of ≥500 copies/mL (HIV-1 n = 26602; HIV-2 n = 75) and those with a baseline pVL <500 copies/mL (HIV-1 n = 3719; HIV-2 n = 110) (P = 0.1711). Differences in CD4 cell increase between HIV-2+ and HIV-1+ patients were not modified by the initial cART regimen (interaction test: P = 0.9093).
Discussion
The reasons for the previously reported poorer immunological response to first-line cART in HIV-2+ patients are still poorly understood. Using data from two large European observational cohort collaborations, we found a significantly lower CD4 cell increase after starting first-line cART between HIV-2+ and HIV-1+ patients (i.e. observed difference of 97 CD4 cells/mm3). The difference in CD4 cell count increase between HIV-2+ and HIV-1+ patients remained significant after adjusting for pretreatment pVL, cART regimen and other main confounders (i.e. difference of 25 cells/mm3/year). Furthermore, the difference between HIV-2 and HIV-1 was not modified by the cART regimen.
ART regimens have been mainly developed for and validated in HIV-1+ patients; their potency is likely to be different in HIV-2+ patients. Lower potency of several PIs, such as nelfinavir, fosamprenavir and atazanavir, has been reported in phenotypic studies.8 The replication cycle of HIV-2 is clearly different from that of HIV-1. HIV-2 pVL is more often below the threshold of detectability, and lower when quantified, compared with HIV-1 pVL, even at advanced disease stages. Total proviral DNA is very similar in HIV-1 and HIV-2 infection after adjustment for CD4 cell count.29–32 This suggests at least a blockade of HIV-2 replication at the post-integration level and may explain the differences between HIV-1 and HIV-2 with regard to the potency of PIs. Of note, the difference in CD4 increase between HIV-2 and HIV-1 was smaller (i.e. difference of 25 cells/mm3/year) after adjusting for pretreatment pVL, cART regimen and other main confounders, but remained significant. Furthermore, our results were robust after adjustment for pVL as a time-dependent covariable.
The time between HIV diagnosis and cART initiation, known to contribute to a poorer immunological response to cART, was longer in HIV-2+ patients compared with HIV-1+ patients. This longer delay is probably due to the slower CD4 cell decrease and the longer asymptomatic stage distinguishing the natural history of HIV-2 infection.3 Nonetheless, CD4 cell increase remained significantly lower in HIV-2+ patients in our analysis adjusted for this delay between HIV diagnosis and cART initiation. For both HIV-1 and HIV-2 infections initiation of cART was recommended at more advanced stages during the study period than currently is the case. Criteria used to initiate ART in HIV-2+ patients were those fitting the national guidelines of each contributing centre effective at the time of cART start. These guidelines were consistent across Europe and included CDC stages B and C, CD4 lymphopenia and HIV-2 RNA levels above the detection limit of the quantification assay; the level of CD4 lymphopenia defined for cART indication in HIV-2 infection was lower than that defined for HIV-1 infection, and may also explain the difference observed in pretreatment CD4 cell counts. Of note, median CD4 cell count was 203 cells/mm3 in HIV-2+ patients at cART start, lower than in HIV-1+ patients, similar to that reported at ART start in the IeDEA-West Africa HIV-2 cohort study (i.e. 166 cells/mm3).33 It has since been demonstrated that earlier treatment of HIV-1 infection is the best strategy for successful immune restoration.34 Long-term non-progressors account for 6% of the whole asymptomatic HIV-2 population, applying the same methodology as used to determine their proportion in HIV-1-infected patients.35 Among the remaining 94% there are patients with slightly progressive infection, who might benefit from earlier treatment leading to a better immune restoration.
We found an overall significantly lower CD4 cell increase in patients receiving a three-NRTI regimen compared with those receiving a ritonavir-boosted PI-based regimen. These findings obviously confirm the results of a European observational study that included some of the same HIV-2-infected patients,20 but also those of a recent West African study.19 Direct comparisons of different treatment regimens in observational studies are challenging and the gold standard design for such analyses and for evidence-based conclusions are randomized clinical trials. Such trials are not realizable in Europe due to the restricted number of potentially eligible HIV-2-infected patients living there. However, we report for the first time a comparison of CD4 cell response to first-line cART in a large population of HIV-2- and HIV-1-infected patients under standardized routine follow-up in Europe, allowing us to adjust the comparison for initial pVL levels, cART regimen, region of origin and other patient characteristics, such as pretreatment CD4 cell count and previous AIDS diagnosis, and for calendar periods of cART initiation.
Chronic immune activation and inflammation markers have been linked to disease progression in HIV-1+36,37 and HIV-2+ patients.38–40 Differences in CD4 cell count response to first cART may be linked to differences in the underlying pathogenicity of these two viruses regarding immune activation. However, chronic immune activation is directly linked to pVL39,41 and in our comparison of immune response we controlled for pVL in various ways. Of note, it has been shown that HIV-2 non-progression is associated with better immune response to the virus, less immune activation and broad neutralizing antibody response; nevertheless, we do not know what came first: the particularities of HIV-2 replication or the immune response.
There are several limitations to our analyses. Differences in immunological outcome between HIV-1 and HIV-2 may have been observed due to unmeasured confounding factors. We cannot completely rule out a selection bias as we did not analyse pretreatment slopes of CD4 cell decreases in HIV-1 and HIV-2 populations. We were unable to adjust for hepatitis B and/or for hepatitis C co-infection, although we adjusted for geographical origin and transmission risk group, which are closely linked to hepatitis B and C seroprevalences. Furthermore, follow-up was quite short and may hamper the extrapolation of our results to the long term.
Our study has several strengths. This is a large study comparing CD4 cell dynamics between HIV-2+ and HIV-1+ patients after start of first-line cART. The data quality was assured through two large European collaborative networks adhering to strict quality control checks, which allowed us to adjust our comparative analysis for the major confounding variables. Furthermore, we could confirm our main findings in subgroup and stratified analyses showing the robustness of the results and the absence of effect modification by initial pVL and cART regimen.
Differences in CD4 cell dynamics between HIV-2 and HIV-1 were consistent in all analyses, with a poorer CD4 cell increase after start of treatment in HIV-2+ patients, even after adjustment for pVL. Our results underline the need to identify other factors contributing to this lower CD4 cell response, such as more potent drugs against HIV-2, adapted to the particularities of the virus replication when compared with HIV-1, in order to improve case management.
Acknowledgements
We thank all the patients for participating in all these cohorts and the physicians, study nurses and laboratory researchers for their invaluable work.
Members of the COHERE in EuroCoord and ACHIeV2e Study Group
COHERE in EuroCoord
Steering Committee - Contributing Cohorts: Ali Judd (AALPHI), Robert Zangerle (AHIVCOS), Giota Touloumi (AMACS), Josiane Warszawski (ANRS CO1 EPF/ANRS CO11 OBSERVATOIRE EPF), Laurence Meyer (ANRS CO2 SEROCO), François Dabis (ANRS CO3 AQUITAINE), Murielle Mary Krause (ANRS CO4 FHDH), Jade Ghosn (ANRS CO6 PRIMO), Catherine Leport (ANRS CO8 COPILOTE), Linda Wittkop (ANRS CO13 HEPAVIH), Peter Reiss (ATHENA), Ferdinand Wit (ATHENA), Maria Prins (CASCADE), Heiner Bucher (CASCADE), Diana Gibb (CHIPS), Gerd Fätkenheuer (Cologne-Bonn), Julia Del Amo (CoRIS), Niels Obel (Danish HIV Cohort), Claire Thorne (ECS), Amanda Mocroft (EuroSIDA), Ole Kirk (EuroSIDA), Christoph Stephan (Frankfurt), Santiago Pérez-Hoyos (GEMES-Haemo), Osamah Hamouda (German ClinSurv), Barbara Bartmeyer (German ClinSurv), Nikoloz Chkhartishvili (Georgian National HIV/AIDS), Antoni Noguera-Julian (CORISPE-cat), Andrea Antinori (ICC), Antonella d’Arminio Monforte (ICONA), Norbert Brockmeyer (KOMPNET), Luis Prieto (Madrid PMTCT Cohort), Pablo Rojo Conejo (CORISPES-Madrid), Antoni Soriano-Arandes (NENEXP), Manuel Battegay (SHCS), Roger Kouyos (SHCS), Cristina Mussini (Modena Cohort), Pat Tookey (NSHPC), Jordi Casabona (PISCIS), Jose M. Miró (PISCIS), Antonella Castagna (San Raffaele), Deborah_Konopnick (St. Pierre Cohort), Tessa Goetghebuer (St Pierre Paediatric Cohort), Anders Sönnerborg (Swedish InfCare), Carlo Torti (The Italian Master Cohort), Caroline Sabin (UK CHIC), Ramon Teira (VACH), Myriam Garrido (VACH), David Haerry (European AIDS Treatment Group).
Executive Committee: Stéphane de Wit (Chair, St. Pierre University Hospital), Jose Ma Miró (PISCIS), Dominique Costagliola (FHDH), Antonella d’Arminio-Monforte (ICONA), Antonella Castagna (San Raffaele), Julia del Amo (CoRIS), Amanda Mocroft (EuroSida), Dorthe Raben (Head, Copenhagen Regional Coordinating Centre), Geneviève Chêne (Head, Bordeaux Regional Coordinating Centre). Paediatric Cohort Representatives: Ali Judd, Pablo Rojo Conejo.
Regional Coordinating Centres: Bordeaux RCC: Diana Barger, Christine Schwimmer, Monique Termote, Linda Wittkop; Copenhagen RCC: Maria Campbell, Casper M. Frederiksen, Nina Friis-Møller, Jesper Kjaer, Dorthe Raben, Rikke Salbøl Brandt.
Project Leads and Statisticians: Juan Berenguer, Julia Bohlius, Vincent Bouteloup, Heiner Bucher, Alessandro Cozzi-Lepri, François Dabis, Antonella d’Arminio Monforte, Mary-Anne Davies, Julia del Amo, Maria Dorrucci, David Dunn, Matthias Egger, Hansjakob Furrer, Marguerite Guiguet, Sophie Grabar, Ali Judd, Ole Kirk, Olivier Lambotte, Valériane Leroy, Sara Lodi, Sophie Matheron, Laurence Meyer, Jose Ma Miró, Amanda Mocroft, Susana Monge, Fumiyo Nakagawa, Roger Paredes, Andrew Phillips, Massimo Puoti, Michael Schomaker, Colette Smit, Jonathan Sterne, Rodolphe Thiebaut, Claire Thorne, Carlo Torti, Marc van der Valk, Linda Wittkop, Natasha Wyss.
The COHERE study group has received unrestricted funding from: Agence Nationale de Recherches sur le SIDA et les Hépatites Virales (ANRS), France; HIV Monitoring Foundation, The Netherlands; and the Augustinus Foundation, Denmark. The research leading to these results has received funding from the European Union Seventh Framework Programme (FP7/2007–2013) under EuroCoord grant agreement n° 260694. A list of the funders of the participating cohorts can be found at www.COHERE.org.
ACHIeV2e
Clinical centres
France: Clinical centres from the ANRS CO5 HIV-2 Cohort: Bichat – Claude Bernard Hospital, Paris (Sophie Matheron); Pitié-Salpétrière Hospital, Paris (Roland Tubiana); Saint-Antoine Hospital, Paris (Marie-Caroline Meyohas); Cochin Hospital (Cornélia Bernasconi, Nicolas Dupin); Tenon Hospital, Paris (Laurence Slama); Saint-Louis Hospital, Paris (Diane Ponscarme, Caroline Lascoux-Combe, Françoise-Julie Timsit); Delafontaine Hospital, Saint-Denis (Marie-Aude Khuong); Lariboisière Hospital, Paris (Agathe Rami); Paul Brousse Hospital, Villejuif (Elina Teichner); Villeneuve Saint Georges Hospital (Caroline Semaille); Bicêtre Hospital, Le Kremlin Bicêtre (Yann Quertainmont); Louis Mourier Hospital, Colombes (Martine Bloch); Lagny Hospital, Marne la Vallée (Eric Froguel); Victor Dupouy Hospital, Argenteuil (Philippe Genet); Simone Veil Hospital, Eaubonne (Annie Leprêtre); Foch Hospital, Suresnes (David Zucman); Georges Pompidou Hospital, Paris (Marina Karmochkine); René Dubos Hospital, Pontoise (Laurent Blum); Gilles de Corbeil Hospital, Corbeil Essones (Pierre Chevojon); Ambroise Paré Hospital, Boulogne Billancourt (Cyril Olivier); Robert Ballanger Hospital, Aulnay sous Bois (Jean-Luc Delassus); Montsouris Hospital, Paris (Loïc Bodard); Bégin Hospital, Saint Mandé (Patrick Imbert); Antoine Béclère Hospital, Clamart (François Boué); Hôtel-Dieu Hospital, Nantes (Eric Billaud); Saint-Jacques Hospital, Besançon (Christine Drobacheff-Thiébaut); Hôtel-Dieu Hospital, Lyon (Laurent Cotte); Pays d'Aix Hospital, Aix en Provence (Thierry Allègre); Côte de Nacre Hospital, Caen (Claude Bazin); Bretonneau Hospital, Tours (Pascale Nau); Charles Nicolle Hospital, Rouen (Yasmine Debab); Michallon Hospital, Grenoble (Pascale Leclercq); Pontchaillou Hospital, Rennes (Cédric Arvieux); Intercommunal Hospital, Toulon-La Seyne sur Mer (Alain Lafeuillade); Hôpital Pellegrin Hospital, Bordeaux (Jean-Marie Ragnaud, Hervé Dutronc); La Roche sur Yon Hospital (Philippe Perré); Cannes Hospital (Nathalie Montagne); Gui de Chauliac Hospital, Montpellier (Jacques Reynes); Hôtel Dieu Hospital, Clermont Ferrand (Christiane Jacomet); Archet Hospital, Nice (Frédéric Sanderson); Civil Hospital, Strasbourg (David Rey); Saint André Hospital, Bordeaux (Maïté Longy-Boursier); Angers Hospital (Jean-Marie Chennebault); Digne les Bains Hospital (Patricia Granet).
The Netherlands: The ATHENA database is maintained by Stichting HIV Monitoring and supported by a grant from the Dutch Ministry of Health, Welfare and Sport through the Centre for Infectious Disease Control of the National Institute for Public Health and the Environment.
Clinical centres
An asterisk denotes the site coordinating physician.
Academic Medical Centre of the University of Amsterdam: HIV treating physicians: J.M. Prins*, T.W. Kuijpers, H.J. Scherpbier, J.T.M. van der Meer, F.W.M.N. Wit, M.H. Godfried, P. Reiss, T. van der Poll, F.J.B. Nellen, S.E. Geerlings, M. van Vugt, D. Pajkrt, J.C. Bos, W.J. Wiersinga, M. van der Valk, A. Goorhuis, J.W. Hovius, A.M. Weijsenfeld. HIV nurse consultants: J. van Eden, A. Henderiks, A.M.H. van Hes, M. Mutschelknauss, H.E. Nobel, F.J.J. Pijnappel. HIV clinical virologists/chemists: S. Jurriaans, N.K.T. Back, H.L. Zaaijer, B. Berkhout, M.T.E. Cornelissen, C.J. Schinkel, X.V. Thomas.
Admiraal De Ruyter Ziekenhuis, Goes: HIV treating physicians: M. van den Berge, A. Stegeman. HIV nurse consultants: S. Baas, L. Hage de Looff. HIV clinical virologists/chemists: D. Versteeg.
Catharina Ziekenhuis, Eindhoven: HIV treating physicians: M.J.H. Pronk*, H.S.M. Ammerlaan. HIV nurse consultants: E.S. de Munnik. HIV clinical virologists/chemists: A.R. Jansz, J. Tjhie, M.C.A. Wegdam, B. Deiman, V. Scharnhorst.
Emma Kinderziekenhuis: HIV nurse consultants: A. van der Plas, A.M. Weijsenfeld.
Erasmus Medisch Centrum, Rotterdam: HIV treating physicians: M.E. van der Ende*, T.E.M.S. de Vries-Sluijs, E.C.M. van Gorp, C.A.M. Schurink, J.L. Nouwen, A. Verbon, B.J.A. Rijnders, H.I. Bax, M. van der Feltz. HIV nurse consultants: N. Bassant, J.E.A. van Beek, M. Vriesde, L.M. van Zonneveld. Data collection: A. de Oude-Lubbers, H.J. van den Berg-Cameron, F.B. Bruinsma-Broekman, J. de Groot, M. de Zeeuw-de Man. HIV clinical virologists/chemists: C.A.B. Boucher, M.P.G Koopmans, J.J.A van Kampen.
Erasmus Medisch Centrum–Sophia, Rotterdam: HIV treating physicians: G.J.A. Driessen, A.M.C. van Rossum. HIV nurse consultants: L.C. van der Knaap, E. Visser.
Flevoziekenhuis, Almere: HIV treating physicians: J. Branger*, A. Rijkeboer-Mes. HIV nurse consultant and data collection: C.J.H.M. Duijf-van de Ven.
HagaZiekenhuis, Den Haag: HIV treating physicians: E.F. Schippers*, C. van Nieuwkoop. HIV nurse consultants: J.M. van IJperen, J. Geilings. Data collection: G. van der Hut. HIV clinical virologist/chemist: P.F.H. Franck.
HIV Focus Centrum (DC Klinieken): HIV treating physicians: A. van Eeden*. HIV nurse consultants: W. Brokking, M. Groot, L.J.M. Elsenburg. HIV clinical virologists/chemists: M. Damen, I.S. Kwa.
Isala, Zwolle: HIV treating physicians: P.H.P. Groeneveld*, J.W. Bouwhuis. HIV nurse consultants: J.F. van den Berg, A.G.W. van Hulzen. Data collection: G.L. van der Bliek, P.C.J. Bor. HIV clinical virologists/chemists: P. Bloembergen, M.J.H.M. Wolfhagen, G.J.H.M. Ruijs.
Leids Universitair Medisch Centrum, Leiden: HIV treating physicians: F.P. Kroon*, M.G.J. de Boer, M.P. Bauer, H. Jolink, A.M. Vollaard. HIV nurse consultants: W. Dorama, N. van Holten. HIV clinical virologists/chemists: E.C.J. Claas, E. Wessels.
Maasstad Ziekenhuis, Rotterdam: HIV treating physicians: J.G. den Hollander*, K. Pogany, A. Roukens. HIV nurse consultants: M. Kastelijns, J.V. Smit, E. Smit, D. Struik-Kalkman, C. Tearno. Data collection: M. Bezemer, T. van Niekerk. HIV clinical virologists/chemists: O. Pontesilli.
Maastricht UMC+, Maastricht: HIV treating physicians: S.H. Lowe*, A.M.L. Oude Lashof, D. Posthouwer. HIV nurse consultants: R.P. Ackens, J. Schippers, R. Vergoossen. Data collection: B. Weijenberg-Maes. HIV clinical virologists/chemists: I.H.M. van Loo, T.R.A. Havenith.
MC Slotervaart, Amsterdam: HIV treating physicians: J.W. Mulder, S.M.E. Vrouenraets, F.N. Lauw. HIV nurse consultants: M.C. van Broekhuizen, H. Paap, D.J. Vlasblom. HIV clinical virologists/chemists: P.H.M. Smits.
MC Zuiderzee, Lelystad: HIV treating physicians: S. Weijer*, R. El Moussaoui. HIV nurse consultant: A.S. Bosma.
Medisch Centrum Alkmaar: HIV treating physicians: W. Kortmann*, G. van Twillert*, J.W.T. Cohen Stuart, B.M.W. Diederen. HIV nurse consultant and data collection: D. Pronk, F.A. van Truijen-Oud. HIV clinical virologists/chemists: W. A. van der Reijden, R. Jansen.
Medisch Centrum Haaglanden, Den Haag: HIV treating physicians: E.M.S. Leyten*, L.B.S. Gelinck. HIV nurse consultants: A. van Hartingsveld, C. Meerkerk, G.S. Wildenbeest. HIV clinical virologists/chemists: J.A.E.M. Mutsaers, C.L. Jansen.
Medisch Centrum Leeuwarden, Leeuwarden: HIV treating physicians: M.G.A.van Vonderen*, D.P.F. van Houte, L.M. Kampschreur. HIV nurse consultants: K. Dijkstra, S. Faber. HIV clinical virologists/chemists: J. Weel.
Medisch Spectrum Twente, Enschede: HIV treating physicians: G.J. Kootstra*, C.E. Delsing. HIV nurse consultants: M. van der Burg-van de Plas, H. Heins. Data collection: E. Lucas.
Onze Lieve Vrouwe Gasthuis, Amsterdam: HIV treating physicians: K. Brinkman*, P.H.J. Frissen, W.L. Blok, W.E.M. Schouten, G.E.L. van den Berk. HIV nurse consultants: C.J. Brouwer, G.F. Geerders, K. Hoeksema, M.J. Kleene, I.B. van der Meché, A.J.M. Toonen, S. Wijnands. HIV clinical virologists: M. Damen, D. Kwa.
Radboudumc, Nijmegen: HIV treating physicians: P.P. Koopmans, M. Keuter, A.J.A.M. van der Ven, H.J.M. ter Hofstede, A.S.M. Dofferhoff, R. van Crevel. HIV nurse consultants: M. Albers, M.E.W. Bosch, K.J.T. Grintjes-Huisman, B.J. Zomer. HIV clinical virologists/chemists: F.F. Stelma, J. Rahamat-Langendoen. HIV clinical pharmacology consultant: D. Burger.
Rijnstate, Arnhem: HIV treating physicians: C. Richter*, E.H. Gisolf, R.J. Hassing. HIV nurse consultants: G. ter Beest, P.H.M. van Bentum, N. Langebeek. HIV clinical virologists/chemists: R. Tiemessen, C.M.A. Swanink.
Sint Lucas Andreas Ziekenhuis, Amsterdam: HIV treating physicians: J. Veenstra*, K.D. Lettinga. HIV nurse consultants: M. Spelbrink, H. Sulman. Data collection: M. Spelbrink, E. Witte. HIV clinical virologists/chemists: M. Damen, S.Q. van Veen.
Spaarne Gasthuis, Haarlem: HIV treating physicians: S.F.L. van Lelyveld*, R. Soetekouw. HIV nurse consultants: N. Hulshoff, L.M.M. van der Prijt, J. van der Swaluw. Data collection: N. Bermon. HIV clinical virologists/chemists: W.A. van der Reijden, R. Jansen, B.L. Herpers, D. Veenendaal.
Stichting Medisch Centrum Jan van Goyen, Amsterdam: HIV treating physicians: D.W.M. Verhagen. HIV nurse consultants: M. van Wijk.
St Elisabeth Ziekenhuis, Tilburg: HIV treating physicians: M.E.E. van Kasteren*, A.E. Brouwer. HIV nurse consultants and data collection: B.A.F.M. de Kruijf-van de Wiel, M. Kuipers, R.M.W.J. Santegoets, B. van der Ven. HIV clinical virologists/chemists: J.H. Marcelis, A.G.M. Buiting, P.J. Kabel.
Universitair Medisch Centrum Groningen, Groningen: HIV treating physicians: W.F.W. Bierman*, H. Scholvinck, S. van Assen, K.R. Wilting, Y. Stienstra. HIV nurse consultants: H. de Groot-de Jonge, P.A. van der Meulen, D.A. de Weerd, J. Ludwig-Roukema. HIV clinical virologists/chemists: H.G.M. Niesters, A. Riezebos-Brilman, C.C. van Leer-Buter, M. Knoester.
Universitair Medisch Centrum Utrecht, Utrecht: HIV treating physicians: A.I.M. Hoepelman*, M.M.E. Schneider, T. Mudrikova, P.M. Ellerbroek, J.J. Oosterheert, J.E. Arends, R.E. Barth, M.W.M. Wassenberg, E.M. Schadd. HIV nurse consultants: D.H.M. van Elst-Laurijssen, E.E.B. van Oers-Hazelzet, J. Patist, S. Vervoort, Data collection: M. van Berkel. HIV clinical virologists/chemists: R. Schuurman, F. Verduyn-Lunel, A.M.J. Wensing.
VU medisch centrum, Amsterdam: HIV treating physicians: E.J.G. Peters*, M.A. van Agtmael, M. Bomers, J. de Vocht. HIV nurse consultants: M. Heitmuller, L.M. Laan. HIV clinical virologists/chemists: A.M. Pettersson, C.M.J.E. Vandenbroucke-Grauls, C.W. Ang.
Wilhelmina Kinderziekenhuis, UMCU, Utrecht: HIV treating physicians: S.P.M. Geelen, T.F.W. Wolfs, L.J. Bont. HIV nurse consultants: N. Nauta.
Coordinating centre
Stichting HIV Monitoring: Director: P. Reiss. Data analysis: D.O. Bezemer, A.I. van Sighem, C. Smit. Data management and quality control: S. Zaheri, M. Hillebregt, A. de Jong. Data monitoring: D. Bergsma, P. Hoekstra, A. de Lang, M. Berkhout, S. Grivell, A. Jansen, M.J. Rademaker, M. Raethke. Data collection: L. de Groot, M. van den Akker, Y. Bakker, M. Broekhoven, E. Claessen, A. El Berkaoui, E. Kruijne, C. Lodewijk, R. Meijering, L. Munjishvili, B. Peeck, C. Ree, R. Regtop, Y. Ruijs, T. Rutkens, M. Schoorl, S. Schnörr, E. Tuijn, L. Veenenberg, S. van der Vliet, T. Woudstra. Patient registration: B. Tuk.
Portugal: Clinica Universitaria de Doenças Infecciosas, Lisbon (Francisco Antunes, Kamal Mansinho, Emilia Valadas).
Spain: Hospital Carlos III, Madrid (Vicente Soriano, Ana Trevino, Berta Rodes).
Switzerland: Swiss HIV Cohort Study. The members of the Swiss HIV Cohort Study are Barth J, Battegay M, Bernasconi E, Böni J, Bucher HC, Bürgisser P, Burton-Jeangros C, Calmy A, Cavassini M, Dubs R, Egger M, Elzi L, Fehr J, Flepp M, Francioli P (President of the SHCS), Furrer H (Chairman of the Clinical and Laboratory Committee), Fux CA, Gorgievski M, Günthard H (Chairman of the Scientific Board), Hasse B, Hirsch HH, Hirschel B, Hösli I, Kahlert C, Kaiser L, Keiser O, Kind C, Klimkait T, Kovari H, Ledergerber B, Martinetti G, Martinez de Tejada B, Müller N, Nadal D, Pantaleo G, Rauch A, Regenass S, Rickenbach M (Head of Data Center), Rudin C (Chairman of the Mother & Child Substudy), Schmid P, Schultze D, Schöni-Affolter F, Schüpbach J, Speck R, Taffé P, Telenti A, Trkola A, Vernazza P, von Wyl V, Weber R, Yerly S.
Laboratories
Belgium: AIDS Reference Laboratory, Université Catholique de Louvain, AIDS Reference Laboratory, Brussels (Patrick Goubau, Jean Ruelle).
France: Cellular immunology laboratory, Pitié-Salpétrière Hospital, Paris (Brigitte Autran); virology laboratory, Bichat–Claude Bernard Hospital, Paris (Françoise Brun-Vezinet, Florence Damond, Diane Descamps), Saint-Louis Hospital, Paris (François Simon).
Italy: University of Milan, Department of Clinical Sciences ‘L. Sacco’ (Claudia Balotta).
Portugal: Hospital Egas Moniz, Lisbon (Ricardo Camacho, Perpetua Gomes); Clínica Universitária de Doenças Infecciosas e Parasitárias, Lisbon (Emília Valadas); Centro Hospitalar e Universitário de Coimbra, Coimbra (Vitor Duque).
Spain: Laboratory of Molecular Biology, Infectious Diseases Department, Hospital Carlos III, Madrid (Ana Treviño & Vincent Soriano).
Switzerland: Laboratories of the Swiss HIV Cohort Study (resp. Jürg Böni).
Coordinating centre
France: ANRS Clinical Trials Unit INSERM U1219 (Céline Roy, Geneviève Chêne, Alexandra Ozanne, Audrey Taieb).
Funding
The research leading to these results has received funding from the European Union Seventh Framework Programme (FP7/2007–2013) under EuroCoord grant agreement number 260694. The funder has not played any decision-making role in the research.
Transparency declarations
None to declare.
Author contributions
G. C. and S. M. designed the study. L. W. and S. M. drafted the manuscript. Additionally, L. W. and J. A. were responsible for performing all analyses, act as guarantors for the analyses and have full access to the data set. All members of the COHERE in EuroCoord and ACHIeV2e Study Group participated in discussion on the design of the study, the choice of statistical analyses and interpretation of the findings, and were involved in the preparation and review of the final manuscript for submission.
Supplementary data
Figure S1 and Table S1 are available as Supplementary data at JAC Online.
References
Prise en charge médicale des personnes vivant avec le VIH—Recommandations du groupe d'experts. Sous la direction du Pr Philippe Morlat et sous l'égide du CNS et de l'ANRS 2017. http://cns.sante.fr/actualites/prise-en-charge-du-vih-recommandations-du-groupe-dexperts/.
Author notes
Equal contribution.
Members are listed in the Acknowledgements section.
