


Abstract
The natural clinical and immunological courses following HIV seroconversion with CXCR4-tropic or dual-mixed (X4/DM) viruses are controversial. We compared spontaneous immunological outcome in patients harbouring an X4/DM virus at the time of seroconversion with those harbouring a CCR5-tropic (R5) virus.
Data were included from patients participating in CASCADE, a large cohort collaboration of HIV seroconverters, with ≥2 years of follow-up since seroconversion. The HIV envelope gene was sequenced from frozen plasma samples collected at enrolment, and HIV tropism was determined using Geno2Pheno (false-positive rate 10%). The spontaneous CD4 T cell evolution was compared by modelling CD4 kinetics using linear mixed-effects models with random intercept and random slope.
A total of 1387 patients were eligible. Median time between seroconversion and enrolment was 1 month (range 0–3). At enrolment, 202 of 1387 (15%) harboured an X4/DM-tropic virus. CD4 decrease slopes were not significantly different according to HIV-1 tropism during the first 30 months after seroconversion. No marked change in these results was found after adjusting for age, year of seroconversion and baseline HIV viral load. Time to antiretroviral treatment initiation was not statistically different between patients harbouring an R5 (20.76 months) and those harbouring an X4/DM-tropic virus (22.86 months, logrank test P = 0.32).
Conclusions: In this large cohort collaboration, 15% of the patients harboured an X4/DM virus close to HIV seroconversion. Patients harbouring X4/DM-tropic viruses close to seroconversion did not have an increased risk of disease progression, estimated by the decline in CD4 T cell count or time to combined ART initiation.
Introduction
HIV-1 enters its target cells through a stepwise process including attachment to CD4 receptor on the cell surface, interaction with cell surface chemokine receptors and fusion of the viral envelope and host cell membranes. Viral strains are classified as R5 when they only use the cysteine–cysteine receptor 5 (CCR5 or R5), X4 when they only use cysteine-X-cysteine receptor 4 (CXCR4 or X4) or X4/DM (dual/mixed) when both R5 and X4 viruses coexist in blood plasma. HIV transmitted through sexual activity is predominantly R5-tropic, as semen partly promotes transmission of R5-tropic viruses,1 and because transmission of X4-tropic strains appears to be constrained whatever the route of transmission.2–4 For this reason HIV variants isolated early in the course of infection use CCR5, along with CD4, to gain entry into cells,5 while X4-tropic variants emerge later, and have been associated with an accelerated decline of CD4 T cell count and progression to AIDS.6,7 R5-tropic viruses are predominant during primary HIV-1 infection (PHI), although recent findings suggest that the prevalence of X4-tropic variants can reach up to 16% during PHI.8–10 A rapid progression to AIDS has been reported in one patient shortly after primary infection with a dual-mixed X4/DM variant.11 Cross-sectional studies performed at the time of PHI have not reported any difference in CD4 T cell count in those harbouring an X4-tropic virus compared with those harbouring an R5-tropic virus.8–10 Longitudinal studies examining differences between R5 and X4 or dual-mixed (X4/DM) viruses with regards to the natural clinical and immunological courses following HIV seroconversion are scarce, and findings are conflicting. While some have suggested that X4-tropic viruses present at PHI increase the risk of immunological progression,12 others have not observed this.8 The major limitation of these longitudinal studies is their small sample size.
Here we assessed the impact of the presence of X4/DM variants (determined by genotypic assay) at the time of seroconversion on the subsequent natural evolution of CD4 T cell count and on the time to combined ART (cART) initiation in the large CASCADE collaboration cohort.
Patients and methods
CASCADE is a collaboration of 28 cohorts of individuals with well estimated dates of HIV seroconversion (seroconverters). We used data pooled in September 2014, within EuroCoord. All collaborating cohorts received approval from their regulatory or national ethics review boards. Seroconversion dates were estimated as the midpoint between the last documented negative and first positive HIV antibody test dates for most participants (84.6%) with the interval between tests being ≤3 years. For the remaining individuals, the seroconversion date was estimated through laboratory methods (PCR positivity in the absence of HIV antibodies or antigen positivity with four or fewer bands on western blot), or as the date of seroconversion illness with both an earlier negative and a later positive HIV test done within a time interval of ≤3 years.13
Data from patients participating in CASCADE were included in the present study if they had an interval of <2 years between a negative/positive ELISA or laboratory evidence of seroconversion, were enrolled after 1995, had ≥2 years of follow-up since seroconversion, were ART-naive at enrolment and had an available frozen sample within 12 months following seroconversion while ART-naive.
The HIV envelope gene was amplified and sequenced from frozen plasma samples collected at enrolment in the cohort and HIV tropism was determined using Geno2Pheno algorithm with a false-positive rate of 10%. We used specific validated algorithms to predict tropism of CRF02_AG,14 D15 and CRF01_AE16 subtype viruses. Genotypic prediction of tropism for other non-B subtype viruses was done similarly to B subtype viruses, according to the French ANRS algorithm (www.hivfrenchresistance.org). All tropism determinations were performed in the same laboratory (Virology Laboratory, Saint-Louis Hospital, Paris, France).
Patient characteristics at the time of enrolment in the respective cohorts within CASCADE were compared using the χ2 test and the Wilcoxon rank-sum test for categorical and continuous variables according to tropism R5 versus X4/DM, respectively. CD4 T cell count kinetics were analysed on a square-root scale to obtain a normal distribution and stabilize the variance. We estimated the CD4 T cell dynamics over time, accounting for the correlation among repeated measurements within each individual, through linear mixed-effects models with random intercept and random slope. Slopes of CD4 T cell counts were compared between the two groups. The mean CD4 count evolution was depicted by plotting the mixed model predictions. We sought evidence of an interaction between HIV-1 subtype and tropism. Time to cART initiation according to tropism was estimated by using Kaplan–Meier survival analysis and compared by logrank test.
We performed several sensitivity analyses. First, because specific interpretation rules were used to predict tropism for non-B HIV-1 subtypes, we examined the impact of HIV-1 tropism on CD4 T cell count evolution separately in B and in non-B HIV-1 subtypes. Second, because the French ANRS–PRIMO cohort accounted for half of the patients included in the study, and because French guidelines include specific therapeutic recommendations for PHI management,17 we also performed the analysis without data from the ANRS–PRIMO cohort.
Results
Characteristics at enrolment
A total of 1387 patients were eligible for inclusion in the study. Their characteristics are shown in Table 1, with the key finding being that median time between estimated date of seroconversion and enrolment into a CASCADE cohort was 1 month (IQR 0–3) and median time between cohort enrolment and cART initiation was 21 months. At enrolment, 202 of 1387 [14.6% (95% CI: 12.7%–16.5%)] harboured an X4/DM-tropic virus and their baseline characteristics did not differ from the 1185 harbouring an R5-tropic virus as regards to age, gender, year of enrolment, transmission group, CD4 count and HIV viral load. The only difference was HIV subtype; the prevalence of X4/DM-tropic viruses was higher in subtype B (16.4%) than in non-B subtype viruses (6.3%, P < 0.001) (Table 1).
Characteristics of eligible patients at the time of enrolment in CASCADE according to HIV-1 tropism (R5 versus X4/DM)
| All | R5 (N = 1185) | X4/DM (N = 202) | P value | |
|---|---|---|---|---|
| Males, % (n) | 87 (1213) | 88 (1040) | 86 (173) | 0.4 |
| Age at enrolment, years, median (IQR) | 35 (29–41) | 35 (29–41) | 35 (29–40) | 0.7 |
| Time of follow-up before cART, months, median (IQR) | 21 (0.7–50) | 20.76 (0.72–51) | 22.86 (0.49–47) | 0.32 |
| Year of enrolment, median (IQR) | 2005 (2002–07) | 2005 (2002–07) | 2005 (2001–07) | 0.13 |
| Time between seroconversion and enrolment, months, median (IQR) | 0.9 (0.3–2.7) | 0.9 (0.3–2.7) | 0.8 (0.3–3.2) | 0.92 |
| Transmission group, % (n) | 0.07 | |||
| homosexual/bisexual | 73 (1016) | 73 (864) | 75 (152) | |
| heterosexual | 21 (284) | 21 (247) | 18 (37) | |
| other, IVDU, haemophilia | 3 (46) | 3 (35) | 6 (11) | |
| missing | 3 (41) | 3 (39) | 1 (2) | |
| Ethnic origin, % (n) | ||||
| white | 69 (956) | 69 (818) | 68 (138) | 0.07 |
| African and other (6 Asians) | 8 (110) | 9 (101) | 5 (9) | |
| missing values | 23 (321) | 22 (266) | 27 (55) | |
| Subtype % (n) | ||||
| B | 70.7 (980) | 69 (819) | 80 (161) | <0.001 |
| CRF02_AG | 0.8 (11) | 1 (11) | 0 (0) | |
| other | 17.5 (243) | 19 (227) | 8 (16) | |
| missing | 11 (153) | 11 (128) | 12 (25) | |
| Clinical AIDS, % (n) during follow-up | 5 (74) | 5 (63) | 5 (11) | 0.9 |
| ART treatment initiated, % (n) during follow-up in the cohort (at any time) | 84 (1162) | 83 (987) | 87 (175) | 0.2 |
| Number of CD4 measurements, median (IQR) | 6 (1–11) | 6 (1–11) | 6 (1–11) | 0.6 |
| CD4 cell count (cells/mm3) at PHI diagnosis, median (IQR)a | 508 (377–673) | 510 (378–672) | 498 (366–678) | 0.6 |
| HIV viral load at PHI diagnosis, log10 copies/mL, median (IQR)b | 4.9 (4.2–5.5) | 5.0 (4.3–5.5) | 4.9 (4.2–5.4) | 0.5 |
One missing value.
116 missing values for viral load.
CD4 T cell count decline according to HIV-1 tropism
The CD4 dynamics were modelled according to tropism (Figure 1). CD4 decrease slopes were not significantly different according to HIV-1 tropism during the first 30 months following seroconversion: the slope of CD4 T cell decrease was –0.13 √CD4/month and –0.16 √CD4/month in patients harbouring a R5 or X4/DM virus, respectively. This difference did not reach statistical significance (P = 0.08, Table 2). For example, starting from 500 CD4 T cells/mm3, the model predicted that a patient harbouring an R5-tropic virus would reach a CD4 T cell count of 476 cells/mm3 after 12 months of follow-up without cART, while a patient harbouring a X4/DM-tropic virus would reach a mean of 449 CD4 T cells/mm3 at the same time point of follow-up. No marked change in these results was found after adjusting for age, year of seroconversion (<2002, 2002–05, 2005–07 and ≥2007), and baseline HIV viral load.
Spontaneous evolution of CD4 cell count in patients with R5-tropic virus versus X4/DM-tropic virus, from linear mixed-effects models
| Parameter | Estimate | SEa | P value | Adjusted estimateb | SE | P value |
|---|---|---|---|---|---|---|
| First √CD4 following seroconversion (in R5) | 23.42 | 0.47 | <0.0001 | |||
| X4 versus R5 | –0.27 | 0.39 | 0.50 | –0.24 | 0.39 | 0.53 |
| Slope √CD4/month | ||||||
| R5 | –0.13 | 0.01 | –0.14 | 0.01 | ||
| X4 | –0.16 | 0.02 | –0.17 | 0.02 | ||
| X4 versus R5 | –0.03 | 0.02 | 0.08 | –0.04 | 0.02 | 0.06 |
Standard error.
Adjusted for: age, year of seroconversion (in four categories according to percentiles <2002; ≥2002 and <2005; ≥2005 and <2007; ≥2007) and HIV viral load at PHI.
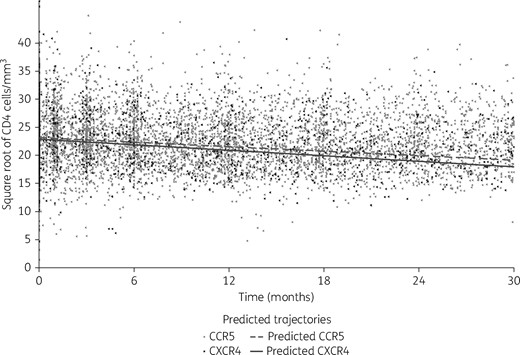
Estimated CD4 cell count decline from the piecewise linear mixed-effects model according to tropism (dashed line represents the predicted estimated CD4 cell count decline with CCR5 viruses and solid line represents the predicted estimated CD4 cell count decline with CXCR4 viruses).
Time to cART initiation according to HIV-1 tropism
A total of 225 patients did not initiate cART during follow-up: 17% with an R5-tropic virus and 13% with an X4/DM-tropic virus (P = 0.23). The Kaplan–Meier estimates of the median delay between enrolment and cART initiation were 20.76 months in patients harbouring an R5-tropic virus (IQR 0.72–51) and 22.86 months in patients with a X4/DM-tropic virus (IQR 0.49–47), with no statistically significant difference (logrank test P = 0.32; Figure 2).
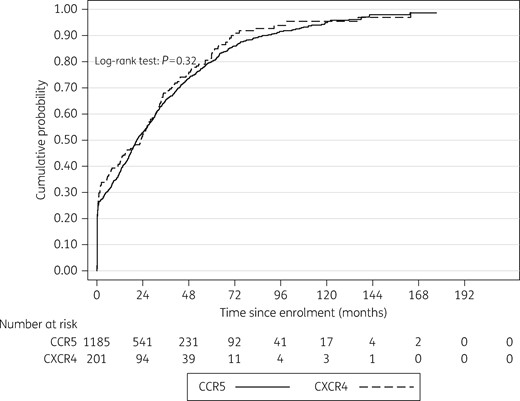
Time to cART initiation according to HIV-1 tropism (Kaplan–Meier survival curves, logrank). Dashed line represents cumulative probability of initiating cART in patients harbouring CCR5 viruses and the solid line represents the cumulative probability of initiating cART in patients harbouring CXCR4 viruses.
Sensitivity analysis
Although no statistically significant interaction was found between viral subtype and tropism in the model, we also ran the analysis separately in patients harbouring a B subtype virus and non-B virus, and found similar results. Only after excluding patients from the ANRS–PRIMO cohort, were we able to detect a statistically significant difference, albeit modest, in CD4 T cell count slope according to HIV-1 tropism, with a steeper slope for X4/DM-tropic than for R5-tropic viruses (P = 0.02). For example, starting from 500 CD4 T cells/mm3, the model predicted that a patient harbouring an R5-tropic virus would reach a CD4 T cell count of 376 cells/mm3 after 24 months of follow-up without cART, while a patient harbouring a X4/DM-tropic virus would reach a mean of 333 CD4 T cells/mm3 at the same time point of follow-up. At 30 months of follow-up, the CD4 T cell count would be 348 cells/mm3 for a patient harbouring an R5-tropic virus and 297 cells/mm3 for a patient harbouring an X4/DM-tropic virus. This difference remained statistically significant after adjusting for age, year of seroconversion (<2002, 2002–05, 2005–07 and ≥2007) and HIV viral load (P = 0.01). Again, no statistically significant interaction was found between viral subtype and tropism.
Discussion
Here we show, in the largest sample size to date, that HIV-1 X4/DM-tropic viruses can be identified in a significant proportion of patients enrolled close to seroconversion, and that X4/DM-tropic viruses are not significantly associated with a faster decline in CD4 T cell count.
Despite the fact that semen promotes the transmission of R5-tropic viruses, we showed here that, in a large sample size with >95% of patients having acquired HIV through sexual transmission, almost 15% of these patients harboured X4/DM-tropic viruses close to seroconversion. Such a proportion of X4/DM-tropic viruses at the time of seroconversion is in keeping with other smaller studies performed earlier in France and in Spain.8,9 These X4/DM viruses, when detected at the time of seroconversion, are dominant and quasi-exclusive and persist for lengthy periods of time.16,18
To the best of our knowledge, our study, by using the CASCADE collaboration cohort, has included the largest number of patients enrolled close to seroconversion. Unlike previous reports in chronically infected treatment-naive patients or in patients with advanced HIV disease,7,19,20 we show that, in recent infection, patients harbouring X4/DM-tropic viruses did not have an increased risk of disease progression, estimated by the decline in CD4 T cell count or time to cART initiation.
We were also able to address the issue of HIV-1 subtype as 18% (n = 254) of participants were infected with non-B subtypes. Some HIV-1 subtypes may have an impact on CD4 count at HIV seroconversion and CD4 rate of decline, but such subtypes are rare in CASCADE.21 Mlisana et al.22 showed that HIV-1C subtype was associated with a rapid disease progression and a faster decline in CD4 T cell count. Only one X4/DM-tropic virus belonged to the C subtype in our study. Of note, the Geno2Pheno test used to predict viral tropism has been validated for B subtype viruses.23,24 Thus, specific rules have been generated for the prediction of HIV-1 CRF02_AG, CRF01_AE and D subtype viruses,14–16 but such specific rules are not available for other non-B subtype viruses. We did not find an impact of HIV-1 tropism on CD4 T cell count slopes according to HIV-1 subtype (B versus non-B).
A potential limitation might be that data on genotypic resistance to NRTI/NNRTIs, PIs and integrase inhibitors were not available for the current study, but we have shown previously that the frequency of R5X4 viruses among patients infected with resistant viruses was similar to that in those harbouring wild-type viruses.9 Another limitation might be the lack of tropism assessment during follow-up. Indeed, some patients harbouring an R5-tropic virus at the time of seroconversion might have experienced a switch to X4-tropic virus during follow-up. However, such a co-receptor switch in the early course of the disease and without drug-selective pressure is very rare.25
Interestingly, we did find a statistically significant difference in CD4 T cell count slopes according to HIV-1 tropism when restricting the analysis to all but the ANRS–PRIMO cohort. We performed this sensitivity analysis because: (i) the ANRS–PRIMO cohort accounted for half of the patients enrolled in the present study, and (ii) French antiretroviral treatment guidelines during PHI might have differed from other countries in the past, with a more systematic and rapid antiretroviral treatment initiation during PHI.17 Indeed, rapid treatment initiation at the time of PHI may have offset the potential role of HIV-1 tropism in the subsequent CD4 T cell count natural slope. Although statistically significant, the difference in the CD4 T cell count reached after 24 months of follow-up may not be clinically relevant.
The value of determining HIV-1 tropism at the time of PHI is questionable now that all national and international guidelines recommend rapid initiation of cART in patients diagnosed at the time of PHI. Maraviroc, a CCR5 antagonist, is also not listed among the preferred antiretrovirals to be used for first-line cART. Recent data, however, suggest that the presence of CXCR4-using viruses at the time of PHI is associated with the virological failure of cART initiated during PHI.26 In addition, there is a growing interest in patients diagnosed and started on cART at the time of PHI, because they might be the best candidates for future studies addressing functional cure.27–29 Such studies require structured treatment interruptions, thus, HIV-1 tropism might also prove helpful in selecting the best candidates.
Acknowledgments
CASCADE Steering Committee
Julia Del Amo (Chair), Laurence Meyer (Vice Chair), Heiner C. Bucher, Geneviève Chêne, Osamah Hamouda, Deenan Pillay, Maria Prins, Magda Rosinska, Caroline Sabin and Giota Touloumi.
CASCADE Co-Ordinating Centre
Kholoud Porter (Project Leader), Ashley Olson, Andrea Cartier, Lorraine Fradette, Sarah Walker and Abdel Babiker.
CASCADE Clinical Advisory Board
Heiner C. Bucher, Andrea De Luca, Martin Fisher, Roberto Muga.
CASCADE Collaborators
Australia PHAEDRA cohort (Tony Kelleher, David Cooper, Pat Grey, Robert Finlayson, Mark Bloch) Sydney AIDS Prospective Study and Sydney Primary HIV Infection cohort (Tony Kelleher, Tim Ramacciotti, Linda Gelgor, David Cooper, Don Smith); Austria Austrian HIV Cohort Study (Robert Zangerle); Canada South Alberta clinic (John Gill); Estonia Tartu Ülikool (Irja Lutsar); France ANRS CO3 Aquitaine cohort (Geneviève Chêne, Francois Dabis, Rodolphe Thiebaut), ANRS CO4 French Hospital Database (Dominique Costagliola, Marguerite Guiguet), Lyon Primary Infection cohort (Philippe Vanhems), French ANRS CO6 PRIMO cohort (Marie-Laure Chaix, Jade Ghosn), ANRS CO2 SEROCO cohort (Laurence Meyer, Faroudy Boufassa); Germany German HIV-1 seroconverter cohort (Osamah Hamouda, Karolin Meixenberger, Norbert Bannert, Barbara Bartmeyer); Greece AMACS (Anastasia Antoniadou, Georgios Chrysos, Georgios L. Daikos); Greek Haemophilia cohort (Giota Touloumi, Nikos Pantazis, Olga Katsarou); Italy Italian Seroconversion Study (Giovanni Rezza, Maria Dorrucci), ICONA cohort (Antonella d’Arminio Monforte, Andrea De Luca); Netherlands Amsterdam Cohort Studies among homosexual men and drug users (Maria Prins, Ronald Geskus, Jannie van der Helm, Hanneke Schuitemaker); Norway Oslo and Ulleval Hospital cohorts (Mette Sannes, Oddbjorn Brubakk, Anne-Marte Bakken Kran); Poland National Institute of Hygiene (Magdalena Rosinska); Spain Badalona IDU hospital cohort (Roberto Muga, Jordi Tor), Barcelona IDU Cohort (Patricia Garcia de Olalla, Joan Cayla), CoRIS-scv (Julia del Amo, Santiago Moreno, Susana Monge); Madrid cohort (Julia Del Amo, Jorge del Romero), Valencia IDU cohort (Santiago Pérez-Hoyos); Sweden Swedish InfCare HIV Cohort, Sweden (Anders Sönnerborg); Switzerland Swiss HIV Cohort Study (Heiner C. Bucher, Huldrych Günthard, Alexandra Scherrer); Ukraine Perinatal Prevention of AIDS Initiative (Ruslan Malyuta); United Kingdom Public Health England (Gary Murphy), UK Register of HIV Seroconverters (Kholoud Porter, Anne Johnson, Andrew Phillips, Abdel Babiker), University College London (Deenan Pillay); African cohorts: Genital Shedding Study (US: Charles Morrison; Family Health International, Robert Salata, Case Western Reserve University, Uganda: Roy Mugerwa, Makerere University, Zimbabwe: Tsungai Chipato, University of Zimbabwe); International AIDS Vaccine Initiative (IAVI) Early Infections Cohort (Kenya, Rwanda, South Africa, Uganda, Zambia: Matt A. Price, IAVI, USA; Jill Gilmour, IAVI, UK; Anatoli Kamali, IAVI, Kenya; Etienne Karita, Projet San Francisco, Rwanda).
EuroCoord Executive Board
Fiona Burns, University College London, UK; Geneviève Chêne, University of Bordeaux, France; Dominique Costagliola (Scientific Coordinator), Institut National de la Santé et de la Recherche Médicale, France; Carlo Giaquinto, Fondazione PENTA, Italy; Jesper Grarup, Region Hovedstaden, Denmark; Ole Kirk, Region Hovedstaden, Denmark; Laurence Meyer, Institut National de la Santé et de la Recherche Médicale, France; Heather Bailey, University College London, UK; Alain Volny Anne, European AIDS Treatment Group, France; Alex Panteleev, St Petersburg City AIDS Centre, Russian Federation; Andrew Phillips, University College London, UK, Kholoud Porter, University College London, UK; Claire Thorne, University College London, UK.
EuroCoord Council of Partners
Jean-Pierre Aboulker, Institut National de la Santé et de la Recherche Médicale, France; Jan Albert, Karolinska Institute, Sweden; Silvia Asandi, Romanian Angel Appeal Foundation, Romania; Geneviève Chêne, University of Bordeaux, France; Dominique Costagliola (chair), INSERM, France; Antonella d’Arminio Monforte, ICoNA Foundation, Italy; Stéphane De Wit, St Pierre University Hospital, Belgium; Peter Reiss, Stichting HIV Monitoring, Netherlands; Julia Del Amo, Instituto de Salud Carlos III, Spain; José Gatell, Fundació Privada Clínic per a la Recerca Bíomèdica, Spain; Carlo Giaquinto, Fondazione PENTA, Italy; Osamah Hamouda, Robert Koch Institut, Germany; Igor Karpov, University of Minsk, Belarus; Bruno Ledergerber, University of Zurich, Switzerland; Jens Lundgren, Region Hovedstaden, Denmark; Ruslan Malyuta, Perinatal Prevention of AIDS Initiative, Ukraine; Claus Møller, Cadpeople A/S, Denmark; Kholoud Porter, University College London, United Kingdom; Maria Prins, Academic Medical Centre, Netherlands; Aza Rakhmanova, St Petersburg City AIDS Centre, Russian Federation; Jürgen Rockstroh, University of Bonn, Germany; Magda Rosinska, National Institute of Public Health, National Institute of Hygiene, Poland; Manjinder Sandhu, Genome Research Limited; Claire Thorne, University College London, UK; Giota Touloumi, National and Kapodistrian University of Athens, Greece; Alain Volny Anne, European AIDS Treatment Group, France.
EuroCoord External Advisory Board
David Cooper, University of New South Wales, Australia; Nikos Dedes, Positive Voice, Greece; Kevin Fenton, Public Health England, USA; David Pizzuti, Gilead Sciences, USA; Marco Vitoria, WHO, Switzerland.
EuroCoord Secretariat
Silvia Faggion, Fondazione PENTA, Italy; Lorraine Fradette, University College London, UK; Richard Frost, University College London, UK; Andrea Cartier, University College London, UK; Dorthe Raben, Region Hovedstaden, Denmark; Christine Schwimmer, University of Bordeaux, France; Martin Scott, UCL European Research & Innovation Office, UK.
Funding
This study was funded by the CASCADE collaboration in EuroCOORD.
Transparency declarations
None to declare.
References
Author notes
Members are listed in the Acknowledgements.
