


To evaluate the role of pre-treatment co-receptor tropism of plasma HIV on the achievement of viral suppression (plasma HIV RNA 1.69 log10 copies/mL) at the sixth month of combination antiretroviral therapy (cART) in a cohort of naive patients using, for the first time in this context, a path analysis (PA) approach.
Adult patients with chronic infection by subtype B HIV-1 were consecutively enrolled from the start of first-line cART (T0). Genotypic analysis of viral tropism was performed on plasma and interpreted using the bioinformatic tool Geno2pheno, with a false positive rate of 10%. A Bayesian network starting from the viro-immunological data at T0 and at the sixth month of treatment (T1) was set up and this model was evaluated using a PA approach.
A total of 262 patients (22.1% bearing an X4 virus) were included; 178 subjects (67.9%) achieved viral suppression. A significant positive indirect effect of bearing X4 virus in plasma at T0 on log10 HIV RNA at T1 was detected (P = 0.009), the magnitude of this effect was, however, over 10-fold lower than the direct effect of log10 HIV RNA at T0 on log10 HIV RNA at T1 (P = 0.000). Moreover, a significant positive indirect effect of bearing an X4 virus on log10 HIV RNA at T0 (P = 0.003) was apparent.
PA overcame the limitations implicit in common multiple regression analysis and showed the possible role of pre-treatment viral tropism at the recommended threshold on the outcome of plasma viraemia in naive patients after 6 months of therapy.
Introduction
Treatment of HIV-1 infection with combination antiretroviral therapy (cART) has greatly advanced in the recent years, improving short- and long-term health outcomes. Suppression of plasma HIV RNA is the main objective of cART because it predicts clinical benefits.1 HIV RNA suppression after 6 months of treatment with a first-line therapy including abacavir/lamivudine and tenofovir disoproxil fumarate/emtricitabine as backbone plus a PI boosted by ritonavir or an NNRTI is currently reported in 65%–80% of patients.2–4 The are many candidate predictors of early HIV RNA suppression but their effects may be intertwined. For example, pre-treatment HIV RNA >5 log10 copies/mL is a known predictor of virological non-response to antiretroviral therapy but this may be due to a preserved immune response, which may help patients to achieve more rapid reductions of HIV RNA.5
However, CD4+ T cell count >350 cells/mm3 did not predict HIV RNA < 1.69 log10 copies/mL at week 48 in the analysis performed on 1957 patients of the Swiss Cohort;6 even lower CD4+ cell counts (ranging from 153 to 229 cells/mm3) showed no correlation with HIV RNA suppression in a meta-regression analysis including 12 trials.7 We believe that the studies conducted so far applied statistical models that were intrinsically unable (even in large cohorts of patients) to disentangle the actual predictors and possible cause–effect relationships between baseline variables and virological effect of cART.
In particular, the role of pre-treatment HIV tropism as a predictor of plasma HIV RNA suppression at week 24 was evaluated both in patients with acute HIV infection and in those with a chronic disease with discordant results among studies.
Nozza et al.8 showed no significant correlations with plasma viral tropism in a cohort of 66 adult patients treated during primary HIV infection; in the study by Waters et al.9 the rates of virological suppression at the sixth month of treatment were comparable in naive patients infected with CCR5- and CXC4-using virus, regardless of the higher baseline plasma viraemia found in X4 patients (mean values: 5.15 log10 HIV RNA copies/mL versus 4.59 log10 HIV RNA copies/mL). By contrast, Seclén et al.10 concluded that CCR5 co-receptor tropism predicted successful virological suppression at week 24 and at week 48 of cART. Interestingly, in that study, the tropism reached statistical significance in multivariate analysis only at week 24, together with baseline plasma HIV RNA, which maintained its influence even at week 48.
The aim of our study was to evaluate the relevance of pre-treatment co-receptor tropism of plasma HIV on the achievement of a viral suppression (plasma HIV RNA <1.69 log10 copies/mL) at the sixth month of cART in a cohort of naive patients using, for the first time in this context, a path analysis (PA) approach as described in statistical methods. Along with tropism, a group of key variables were recorded for their possible significance as predictors (including gender and age),11–16 aiming at creating a model oriented to causal interpretation to simplify the prediction of the antiretroviral treatment effect and provoke further pathogenetic and mechanistic research.
Patients and methods
Study design
Patients >18 years old with a diagnosis of chronic infection by subtype B HIV-1 were consecutively enrolled from 1 January 2012 to 31 December 2013 at the start of first-line cART. The decision to start antiviral treatment and the choice of HIV drug regimen were at the discretion of the treating physician. Either abacavir/lamivudine or tenofovir disoproxil fumarate/emtricitabine were used as backbone, plus a third component: a PI boosted by ritonavir (atazanavir/r or darunavir/r or lopinavir/r), or an NNRTI (efavirenz or nevirapine), as prescribed by the national guidelines available at that time.17
Patients interrupting treatment or needing treatment modifications for failure or intolerance, as well as patients who had a self-reported adherence <95% were excluded from the study. The viro-immunological parameters were evaluated before cART (T0) and at the sixth month of cART (T1). Tropism analysis was performed on all samples at T0. Blood samples were collected in tubes containing EDTA, submitted within 6 h of collection to the Laboratory of Virology at the University of Padova and separated into plasma and cells by centrifugation. Aliquots of plasma were stored at −80°C until use.
Ethics
The enrolled subjects gave informed consent for the procedures and for the use of their blinded data for a scientific evaluation. This study was conducted in accordance with the Helsinki Declaration and local legislation (Ethics Committee of Padova University Hospital prot. 2606-12P).
Genotypic prediction of viral tropism
Genotypic analysis of viral tropism was performed on plasma as previously described.18 Briefly, the V3 sequences were amplified using nested PCR with 1F1 and 1R1 as the outer primers and 3F3 and 2R2 as the inner primers. We checked the number of ambiguities before running geno2pheno: they were considered relevant if the number was greater than two. In that case, the sequencing was repeated and the sample was excluded if the ambiguities were confirmed. When a single or double ambiguity gave discordant results in terms of false positive rate (FPR), sequencing was repeated.
The generated V3 sequences were then interpreted using the bioinformatic tool Geno2pheno, with an FPR of 10%. Geno2pheno is available at http://coreceptor.bioinf.mpiinf.mpg.de.19
All plasma available from the subjects gave a useful amplification and sequencing of the V3 region, allowing us to analyse all subjects.
Statistical analysis
At T0, the following variables were recorded: (i) viral co-receptor tropism in plasma, determined by sequencing and interpretation by geno2pheno algorithm; (ii) CD4+ lymphocyte count (cd0) in peripheral blood (cells/mm3); and (iii) HIV RNA in plasma expressed as log10 copies/mL (lrna0). Gender (‘female’) and age (years) were included in the analysis as well. These variables were coded as ‘tropism’ (binary, CCR5 versus CXCR4), ‘cd0’ (continuous), ‘lrna0’ (continuous), ‘age’ (continuous) and ‘gender’ (binary, male versus female). The variables tropism (tro, co-receptor HIV tropism as X4) and gender were defined as being X4 and being female in the analysis performed. Moreover, the outcome of the ART was assessed by the log10 HIV load in plasma at T1 (after 6 months of therapy), defined as ‘lrna1’. The variable ‘cd0’ was log10-transformed as ‘lcd0’ to ameliorate the distribution pattern. A preliminary approach consisted of a pairwise correlation between these variables.
No randomization of treatment was performed; however, we elaborated an additional model including therapy with PIs and with tenofovir/emtricitabine (tdfftc).
Mean CD4/CD8 ratio was evaluated at T0 in X4 and R5 patients and the Kernel density estimated method was applied. Conventional descriptive statistics were also applied when appropriate.
The pattern of correlations suggested examining the joint effect of the above-indicated set of predictive T0 variables using a PA model, since mediator variables seemed to play a role. The pattern of correlation was examined to detect any implicit suggestion arising from the data for the eventual creation of a probabilistic graphical model. This aim was assisted by the use of specialized software (R package ‘bnlearn’ v. 3.6) for setting up a Bayesian network (BN) starting from the data.20
The result was checked with a cross-validation test: patient dataset was divided into a training set (210 subjects included) and into a test set (52 subjects included). Moreover a k-fold cross-validation (k = 5) was performed. Thereafter, the BN model was evaluated using a PA approach. A similar hybrid approach, in a human genetic context, was performed recently.21 PA is a form of structural equation modelling analysis (SEMA); it is simpler than a typical SEMA model, not involving the use of latent variables. Then, the applicability of the model to a larger population than that represented in the sample was explored by performing bootstrap and jackknife techniques, and by applying not only the maximum likelihood, but also the asymptotic distribution free estimation method. The PA was deployed using the Stata v. 13.1 software package.
Results
Baseline characteristics of 262 HIV-1 B subtype-infected patients starting their first-line cART
| X4 types (58 patients) | R5 types (204 patients) | P | |
|---|---|---|---|
| Male gender, n (%) | 50 (86.2) | 165 (80.9) | 0.3519 |
| Age (years)a | 45 (41–47) | 40 (39–41) | 0.009 |
| CD4+ cell count at T0 (cells/mm3)a | 112 (80–181) | 260 (241–280) | 0.0003 |
| HIV RNA at T0 (log10 copies/mL)b | 5.35 (4.87–5.73) | 5.18 (4.57–5.58) | 0.0656 |
| Patients with HIV RNA <5 log10 copies/mL at T0, n (%) | 16 (27.6) | 73 (35.8) | 0.2456 |
| Patients with HIV RNA 5–5.69 log10 copies/mL at T0, n (%) | 26 (44.8) | 94 (46.1) | 0.8663 |
| Patients with HIV RNA >5.69 log10 copies/mL at T0, n (%) | 16 (27.6) | 37 (18.1) | 0.1146 |
aMedian and 95% CI.
bMedian and IQR.
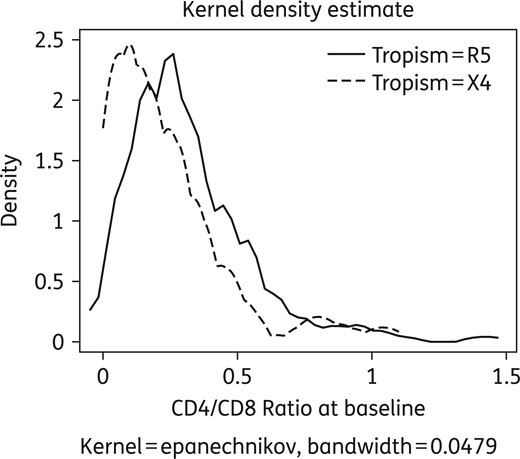
Comparative distribution of CD4/CD8 ratio values according to tropism at T0.
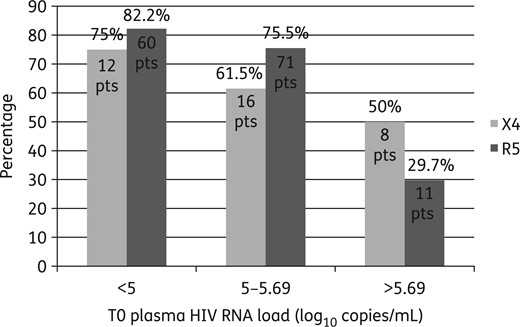
Percentages of X4 and R5 patients (pts) who obtained plasma HIV RNA suppression at T1 categorized according to T0 plasma HIV RNA value (<5, 5–5.69 or >5.69 log10 copies/mL).
The results of the pairwise correlation analysis on the main variables are reported in Table 2. The sequence of a possible causal chain was detected, assigning the role of ‘mediator variables’ to CD4 at T0 (cd0) and lrna0, whereas lrna1 appeared to be the final dependent variable. The rationale for the model setup was the likely role of mediator variables and of indirect effects in the causal chain linking HIV tropism to the eventual virological success.
Pairwise correlation analysis on the main baseline variables
| Age (years) | lcd0 | lrna0 | lrna1 | tro | Female gender | |
|---|---|---|---|---|---|---|
| Age (years) | 1 | |||||
| lcd0 | 0.1144 | 1 | ||||
| lrna0 | 0.0709 | −0.3468a | 1 | |||
| lrna1 | 0.0267 | −0.1185 | 0.3153a | 1 | ||
| tro | 0.0476 | −0.2127a | 0.1459a | 0.0597 | 1 | |
| Female gender | −0.108 | −0.0433 | −0.0251 | 0.1207 | −0.0654 | 1 |
The correlation coefficients are reported for each variable pair.
aSignificant correlations (P < 0.05).
lcd0, log10 of the absolute number of CD4+ (cells/mm3) at T0; lrna0, log10 plasma HIV RNA (copies/mL) at T0; lrna1, log10 plasma HIV RNA (copies/mL) at T1; tro, co-receptor HIV tropism as X4.
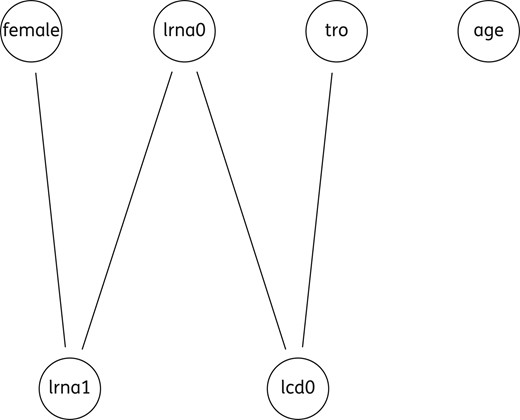
Undirected graph including five variables. lcd0, log10 of the absolute number of CD4+ (cells/mm3) at T0; lrna0, log10 plasma HIV RNA (copies/mL) at T0; lrna1, log10 plasma HIV RNA (copies/mL) at T1; tro, co-receptor HIV tropism as X4.
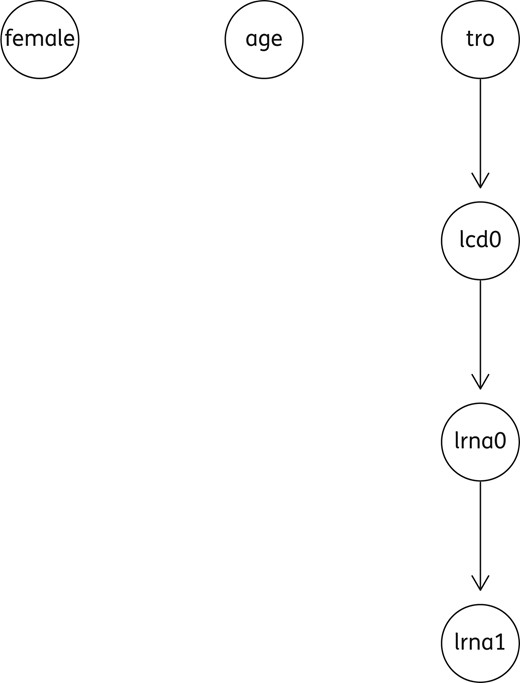
Acyclic directed graph (ADG), including a group of four variables. lcd0, log10 of the absolute number of CD4+ (cells/mm3) at T0; lrna0, log10 plasma HIVRNA (copies/mL) at T0; lrna1, log10 plasma HIVRNA (copies/mL) at T1; tro, co-receptor HIV tropism as X4.
The co-receptor HIV tropism as X4 correlated negatively to lcd0 whereas lcd0 correlated negatively to lrna0, this in turn correlated positively to lrna1. Female gender correlated positively to the final outcome, implying a lower plasma HIV RNA reduction in the female patients. No other significant correlations were found. However, after bootstrapping under the maximum likelihood method, the variable ‘gender’ lost its significance, whereas the other predictor maintained it.
Standardized regression coefficients of the PA model
| Dependent variables | Explanatory variables | Standard coefficients | Standard errors | z | P | 95% CI | |
|---|---|---|---|---|---|---|---|
| lcd0 | tro | −0.2104 | 0.0590 | −3.57 | 0.000 | −0.3259 | −0.0948 |
| intercept | 4.3389 | 0.1933 | 22.45 | 0.000 | 3.9601 | 4.7177 | |
| lrna0 | lcd0 | −0.3442 | 0.0550 | −6.26 | 0.000 | −0.4519 | −0.2364 |
| intercept | 8.4354 | 0.3445 | 24.49 | 0.000 | 7.7603 | 9.1106 | |
| lrna1 | lrna0 | 0.3190 | 0.0555 | 5.75 | 0.000 | 0.2103 | 0.4278 |
| female gender | 0.1343 | 0.0577 | 2.33 | 0.020 | 0.0211 | 0.2474 | |
| intercept | 0.0325 | 0.4160 | 0.08 | 0.938 | −0.7829 | 0.8478 | |
| var (e.lcd0) | 0.9558 | 0.0248 | 0.9084 | 1.0056 | |||
| var (e.lrna0) | 0.8815 | 0.0378 | 0.8104 | 0.9589 | |||
| var (e.lRNA1) | 0.8806 | 0.0380 | 0.8092 | 0.9582 | |||
| LR test of model versus saturated: χ2(5) = 3.10, Prob > χ2 = 0.6847 | |||||||
lcd0, log10 of the absolute number of CD4+ (cells/mm3) at T0; lrna0, log10 plasma HIV RNA (copies/mL) at T0; lrna1, log10 plasma HIV RNA (copies/mL) at T1; tro, co-receptor HIV tropism as X4; e, explanatory; var, variables; LR, linear regression.
The three linear equations composing the model are indicated starting from the dependent variables, ‘lcd0’, ‘lrna0’, and ‘lrna1’. The coefficients of the explanatory variables are standardized. Significant associations are indicated by P < 0.05; negative correlations are indicated by a ‘z’ with minus sign. The variance of the errors concerning the dependent variables is also reported. χ2 (5), is a goodness of fit; if not significant, the model can be accepted, given the data.
Direct, indirect and total (unstandardized) effects exerted by all explanatory variables in the PA model
| Effects | |||||
|---|---|---|---|---|---|
| Dependent variable | Explanatory variable | direct | indirect | total | P |
| lcd0 | tro | −0.2336 | −0.2336 | 0.001 | |
| lrna0 | tro | 0.1136 | 0.1136 | 0.003 | |
| lcd0 | −0.4861 | −0.4861 | 0.000 | ||
| lrna1 | tro | 0.0341 | 0.0341 | 0.009 | |
| lcd0 | −0.1458 | −0.1458 | 0.000 | ||
| lrna0 | 0.3000 | 0.3000 | 0.000 | ||
| female gender | 0.2416 | 0.2416 | 0.022 | ||
lcd0, log10 of the absolute number of CD4+ (cells/mm3) at T0; lrna0, log10 plasma HIV RNA (copies/mL) at T0; lrna1, log10 plasma HIV RNA (copies/mL) at T1; tro, co-receptor HIV tropism as X4.
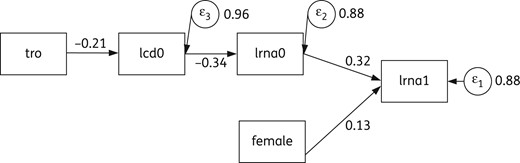
PA model explaining direct and mediated effects of ‘tro’, ‘gender’, ‘lcd0’ and ‘lrna0’ on the final outcome (‘lrna1’), where tro and female are exogenous, lcd0 and lrna0 are endogenous (mediators). Numbers near arrows indicate direct effects. Circles indicate residuals related to endogenous/dependent variables; numbers close to circles are the corresponding variances. lcd0, log10 of the absolute number of CD4+ (cells/mm3) at T0; lrna0, log10 plasma HIV RNA (copies/mL) at T0; lrna1, log10 plasma HIV RNA (copies/mL) at T1; tro, co-receptor HIV tropism as X4.
Final predictions in both sets were correlated with the corresponding test set: the mean values were RMSE = 0.648 for the training set and RMSE = 0.647 for the test set, suggesting a comparable predicting error when the model was applied to data different from the original dataset.
Discussion
The present study, based on SEMA, investigated the role of a few baseline variables in predicting the outcome of standard cART. Since the classical multivariate linear regression tends to be biased in the presence of mediator covariates, a PA model was thought to be preferable to give a rational interpretation of the interplay of the covariates.
PA showed the relevance of pre-treatment viral tropism on the outcome of plasma viraemia in naive patients after 6 months of therapy. This approach overcame the limitations implicit in common multiple regression analysis. The role of mediator variables and indirect effects, suggested by the pairwise correlation evaluation, became clearer. Namely, besides a direct effect exerted by pre-treatment plasma HIV RNA level, a significant indirect effect on the end outcome was shown for HIV co-receptor tropism and for CD4+ lymphocyte count in peripheral blood. However, if the BN model view is correct for the present data, knowing the parent node, the information from earlier ancestor nodes becomes unnecessary to predict the child node. Then, if we knew the viraemia at T0, the information from the CD4+ cell count and HIV co-receptor affinity at T0 would appear unnecessary or (at least) less important for predicting virological success under cART. The same conclusion was obtained by other investigations, but using a different approach. For example, a meta-analysis found that initial antiretroviral treatments for HIV-1 are more effective when commenced at plasma viral loads <5 log10 copies/mL.22 A total of 40 124 patients were included, their mean CD4+ cell count was 248 cells/mm3 (241 cells/mm3 in our study) and plasma HIV RNA was 4.9 log10 copies/mL (5.2 log10 copies/mL in our study); of note, the first time point to evaluate treatment efficacy was set after 48 weeks and no data on tropism was available. Armenia et al.23 showed that a FPR ≤2% was an independent predictor of unsuccessful plasma HIV RNA suppression and that other FPR cut-offs, such as the one we adopted (10%), had no significant influence: these authors demonstrated that FPR ≤2% at the moment of starting HAART is an independent predictor of a lower virological success in a real life study population.23,24
Our approach to the predictive role of tropism was slightly different because we aimed to elaborate a model including tropism and other clinical variables; furthermore we explored the role of viral tropism categorized as FPR >10% versus FPR <10%.
In our study all patients were evaluated at the sixth month of treatment and not at the first achievement of plasma HIV RNA suppression and we analysed the influence of tropism classified according to the commonly applied threshold (recommended by the European guidelines) to obtain data useful in clinical practice.25 Further, adopting a broader criterion in terms of the false positive ratio, we included more heterogeneous viral populations and quasispecies with tropism that was more R5-tropic, enhancing the role of these broarder populations in conditioning of the outcome. Our model includes only an early (6 months) and single time point: we aimed to study the role of tropism on plasma HIV RNA decay and this choice helped us to avoid confounding factors related to longer treatment periods (i.e. loss of adherence and partial virological response leading to ART modification). The patients were treated according to the guidelines available at the time of enrolment. The role of tropism in therapeutic outcome that emerged from our approach may change its value in a new therapeutic regimen including new drugs, such as integrase inhibitors; nevertheless, our data may be useful to investigate the pathogenic role of tropism on viral decay under drug pressure. The model seems compatible with accepted biomedical causal links among the included variables. In particular, HIV strains with X4 tropism can invade CD4 lymphocytes destroying them; a high CD4 lymphocyte level in peripheral blood may support an efficient immune reaction capable of lowering the plasma HIV RNA level, whereas the opposite immunological condition predicts a high viraemia state. Moreover, high pre-treatment plasma HIV RNA levels are often the premise for a modest therapeutic effect.26–28 The presence of an X4 virus was reported in 52% of patients in the late stage of the disease,29 but a correct dating of the time of infection is impossible in most patients, since the timing of infection and the transmission route are unknown. In the Veneto region the mean CD4 cell count in chronic subjects at the time of HIV diagnosis made during the period 2010–12 was 362 cells/mm3 and it was 397 cells/mm3 when the diagnosis was made during the period 2007–09.30 A medical decision has to take into account many factors, which can be potentially related and render the prediction of the result difficult.31
All patients with HIV infection should be treated, according to the most recent guidelines32 the possible role of R5 as a factor predicting the successful plasma HIV viraemia suppression could help in tailoring drug combinations in clinical practice, at least in high-income countries. The virological effect of the backbone was an intriguing aspect but analysis of X4 and R5 patients with different backbone and third drug combinations would involve too much subdivision of the data; however, the backbone and the third drug used did not reach the significance as a predictor of lrna1.
The main limitation of the study was the inclusion restricted to patients with HIV subtype B; this choice was related to insufficient sensitivity of the methods in non-B HIV strains.33 Second, we do not know whether all relevant predictors have been included in the model, thus preventing the omitted variable bias, also referred to as an endogeneity problem.34 However, this analysis cannot be viewed as an unbiased causal effect measurement. Indeed, SEMA is a method of testing a tiny fraction of the premises that make up a causal model; anyway, if that fraction is found to be compatible with the data, the method indicates the consequences of the premises.35
The use of probabilistic graphical models can help to simplify the clinical approach; BN and PA can be synergic aiming at this task, with interpretive, inferential and learning purposes. We hope that these considerations are also useful in the field of HIV therapy on real-world populations of patients, mostly in observational studies; the tropism role needs further investigations to define clearly its significance as a mediator and its independent clinical impact.36
Funding
This work was supported by Ministero dell'Università e della Ricerca Scientifico-Tecnologica ex 60% (60A07-2972/15) to M. B.
Transparency declarations
None to declare.
Supplementary data
Figure S1 is available as Supplementary data at JAC Online (http://jac.oxfordjournals.org/).
Acknowledgements
Preliminary data from this study were presented as poster presentation (P147) at the HIV Drug Therapy Glasgow Congress 2014.
