


Routine HIV-1 antiretroviral drug resistance testing for patients failing NNRTI-based regimens is not recommended in resource-limited settings. Therefore, surveys are required to monitor resistance profiles in patients failing ART.
A cross-sectional survey was conducted amongst patients failing NNRTI-based regimens in the public sector throughout South Africa. Virological failure was defined as two consecutive HIV-1 viral load results >1000 RNA copies/mL. Pol sequences were obtained using RT–PCR and Sanger sequencing and submitted to Stanford HIVdb v7.0.1.
A total of 788 sequences were available for analysis. Most patients failed a tenofovir-based NRTI backbone (74.4%) in combination with efavirenz (82.1%) after median treatment duration of 36 months. K103N (48.9%) and V106M (34.9%) were the most common NNRTI mutations. Only one-third of patients retained full susceptibility to second-generation NNRTIs such as etravirine (36.5%) and rilpivirine (27.3%). After M184V/I (82.7%), K65R was the most common NRTI mutation (45.8%). The prevalence of K65R increased to 57.5% in patients failing a tenofovir regimen without prior stavudine exposure. Cross-resistance to NRTIs was often observed, but did not seem to affect the predicted activity of zidovudine as 82.9% of patients remained fully susceptible to this drug.
The introduction of tenofovir-based first-line regimens has dramatically increased the prevalence of K65R mutations in the HIV-1-infected South African population. However, most patients failing tenofovir-based regimens remained fully susceptible to zidovudine. Based on these data, there is currently no need to change either the recommended first- or second-line ART regimens in South Africa.
Introduction
It is well established that the introduction of ART has greatly reduced morbidity and mortality in HIV-1-infected patients. In sub-Saharan Africa, the number of AIDS-related deaths fell by 42% between 2004 and 2014.1 By July 2015, 3.1 million South Africans were on ART.2 Over the years the South African national treatment guidelines have changed: prior to 2010, a first-line regimen consisting of stavudine or zidovudine in combination with lamivudine and nevirapine or efavirenz was recommended with a preferred switch to zidovudine, didanosine and ritonavir-boosted lopinavir for second-line treatment,3 whereas the 2010 guidelines advised starting patients on a tenofovir-based regimen, with a preferred switch to zidovudine, lamivudine and ritonavir-boosted lopinavir or tenofovir, lamivudine and ritonavir-boosted lopinavir for those patients failing a stavudine- or zidovudine-based first-line regimen.4 The latest guidelines emphasize the use of fixed-dose combinations in first-line treatment.5,6 These changes are expected to have an effect over time on the observed HIV-1 drug resistance profiles.
With increasing ART coverage and longer treatment, the proportion of patients experiencing ART failure, with associated drug resistance will increase and might jeopardize the long-term success of ART programmes. WHO recommends an HIV drug resistance surveillance strategy for resource-constrained settings, including a combination of monitoring early warning indicators of poor programme performance, surveillance of transmitted drug resistance and evaluation of acquired HIV-1 drug resistance.7
In South Africa drug resistance surveillance activities are conducted in combination with limited HIV-1 drug resistance testing for diagnostic use5,6 and research activities, which makes for a diverse dataset. A total of 18 studies, conducted between 2000 and 2012, have described the HIV drug resistance patterns in South Africans failing first-line treatment regimens. Six studies exclusively described HIV-1 drug resistance profiles of patients failing stavudine- or zidovudine-based regimens.8–13 In six additional studies, most patients failed stavudine- or zidovudine-based regimens, but some patients failed other regimens such as tenofovir- or didanosine-based regimens.14–19 Four studies addressed the development of mutations after exposure to tenofovir-based regimens.20–23 The final two studies did not specify the details of the ART regimens used.24,25 The majority of studies reported the M184V/I mutation as the most prevalent NRTI mutation. The presence of at least one thymidine analogue mutation (TAM) varied substantially across the various studies, ranging from none to 55%; this variation is likely due to the different treatment regimens, duration of treatment and frequency of viral load testing. The introduction of tenofovir in first-line regimens has significantly increased the frequency of the cross-resistance mutation K65R.20–23 Skhosana et al.21 reported that the use of tenofovir increased the risk of developing K65R by almost 5-fold, compared with the use of stavudine. For NNRTI mutations, there is general consensus in these reports that K103N was present in more than half of the patients. The prevalence of Y181C and V106M/A was largely dependent on the use of nevirapine or efavirenz in each population.11,12,21,23
The national treatment guidelines only recommend HIV drug resistance testing for patients failing second-line treatment.5,6 In the absence of routine HIV-1 antiretroviral drug resistance testing in first-line failures, we embarked on the first national cross-sectional survey of patients failing NNRTI-based treatment to provide information on the current resistance patterns within the South African population.
Methods
Survey design
A cross-sectional survey was designed using probability proportional to size sampling. This method ensures that samples were proportionally collected from each of the nine South African provinces, based on the number of patients receiving ART in each region. Only tier 2 and 3 facilities with at least 500 patients on ART were considered, to ensure adequate sampling options. At the time of the study, these facilities treated ∼85% of patients on ART. The number of patients on ART was obtained from the South African District Health Information System. Any patient ≥18 years old failing an NNRTI-based regimen who gave signed informed consent was eligible to be included in the study. Virological failure was defined as two consecutive HIV-1 VL (HIVVL) measurements >1000 RNA copies/mL after being exposed to an NNRTI-based regimen for at least 6 months.
Data and sample collection
Healthcare professionals at selected sentinel sites informed eligible patients about the survey, obtained written informed consent and completed a study questionnaire. Samples were collected between February 2013 and October 2014 from 91 healthcare facilities across 37 districts and nine provinces (Table S1 and Figure S1, available as Supplementary data at JAC Online). The samples were then sent to one of three participating laboratories: Tygerberg Hospital, Stellenbosch; Universitas, Bloemfontein; or Charlotte Maxeke Johannesburg Academic Hospital, Johannesburg. Upon receipt, samples were centrifuged and plasma was stored at −80°C until processing. Each laboratory used their own validated population-based in-house genotyping method to obtain pol sequences.26–28 The laboratories at Tygerberg Hospital and Charlotte Maxeke Johannesburg Academic Hospital have successfully participated in at least one international external quality assurance panel per year for at least 5 consecutive years. An inter-laboratory comparison panel was run between the Universitas laboratory and the Charlotte Maxeke Johannesburg Academic Hospital laboratory to ensure all results were comparable, regardless of the testing laboratory.
Sequence analysis
All obtained nucleotide sequences were collated at the Charlotte Maxeke Johannesburg Academic Hospital for analysis. The Stanford HIVdb v7.0.1 tool (http://sierra2.stanford.edu/sierra/servlet/JSierra) was used to identify drug resistance mutations and generate predicted resistance profiles. Predicted antiretroviral drug resistance profiles were categorized as being susceptible (including potential low-level resistance), intermediate resistance (including low-level resistance) or high-level drug resistance.
Sequences were aligned using Muscle29 and PhyML v 3.130 and FastTree31,32 were used to construct a phylogenetic tree to ensure that no duplicate patient samples were included in the analyses.
Subtyping
A multiple alignment of the 788 nucleotide sequences with the 2010 subtype reference sequences from HIV-1 subtypes A–K, and several Circulating Recombinant Forms (http://www.hiv.lanl.gov/), were generated using Clustal X (version 2.1) (http://www.clustal.org) to determine subtypes The generated Clustal X alignment was used to construct a Neighbour-Joining phylogenetic tree in MEGA 7 (http://www.megasoftware.net) with the Kimura two-parameter model. The stability of the nodes was assessed by bootstrap analysis (1000 replicates), and bootstrap values >70% were considered significant.
In addition, pol subtyping was performed using Rega HIV subtyping tool v2.0 (http://bioafrica.net/rega-genotype/html/subtypinghiv.html). Any sequence that was assigned to be a non-C subtype was also analysed using the NCBI genotyping tool http://www.ncbi.nlm.nih.gov/projects/genotyping/ and the jumping profile HMM tool http://jphmm.gobics.de/submission_hiv.html to confirm the subtype.
Statistical analysis
Statistical analyses were performed using GraphPad Prism 6 and SAS v9.3. Differences between groups for non-parametric data were calculated using the two-sided Wilcoxon–Mann–Whitney test. Two-sided Fisher's exact tests were performed to assess proportional differences between groups for gender and mutation prevalence. P < 0.05 was considered statistically significant. The 95% CIs were calculated using the modified Wald method. Log-binomial regression analysis was used to test the association between different mutations and antiretroviral drug pressure. The relative risks (RRs) and corresponding 95% CIs are presented. Mutations identified as being significantly associated with drug pressure in the univariate analysis (P < 0.2) and a priori variables of importance were included in multivariate models. Models were adjusted (aRR) for CD4 count, HIVVL, total time on ART and time on current ART where possible, which was dependent on sample sizes.
Sequence data
The pol nucleotide sequences were submitted to GenBank using Sequin v9.50 (www.ncbi.nlm.nih.gov/Sequin) and are available under accession numbers KU127587–KU128374.
Ethics statement
This study was conducted with ethics clearance by the Research on Human Subjects (Medical) Committee at the University of the Witwatersrand (Clearance Number M120254). Written informed consent was obtained from all participants prior to sample collection.
Results
A total of 1033 samples were collected from eight provinces (no samples could be obtained from the Northern Cape province). Only 788 samples were included for analysis. The main reason for exclusion was the inability of obtaining a PCR product (n = 151, 14.6%). Other reasons for exclusion from the study were: volunteers <18 years of age (n = 35, 3.4%); <6 months of ART exposure (n = 16, 1.5%); treatment with a non-standard regimen at time of failure (n = 11, 1.1%); inadequate completion of informed consent (n = 10, 1.0%); poor sample integrity (n = 8, 0.8%); <6 months of NNRTI exposure (n = 6, 0.6%); or failure to obtain a sequence (n = 3, 0.3%). In addition, five sequences (0.5%) were shown to be duplicate samples as per phylogenetic analysis. The quality of samples for which no PCR product could be obtained may have been compromised by prolonged transport time or, more likely, had a low HIVVL. The median HIVVL was significantly lower for the samples that failed PCR (4.0 log copies/mL) versus those that could be reported (4.7 log copies/mL, P < 0.0001). The median time between the latest HIVVL and the date of sample collection for resistance testing was significantly higher for the samples for which no result could be obtained (58 days) versus those that could be reported (46 days, P = 0.0059). Due to budgetary reasons, virological failure at time of sample collection could not be confirmed in the laboratory prior to HIV drug resistance testing.
Most patients were female (n = 511, 64.8%) and the median age was 36 years. Patients had been exposed to ART for a median duration of 36 months (IQR: 19–59). The latest HIVVL was taken 47 days (median, IQR: 28–84) prior to the study sample, with a median HIVVL of 4.7 log RNA copies/mL (IQR: 4.2–5.2). A summary of other baseline clinical characteristics is presented in Table 1.
Demographic and baseline clinical characteristics for patients failing NNRTI-based regimens throughout South Africa
| Variable | Number of observations | Percentage of observations | Median | IQR | Minimum–maximum |
|---|---|---|---|---|---|
| Gender (female) | 511 | 64.8 | |||
| Age | 788 | 100.0 | 36 | 31–42 | 18–89 |
| Time between diagnosis and study sample (months) | 677 | 85.9 | 52 | 28–82 | 7–277 |
| Baseline CD4 (cells/mm3) | 644 | 81.7 | 93 | 34–172 | 0–1111 |
| Latest CD4 (cells/mm3) | 728 | 92.4 | 173 | 70–305 | 1–1020 |
| Time between latest CD4 and study sample (days) | 725 | 92.0 | 106 | 35–210 | 0–3005 |
| Latest HIVVL (log copies/mL) | 762 | 96.7 | 4.7 | 4.2–5.2 | 3.0–8.0 |
| Time between latest HIVVL and study sample (days) | 757 | 96.1 | 47 | 28–84 | 0–540 |
| Previous HIVVL (log copies/mL) | 658 | 83.5 | 4.5 | 3.8–5.0 | 1.3–6.7 |
| Time between previous HIVVL and latest HIVVL (days) | 634 | 80.5 | 163 | 106–300 | 14–2818 |
| Time on current regimen | 764 | 97.0 | 20 | 10–37 | 1–168 |
| Total time on NNRTI regimen (months) | 754 | 95.7 | 35 | 19–58 | 7–168 |
| Total time on ART (months) | 761 | 96.6 | 36 | 19–59 | 7–168 |
| NRTI backbone | |||||
| TDF + 3TC | 412 | 52.3 | |||
| TDF + FTC | 174 | 22.1 | |||
| d4T + 3TC | 116 | 14.7 | |||
| ZDV + 3TC | 55 | 7.0 | |||
| ABC + 3TC | 22 | 2.8 | |||
| other | 9 | 1.1 | |||
| NNRTI backbone | |||||
| EFV | 647 | 82.1 | |||
| NVP | 141 | 17.9 | |||
HIVVL, viral load; TDF, tenofovir; 3TC, lamivudine; FTC, emtricitabine; d4T, stavudine; ZDV, zidovudine; ABC, abacavir; EFV, efavirenz; NVP, nevirapine.
The implementation of the various ART guidelines is reflected in the use of both the NRTI backbone and the choice of NNRTI (Table 1). Over half of the patients were treated with a tenofovir and lamivudine backbone and an additional 22.1% of patients received a tenofovir and emtricitabine backbone at the time of resistance testing. The proportion of emtricitabine use might be under-represented as some healthcare workers consider emtricitabine and lamivudine to be the same. Overall, 304 patients (38.6%) had been exposed to stavudine at some stage during their ART; 118 of these patients (15.0%) were still receiving a stavudine regimen at the time of sampling. When analysing the NRTI backbone data, a distinction was made between those currently failing a tenofovir-based regimen without prior exposure to stavudine (‘tenofovir-only group’, n = 424); those failing a tenofovir-based regimen with recorded prior exposure to stavudine (‘tenofovir, prior stavudine group’, n = 162); those failing a stavudine-based regimen (‘stavudine group’, n = 118); patients failing a zidovudine-based regimen (‘zidovudine group’, n = 55) and finally patients failing any other regimens (‘other group’, n = 29). Patients failing a tenofovir-only regimen had a significantly higher median HIVVL and lower CD4 count compared with stavudine-treated patients, zidovudine-treated patients and those failing tenofovir with known prior exposure to stavudine (Table 2).
Comparison of CD4 count, HIVVL measurements and time on ART between different treatment groups for patients failing an NNRTI-based ART regimen throughout South Africa
| Treatment group | CD4 count (cells/mm3) | HIVVL (log copies/mL) | Total time on ART (months) | ||||
|---|---|---|---|---|---|---|---|
| Reference group | median | P | median | P | median | P | |
| TDF only (n = 424) | 141 | 4.8 | 25 | ||||
| TDF prior d4T | 188 | 0.0022 | 4.7 | 0.0126 | 62 | <0.0001 | |
| d4T | 210 | <0.0001 | 4.5 | <0.0001 | 52 | <0.0001 | |
| ZDV | 249 | <0.0001 | 4.5 | 0.0104 | 53 | <0.0001 | |
| other | 171 | NS | 4.7 | NS | 29 | NS | |
| TDF prior d4T (n = 162) | 188 | 4.7 | 62 | ||||
| d4T | 210 | NS | 4.5 | NS | 52 | 0.0077 | |
| ZDV | 249 | NS | 4.5 | NS | 53 | NS | |
| other | 171 | NS | 4.7 | NS | 29 | <0.0001 | |
| d4T (n = 118) | 210 | 4.5 | 52 | ||||
| ZDV | 249 | NS | 4.5 | NS | 53 | NS | |
| other | 171 | NS | 4.7 | NS | 29 | 0.0004 | |
| ZDV (n = 55) | 249 | 4.5 | 53 | ||||
| other (n = 29) | 171 | 0.0236 | 4.7 | NS | 29 | 0.0093 | |
| EFV (n = 647) | 163 | 4.8 | 34 | ||||
| NVP (n = 141) | 239 | 0.0010 | 4.5 | 0.0012 | 45 | 0.0004 | |
TDF, tenofovir; d4T, stavudine; ZDV, zidovudine; EFV, efavirenz; NVP, nevirapine; NS, not significant.
As per national guidelines, efavirenz is the preferred NNRTI with 82.1% of the patients receiving efavirenz at the time of sample collection (Table 1). Patients failing an efavirenz-based regimen presented with a higher HIVVL and lower CD4 count compared with those failing a nevirapine-based regimen (Table 2). For further analysis the treatment groups were split into efavirenz-based (n = 647) versus nevirapine-based (n = 141).
Significant differences were observed for the total time on ART between the various groups. Patients failing a tenofovir-based regimen without prior exposure to stavudine had been treated for an average of 25 months versus 62, 52 and 53 months for tenofovir with prior exposure to stavudine, stavudine and zidovudine-treated patients, respectively (P < 0.0001), which is reflective of the earlier introduction of stavudine and zidovudine in the national treatment guidelines. Likewise, patients treated with efavirenz at the time of sample collection had been treated for a shorter time compared with those that were still on a nevirapine-based regimen (34 versus 45 months; Table 2).
Sixteen patients (2.0%) had exposure to a PI during their treatment history; however, they were receiving an NNRTI-based regimen at the time of drug resistance testing.
Most patients (n = 773, 98.1%) were infected with HIV-1 subtype C, which is the predominant subtype circulating in South Africa. The remaining 15 patients were infected with a C–D recombinant (n = 3), subtype A1 (n = 2), subtype B (n = 2), A1–C recombinant (n = 2), CRF01_AE (n = 1), CRF02_AG (n = 1), subtype G (n = 1) and A1–D recombinant (n = 1) virus. For two patients, the pol subtype could not be determined.
Completely susceptible resistance profiles across the three drug classes (PI, NRTI and NNRTI) were observed in only 31 of 788 patients (3.9%, 95% CI = 2.8%–5.6%). This included nine patients who presented with intermediate resistance caused by the presence of one or more polymorphisms (T74S, Q58E and E138A), which are common in HIV-1 subtype C, without the need for drug pressure.
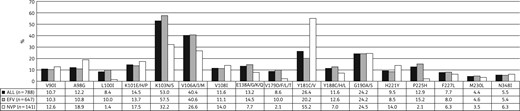
Prevalence of NNRTI mutations observed in 788 South African patients failing efavirenz (EFV)- or nevirapine (NVP)-based NNRTI regimens.
More than 90% of the patients failing NNRTI-based regimens have lost any susceptibility to the first-generation NNRTI drugs, nevirapine and efavirenz. Only one-third of these patients remain fully susceptible to the second-generation NNRTIs such as etravirine (36.5%) and rilpivirine (27.3%; Figure S2). Patients exposed to efavirenz at the time of resistance testing were twice as likely to remain fully susceptible to etravirine (n = 258, 39.9%) versus those failing a nevirapine-based regimen (n = 29, 20.6%, aRR = 0.48, 95% CI = 0.35–0.66, P < 0.0001). Similar differences were observed for rilpivirine where 194 patients (30.0%) failing efavirenz-based regimens remained fully susceptible to rilpivirine versus only 20 (14.2%) nevirapine-exposed patients (aRR = 0.42, 95% CI = 0.27–0.66, P < 0.0001).
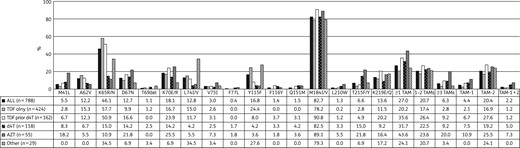
Prevalence of NRTI mutations observed in 788 South African patients failing NNRTI-based regimens. TDF, tenofovir; d4T, stavudine; ZDV, zidovudine.

NRTI drug resistance profiles in 788 South African patients failing NNRTI-based regimens. Group 1: all patients failing an NNRTI-based regimen (n = 788). Group 2: patients failing a tenofovir-based regimen (n = 424). Group 3: patients failing a tenofovir-based regimen with prior exposure to stavudine (n = 162). Group 4: patients failing a stavudine-based regimen (n = 118). Group 5: patients failing a zidovudine-based regimen (n = 55). Group 6: patients failing other regimens (n = 29). Resistance calls: susceptible (S; white), intermediate resistance (IR; grey) and high-level resistance (HLR; black). 3TC, lamivudine; FTC, emtricitabine; ABC, abacavir; ZDV, zidovudine; d4T, stavudine; ddI, didanosine; TDF, tenofovir.
One in five patients (n = 150, 19.0%) presented with the T74S PI polymorphism, causing intermediate resistance to ritonavir-boosted nelfinavir. The polymorphisms Q58E and L23I were detected in seven and one patient, causing intermediate resistance to ritonavir-boosted tipranavir and ritonavir-boosted nelfinavir, respectively. Six patients (0.8%) presented with at least one major PI mutation; however, only one of these patients was amongst the 16 who had recorded exposure to a ritonavir-boosted lopinavir-based regimen. Five of the six patients presented with a single major PI mutation: M46L (n = 2), I54V (n = 1), V82A (n = 1) and L90M (n = 1). The last patient presented with a combination of three major PI mutations (I54V, V82A and L90M).
Discussion
The first national survey amongst South African patients failing an NNRTI-based regimen in the public sector, which was conducted between February 2013 and October 2014, confirmed good adherence to the current treatment guidelines, as more than half of the patients were failing a regimen based on a tenofovir and lamivudine backbone, which has been the recommendation since 2010.4 In addition, almost one in four patients were failing the fixed-dose combination (tenofovir, emtricitabine and efavirenz), which has been implemented in the public sector since 2013.5 Adherence to the national treatment guidelines was also reflected in the common use of efavirenz (82.1%).
The frequency of completely drug susceptible virus (3.9%) was shown to be substantially lower in this survey compared with previously published studies from South Africa where the prevalence of susceptible virus ranged from 4.7% to 66.2%.8–20,24 This might indicate that the level of adherence to ART among patients has improved over time as fully drug susceptible virus is only expected in patients that have an extremely low adherence to their drug regimens.33 Alternatively, healthcare workers have refined the selection criteria to identify true treatment failures.
K103N remains the most common NNRTI mutation, previous studies have shown that Y181C is more common in patients exposed to nevirapine, whereas patients exposed to efavirenz more often present with V106M/A;11,12,21,23 these findings have been confirmed in this survey.
The M184V/I mutation remains the most common NRTI mutation, which is known to develop rapidly after lamivudine or emtricitabine exposure; however, lamivudine is recycled in second-line regimens to maintain this mutation due to the negative effect on viral fitness.34–36 The second most common NRTI mutation was K65R, this mutation is known to be rapidly selected under tenofovir pressure in HIV-1 subtype C.37–40 Although this mutation causes cross-resistance to most NRTIs, it is also known to have a crippling effect on viral fitness, comparable to M184V.36,41 Overall, at least one in five patients presented with ≥1 TAM, although the frequency remained highest in patients failing zidovudine-based regimens. The Q151M mutation was rarely observed and was only seen in patients failing stavudine- and zidovudine-based regimens, or patients that had previously been exposed to stavudine. The Y115F mutation, which is commonly selected under abacavir pressure,42 was most commonly observed in the other group (27.6%), which is not surprising as 23 of 29 patients in this group failed an abacavir-based regimen. However, this mutation was also present in 24.5% of the patients in the tenofovir-only group. In vitro experiments have shown that this mutation is often selected after the selection of K65R.43 Similarly, in the population surveyed, 84.8% of patients who presented with Y115F in the tenofovir-only group also presented with the K65R mutation.
Due to the relatively high prevalence of K65R and TAMs, most patients presented with NRTI cross-resistance patterns; however, 82.9% of these patients remained fully susceptible to zidovudine. The frequency of zidovudine susceptibility increased to 92.2% in patients who were failing a tenofovir-based regimen without prior exposure to stavudine. This finding indicates the currently available second-line regimens are still suitable for most patients failing an NNRTI-based regimen. There is, however, a concern in patients for whom zidovudine might be contra-indicated due to anaemia, as only 10% of patients remained fully susceptible to abacavir. However, a recent randomized controlled trial has shown that a PI-based second-line regimen in combination with an NRTI backbone was superior to PI monotherapy and non-inferior to ritonavir-boosted lopinavir combined with raltegravir.44 Furthermore, the finding of substantial residual activity of the NRTI backbone, despite the presence of extensive NRTI cross-resistance, was remarkable.44 In addition, this study found that patients with multiple resistance mutations at first-line failure were more likely to become suppressed when exposed to second-line regimens, as compared with those without resistance mutations. This study supported prior data from the SECOND-LINE study45 and observational cohort data,46 which showed that ritonavir-boosted lopinavir-based second-line regimen success is independent of NRTI resistance. This observation can likely be explained by the fact that those patients who do develop resistance have better adherence compared with those without mutations. Therefore, most patients who are empirically switched to a PI-based second-line regimen are likely to suppress, provided good treatment adherence is observed.47
The use of second-generation NNRTIs in third and salvage regimens should be addressed with caution as only one-third of the patients failing NNRTI-based regimens remained fully susceptible to rilpivirine and/or etravirine. Since routine HIV-1 drug resistance testing is not recommended after first-line failure, these NNRTI mutations and resistance profiles might be underestimated when resistance testing is performed at second-line failure, when some of these mutations might have become minority populations, and therefore undetectable by standard genotyping assays, due to the lack of exposure to NNRTIs during second-line treatment.
Despite the careful design of this national HIV drug resistance survey, a cross-sectional survey is known to have some limitations. Only healthcare facilities with at least 500 patients on ART were considered as a collection site; however, these facilities are responsible for 85% of the South African population on ART. Data on the total number of patients failing ART at the time of study in each of the participating facilities were unavailable; therefore, it is unknown which proportion of patients failing ART were surveyed, and baseline characteristics between patients included in the study could not be compared with the overall population failing ART. The study was dependent on the willingness of healthcare workers to obtain written consent from patients, complete study questionnaires and collect specimens. These activities place a burden on clinics that are often already understaffed. This resulted in a relatively prolonged period of sample collection to reach the desired sample size, with some areas, being under-represented by healthcare facilities unable to participate (Table S1). Additionally, the data quality was dependent on the completeness and accuracy of the questionnaires. Treatment history may have been incomplete due to patients transferring from one healthcare facility to another and no direct questions on prevention of mother-to-child transmission exposure were posed. Some bias could have been introduced if healthcare workers were more or less likely to include patients that were suspected of being non-adherent. This potential selection bias could not be verified due to the large number of collection sites. Patients were not systematically sampled at the clinic level; however, we do not believe that it is possible for clinicians to select failing patients based upon demographic or clinical characteristics that would bias the proportion of HIV drug resistance mutations.
Finally, resistance mutations were detected by population-based Sanger sequencing, the sensitivity of this method may have underestimated the prevalence of minority drug resistance mutations, particularly in patients who were non-compliant, or have been exposed to multiple antiretroviral drugs over time. It is known that drug resistance mutations can often not be picked up in the bulk viral population using population-based sequencing, without the presence of antiretroviral drug pressure. It is therefore possible that archived mutations were missed in this analysis.
Overall, given the total sample size of the survey we are confident that these results represent a close reflection of the situation of antiretroviral drug resistance in HIV-1-infected patients in care in the South African ART programme. Based on the findings of this national survey there is currently no evidence to change the recommended first- or second-line regimens.
Funding
This work was funded by The Global Fund to Fight AIDS, Tuberculosis and Malaria (SAF-H-RTC, www.theglobalfund.org). The funder had no role in study design, data collection and analysis, decision to publish or preparation of the manuscript.
Transparency declarations
None to declare.
Disclaimer
The views described herein are the views of the researchers involved, and do not represent the views or opinions of The Global Fund to Fight AIDS, Tuberculosis and Malaria; nor is there any approval or authorization of this material, express or implied, by The Global Fund to Fight AIDS, Tuberculosis and Malaria.
Supplementary data
Acknowledgements
Preliminary data from this manuscript were presented as a poster at the International AIDS Society Conference, Vancouver, Canada, 2015 (TUPEB288).
We would like to thank all study participants, healthcare workers and regional ART programme coordinators who made this study possible. In addition, we would like to show our gratitude to E. Letsoalo, A. Lukhwareni, C. Mutuku, L. Skhosana, H. Zwane, A. Bester and M. Claassen, the staff at the HIV drug resistance testing laboratories, who ensured that all samples were processed in a timely manner. In addition, we thank L. Noble for assisting with data capture.
