


Abstract
While Amikacin Inhale (BAY41-6551), an integrated drug–device combination under development, achieves an estimated amikacin epithelial lining fluid (ELF) concentration of ∼5000 mg/L, its target site pharmacodynamics are unknown. We evaluated the pharmacodynamics of ELF exposure of inhaled amikacin ± meropenem.
ELF exposures of inhaled amikacin (400 mg every 12 h), intravenous meropenem (2 g every 8 h) and a combination of both were studied in an in vitro pharmacodynamic model. Seven Klebsiella pneumoniae and 10 Pseudomonas aeruginosa with amikacin/meropenem MICs of 1 to 32 768/≤0.125 to >128 mg/L were included. Efficacy was assessed over 24–72 h.
The mean ± SD 0 h bacterial density was 6.5 ± 0.1 log10 cfu/mL. Controls grew to 8.0 ± 0.5 log10 cfu/mL by the end of the experiments. Simulation of inhaled amikacin monotherapy rapidly achieved and sustained bactericidal activity near the limit of detection over 24 h for all 13 isolates with amikacin MIC ≤256 mg/L except only ∼2 log10 cfu/mL reduction was observed in K. pneumoniae 375 (amikacin/meropenem MIC 64/32 mg/L) and P. aeruginosa 1544 (amikacin/meropenem MIC 64/128 mg/L). No activity was seen against the three isolates with amikacin MIC ≥2048 mg/L. Among the six isolates tested with meropenem monotherapy, five (meropenem MIC ≥16 mg/L) grew similarly to the controls while one (meropenem MIC 2 mg/L) achieved ∼2.5 log10 cfu/mL decrease. Among seven isolates tested in combination, four (amikacin/meropenem MIC ≤64/32 mg/L), including K. pneumoniae 375, maintained limit of detection until 72 h, whereas P. aeruginosa 1544 sustained a 1 log reduction. Combination therapy had no activity against the two isolates with amikacin MIC ≥2048 mg/L.
Inhaled amikacin monotherapy showed bactericidal activity against most isolates tested with amikacin MICs ≤256 mg/L. Adjunct inhaled amikacin plus meropenem sustained this activity for 72 h for the tested isolates with amikacin/meropenem MIC ≤64/32 mg/L.
Introduction
Hospital-acquired and ventilator-associated pneumonia are the most common nosocomial infections in critically ill patients, and account for the high mortality and morbidity in this patient population.1,2 Gram-negative organisms are major (49.2%–76.1%) causes of these infections and carry a high risk of resistance.1,3–6 Amikacin is an aminoglycoside that has activity against Gram-negative organisms, including some drug-resistant organisms. Given that sufficient drug concentrations in epithelial lining fluid (ELF) are critical in treating pneumonia, the ability of systemic amikacin to achieve the concentrations required to inhibit these resistant organisms is limited by its toxicity and poor penetration into the lung.7
In an effort to achieve adequate drug concentrations in ELF while minimizing systemic toxicities, Amikacin Inhale (BAY41-6551) is being developed utilizing amikacin specifically formulated for inhalation delivered via a proprietary gasless vibrating mesh nebulizer, the Pulmonary Drug Delivery System (PDDS).8 The PDDS nebulizer integrates with standard mechanical ventilation equipment or with a handheld inhalation unit delivering an estimated 50%–70% of the nominal dose to the lower airways.9 From the two Phase II trials8,10 in nosocomial pneumonia, PDDS delivery of Amikacin Inhalation Solution (400 mg amikacin every 12 h) achieved peak steady-state ELF amikacin concentrations of 136–16 128 mg/L while maintaining the peak serum concentrations <5 mg/L. Also, the same regimen achieved a tracheal aspirate amikacin maximum concentration of ≥25 times a reference MIC for hospital-acquired organisms of 256 mg/L (i.e. ≥6400 mg/L) in 66.7% of patients.8 While these data suggest that sufficient amikacin bronchopulmonary concentrations should be maintained in the wake of low systemic exposures, the resulting pharmacodynamic profile of amikacin at this bronchopulmonary site has yet to be characterized against organisms commonly encountered in the setting of intubated and mechanically ventilated pneumonia.
This study characterized the in vitro pharmacodynamics of human simulated amikacin ELF concentrations delivered via PDDS as monotherapy and as an adjunct to human simulated ELF exposures of meropenem against susceptible and non-susceptible Klebsiella pneumoniae and Pseudomonas aeruginosa.
Materials and methods
Bacterial strains with genotyping and susceptibility testing
Seven K. pneumoniae and 10 P. aeruginosa isolates were studied. Among those, a total of 16 were tested against amikacin monotherapy, 6 against meropenem monotherapy and 7 against combination therapy (Table 1). Isolates for combination studies were selected based on the phenotypic profiles as well as the antibacterial activities observed from amikacin monotherapy (i.e. isolates that may show the added benefits from combination therapy, such as the isolates that regrew from the amikacin monotherapy). Eight isolates that were known to express 16S rRNA methylase, MexXY or aminoglycoside-modifying enzyme were provided from other investigators and the rest were selected from the organism bank at the Center for Anti-Infective Research and Development, Hartford Hospital (Hartford, CT, USA) based on amikacin and meropenem MICs, the source of isolates and the presence of KPC. WGS was performed using an Illumina MiSeq desktop sequencer at Walter Reed Army Institute of Research (Silver Spring, MD, USA), as previously described.11,12 Multilocus sequence type profiles for K. pneumoniae and P. aeruginosa were determined based on the database maintained by the Institut Pasteur (Paris, France) and by NCBI (Bethesda, MD, USA), respectively. Amikacin and meropenem MICs were determined in triplicate by broth microdilution according to CLSI recommendations.13 The modal MIC was reported.
Genotypic and phenotypic profile of 17 isolates tested in the in vitro pharmacodynamic modela
| Isolate numberb | MLSTc | Genotype | Amikacin MIC (mg/L) | Meropenem MIC (mg/L) |
|---|---|---|---|---|
| KP C23#27 | unknown | blaOKP-B-15, fosA9 | 1 | 1 |
| KP 376d,e | 258 | ant(3′)-Ia, ant(2′)-Ia, strA, strB, aadA1, aac(6′)-Ib, aph(3′)-Ib, fosA9, catA1, blaSHV-11, blaOXA-9, blvnaTEM-1A, blaKPC-3, mphA, dfrA12, sul1, sul2 | 16 | 32 |
| KP 329Bd | 258 | ant(3′)-Ia, ant(2′)-Ia, aadA1, aadA2, aac(6′)-Ib, aph(3′)-Ia, aph(4′)-Ia, fosA9, catA1, blaSHV-11, blaSHV-5, blaOXA-9, blaTEM-1, blaKPC-2, mphA, dfrA12, sul1, sul3 | 32 | 32 |
| KP 375d,e | 258 | ant(3′)-Ia, ant(2′)-Ia, aac(6′)-Ib (two copies), strA, strB, aadA1, aph(3′)-Ia, fosA9, catA1, blaSHV-5, blaOXA-9, blaTEM-1A, blaKPC-3, mphA, dfrA12, dfrA14, sul1, sul2 | 64 | 32 |
| KP 352e | 258 | aac(6′)-Ib C, aph(3′)-Ia, fosA9, catA1, blaSHV-11, blaKPC-3, dfrA12, sul1 | 64 | 32 |
| KP 508d,e | 437 | ant(3′)-Ia, aac(6′)-Ib-cr, aph(3′)-Ia, rmtD, blaCTX-M-11, blaSHV-11, blaOXA-1, blaTEM-1A, blaKPC-2, catB3, fosA9, mphA, erm(42), qnrB1, sul1, sul2, tetA, tetD, dfrA5, dfrA22 | 16 384 | 16 |
| KP 510 | 1 | ant(3′)-Ia, ant(2′)-Ia, aph(6′)-Ib, aph(3′)-Ia, aac(3′)-IIa, armA, blaCTX-M-11, blaSHV-11, blaDHA-1, blaTEM-1A, fosA9, mphA, mphE, msrE, qnrB4, sul1, dfrA12, dfrA14 | 32 768 | ≤0.125 |
| PSA 974 | 111 | aph(3′)-IIb, blaOXA-50, catB4, fosA1 | 1 | 64 |
| PSA 1184 | 155 | aadA7, aac(6′)-Ib, aph(3′)-IIb, blaOXA-50, catB4, fosA1, sul1 | 16 | 64 |
| PSA 1506 | 549 | aph(3′)-IIb, blaOXA-50, blaPAO, catB7, fosA1, probable MexXY-OprM mutation(s)f | 16 | 0.5 |
| PSA 1505 | 274 | aph(3′)-IIb, blaOXA-50, catB7, fosA1, probable MexXY-OprM mutation(s) | 32 | 0.25 |
| PSA 1543 | 111 | aph(3′)-IIb, aac(6′)-Ib (two copies), blaOXA-50, blaOXA-9, catB4, fosA1, sul1, probable MexXY-OprM mutation(s) | 64 | 0.25 |
| PSA 1544d,e | 17 | aph(3′)-IIb, aac(6′)-Ib (two copies), aac(3′)-Ia, blaOXA-50, blaGES-5, catB7, fosA1, sul1, probable MexXY-OprM mutation(s) | 64 | 128 |
| PSA 1504d,e | 254 | aph(3′)-IIb, blaOXA-50, catB4, fosA1, probable MexXY-OprM mutation(s) | 64 | 2 |
| PSA C47#27 | 116 | aph(3′)-IIb, blaOXA-50, catB4, fosA1, probable MexXY-OprM mutation(s) | 128 | 32 |
| PSA C38#21 | 428 | aph(3′)-IIb, blaOXA-50, catB4, fosA1, probable MexXY-OprM mutation(s) | 256 | 1 |
| PSA 1547e | 167 | aph(3′)-IIb, aph(3′)-VIa, aac(6′)-Ib, aadA6, aadA1, blaOXA-2, blaOXA-50, blaIMP-15, catB7, fosA1, qnrVC1, sul1, probable MexXY-OprM mutation(s) | 2048 | >128 |
aSixteen of 17 isolates except K. pneumoniae 352 were tested in amikacin monotherapy.
bKP, K. pneumoniae; PSA, P. aeruginosa.
cMLST profiles for K. pneumoniae and P. aeruginosa are based on the database maintained by the Institut Pasteur, Paris, France and by NCBI (Bethesda, MD, USA), respectively.
dSix isolates tested in meropenem monotherapy.
eSeven isolates tested in combination therapy.
fProbable MexXY-OprM: suspected mutations in the MexXY-OprM and/or MexZ regulator.
Antibiotic test agents
Commercially available meropenem and amikacin were used in in vitro pharmacodynamic experimentation. We simulated the biologically active agent amikacin in concentrations that mimicked delivery using Amikacin Inhale solution with PDDS. Standard analytical grade meropenem (lot 122M4715V) and amikacin (lot SLBJ4676V) were purchased from Sigma-Aldrich (St Louis, MO, USA) for MIC testing.
Simulated drug exposure
The mean steady-state ELF concentrations of amikacin (400 mg every 12 h) delivered via PDDS resulting from the previously reported population pharmacokinetic model14 were simulated in the in vitro pharmacodynamic model (Table 2); this population pharmacokinetic model was developed and validated to describe the time–concentration profile of amikacin ELF concentrations after giving 400 mg every 12 h via the PDDS clinical device in intubated and mechanically ventilated patients with Gram-negative pneumonia. A virtual population of 1000 built from the study populations from the two Phase II trials10,15 included 500 female and 500 male individuals comprising 66% Caucasian, 24% Black and 10% Mexican American subjects aged 19–76 years, weighing 59–122 kg and measuring 1.5–2.0 m.14 Resulting peak and trough ELF concentrations were 5251 and 507 mg/L, respectively, and the AUC0–12 was 17 940 mg·h/L.
Amikacin target and observed exposures in ELF; data are expressed as mean ± SD
| Target | Observeda | ||
|---|---|---|---|
| inhaled amikacin monotherapy | combination of inhaled amikacin and intravenous meropenem | ||
| Peak (mg/L) | 5251 | 4668 ± 289 | 4904 ± 611 |
| Trough (mg/L) | 507 | 547 ± 118 | 480 ± 76 |
| AUC0–12 (mg·h/L) | 17 941 | 17 613 ± 868 | 17 273 ± 481 |
| Target | Observeda | ||
|---|---|---|---|
| inhaled amikacin monotherapy | combination of inhaled amikacin and intravenous meropenem | ||
| Peak (mg/L) | 5251 | 4668 ± 289 | 4904 ± 611 |
| Trough (mg/L) | 507 | 547 ± 118 | 480 ± 76 |
| AUC0–12 (mg·h/L) | 17 941 | 17 613 ± 868 | 17 273 ± 481 |
aObserved from measured concentrations during in vitro modelling experiments.
Similarly, the mean steady-state ELF concentrations of meropenem (2 g every 8 h) with a 3 h infusion were simulated as described by Lodise et al.16 utilizing the mean parameters from their population pharmacokinetic model based on the plasma and ELF concentration data from a multicentre clinical trial of meropenem in ventilator-associated pneumonia patients with target peak and trough concentrations of 10.3 and 0.8 mg/L, respectively.17 Targeted fT>MIC (percentage of the dosing interval in which free drug concentrations remain above the MIC) were 75%, 53%, 22% and 0% for MICs of 2, 4, 8 and ≥16 mg/L, respectively.
In vitro pharmacodynamic model
A one-compartment in vitro model was used for all experiments, as previously described.18 Briefly, each experiment consisted of two treatment models and one growth control model running simultaneously for each isolate. The models were placed in a 37°C water bath for optimal temperature control. Magnetic stir bars were utilized to ensure adequate mixing of the contents of each model. The starting (0 h) inoculum in each model was ∼106 cfu/mL. Inoculum was prepared by making a bacterial suspension of ∼108 cfu/mL from two subsequent subcultures of the test isolate (incubated for 16–20 h at 37°C) in 0.9% normal saline for injection. Each model was filled with CAMHB (Becton, Dickinson and Company, Sparks, MD, USA) and inoculated 30 min before starting dosing to allow bacteria to enter into log growth phase, then antibiotics were administered at simulated exposures (0 h). A peristaltic pump (Masterflex L/S Model 7524-40; Cole-Palmer Instrument Company, USA) was utilized to simulate half-life in ELF. Monotherapy and combination therapy continued over 24 and 72 h, respectively. Samples were obtained from each model at various timepoints to assess changes in bacterial density. They were serially diluted in normal saline to assess changes in bacterial density over time. Aliquots of each diluted sample were plated on trypticase soy agar plates with 5% sheep blood and incubated at 37°C for 16–20 h for quantitative culture. The area under the bacterial killing and regrowth curve (AUBC) was calculated as a measure of antibacterial activity over the 24 h for monotherapy and 72 h for combination therapy. For the seven isolates tested in combination therapy, differences in AUBC over 24 h among amikacin, meropenem and a combination of both were compared by analysis of variance (ANOVA) with the Holm–Sidak method using SigmaPlot 12.5 (Systat Software Inc., San Jose, CA, USA). A priori P < 0.05 in a two-tailed test was considered statistically significant. The lower limit of detection for bacterial density was 1.7 log10 cfu/mL.
Antibiotic concentration determination
To ensure target exposures in the model, drug concentrations were assessed. All pharmacokinetic samples were immediately frozen and stored at −80°C until analyses. The amikacin assay was performed with an Olympus AU680 Analyzer (Alternative Biomedical Solutions, Dallas, TX, USA) by Quest Diagnostics (Chantilly, VA, USA) using a commercially available Syva Emit kit (Siemens Healthcare Diagnostics, Deerfield, IL, USA). The only modification of the methodology involved dilution of samples in CAMHB (Becton, Dickinson and Company) to a detectable concentration range of 2.5–50 mg/L by the kit.
Meropenem concentrations were determined using an HPLC method by our laboratory.19,20 The meropenem assays were linear over a range of 0.25–40 mg/L (r ≥ 0.996). The respective mean inter-day coefficient of variation (%CV) for high (30 mg/L) and low (0.5 mg/L) check samples was 5.2% and 4.4%, respectively, and the corresponding mean intra-day %CVs were 1.2% and 4.4%.
Changes in MIC
During combination studies, the emergence of resistance to amikacin and meropenem was assessed at 24, 48 and 72 h by retesting the MICs of organisms exposed to the antibacterials.
Results
Genotypes and phenotypes
The results for WGS and phenotypic susceptibility testing are summarized in Table 1. Isolates with 16S rRNA methylase, such as K. pneumoniae 508 (rmtD) and 510 (armA), showed amikacin MICs of ≥16 384 mg/L. All four K. pneumoniae with amikacin MICs of 16–64 mg/L expressed the aac(6′)-Ib gene. K. pneumoniae 376, 329B and 375 were all sequence type 258 by their multilocus sequence type profile; while very similar genotypically, their amikacin MICs varied from 16 to 64 mg/L. All six K. pneumoniae with amikacin MIC ≥ 16 mg/L co-carried blaKPC or ESBL genes (blaCTX, blaSHV, blaTEM) in addition to amikacin-inactive aminoglycoside-modifying enzymes. Eight of nine P. aeruginosa with amikacin MIC ≥ 16 mg/L had suspected mutations in the MexXY-OprM and/or MexZ regulator. Of these, four isolates carried the genes aac(6′)-Ib and/or aph(3′)-VIa, encoding amikacin-active aminoglycoside-modifying enzymes. P. aeruginosa 1544 uniquely expressed weak carbapenemase blaGES-5, while blaIMP-15 was identified in P. aeruginosa 1547.
Pharmacokinetic analysis
The targeted and observed pharmacokinetic parameters for amikacin both as monotherapy and the combination therapy are summarized in Table 2 and Figure 1(a), and highlight the similarity between the targeted and observed values. Of the six isolates tested with meropenem monotherapy, isolates with blaKPC showed no (K. pneumoniae 376, 329B, 375) or lower (K. pneumoniae 508) than target meropenem concentrations after 1 h of drug exposure secondary to in vitro hydrolysis (data not shown), whereas P. aeruginosa 1504 and 1544 achieved mean peak and trough concentrations of 13.2 ± 1.1 and 0.9 ± 0.1 mg/L, respectively, similar to targets (10.3 and 0.8 mg/L). Values of fT>MIC were also close to targets for these two isolates in meropenem monotherapy (78% and 0% fT>MIC for P. aeruginosa 1504 and 1544, respectively, versus targets of 75% and 0%). During combination therapy, the meropenem concentration–time profile observed against five of the studied isolates (K. pneumoniae 376, 375 and 352, P. aeruginosa 1504 and 1544) is displayed in Figure 1(b), whereas, similarly to the data noted above, K. pneumoniae 508 (blaKPC) and P. aeruginosa 1547 (blaIMP-15) showed meropenem concentrations lower than target (data not shown). P. aeruginosa 1504 (MIC 2 mg/L) achieved meropenem fT>MIC of 98% versus the target of 75% and all other isolates achieved 0% during combination therapy.
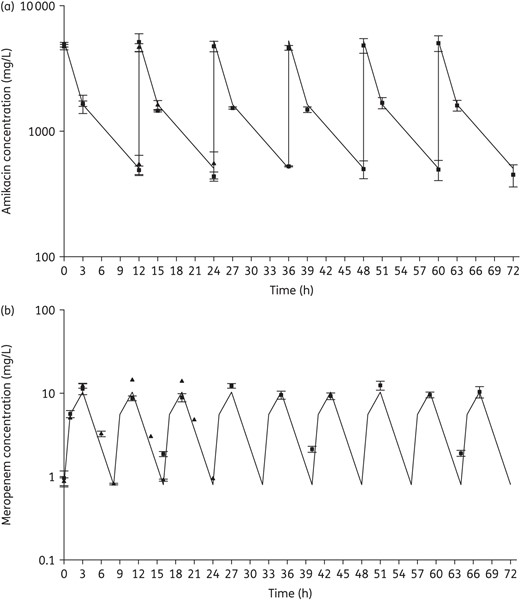
Targeted and observed concentrations of inhaled amikacin (a) and intravenous meropenem (b). Continuous lines, targeted concentrations; triangles, observed concentrations from monotherapy; squares, observed concentrations from combination therapy. Data from 16 isolates used in inhaled amikacin monotherapy and 7 isolates used in combination therapy were used (a). Due to rapid hydrolysis by KPC or IMP, only data from the following isolates were included for meropenem (b): P. aeruginosa 1504 and 1544 for monotherapy and K. pneumoniae 375, 376 and 352 and P. aeruginosa 1504 and 1544 for combination therapy.
Antibacterial results
Amikacin monotherapy was tested against 16 of the 17 included isolates, meropenem monotherapy was tested against 6, and 7 strains were tested with combination therapy (Table 1). Among the seven isolates in the combination study, two showed regrowth after exposure to amikacin monotherapy (K. pneumoniae 375, P. aeruginosa 1544), one displayed 0.5 log increase after amikacin monotherapy (P. aeruginosa 1504) and the other four were included to provide a range of phenotypic and genotypic profiles with respect to both amikacin and meropenem. The average bacterial densities of the starting inoculum were 6.5 ± 0.1 and 6.5 ± 0.1 log10 cfu/mL for K. pneumoniae and P. aeruginosa, respectively, which increased to 8.4 ± 0.2 and 7.7 ± 0.4 log10 cfu/mL in control models by the end of the experiments (24 h for monotherapy and 72 h for combination therapy). Amikacin monotherapy achieved maximal killing effect within 6–12 h and sustained bactericidal activity near the limit of detection (1.7 log10 cfu/mL) over 24 h for all 13 isolates with amikacin MIC ≤256 mg/L, except only ∼2 log10 cfu/mL reduction was observed against K. pneumoniae 375 and P. aeruginosa 1544 (Figure 2a and b). Results for the six isolates tested against meropenem monotherapy are shown in Figure 3 and highlight minimal activity secondary to high meropenem MICs except for P. aeruginosa 1504 (meropenem MIC 2 mg/L). The seven isolates tested against combination therapy are displayed in Figure 4. Compared with amikacin monotherapy, combination therapy significantly lowered the AUBC for K. pneumoniae 375 (P = 0.007) and K. pneumoniae 508 (P < 0.001). For the five isolates tested against both meropenem monotherapy and combination therapy, 24 h AUBC was significantly lower with combination therapy (Table 3). Efficacy seen at 24 h was sustained over 72 h during combination therapy (Figure 4). Importantly, the use of combination therapy enhanced bacterial killing to the limit of detection against K. pneumoniae 376 (Figure 4a), K. pneumoniae 375 (Figure 4b) and P. aeruginosa 1504 (Figure 4e), in contrast with the growth observed with amikacin or meropenem monotherapy.
Summary of activity for the seven isolates tested in inhaled amikacin and intravenous meropenem combination therapy
| Isolate numbera | AUBC over 24 hb | ||||
|---|---|---|---|---|---|
| control group | amikacin monotherapy (inhaled) | meropenem monotherapy (intravenous) | combination therapy | P | |
| KP 376 | 195.2 ± 0.3 | 46.4 ± 0.1e,g | 156.7 ± 0.1e,f | 49.0 ± 0.1f,g | <0.001c |
| KP 375 | 199.8 ± 1.3 | 62.2 ± 2.9e,g | 161.7 ± 0.7e,f | 50.9 ± 0.4f,g | <0.001c |
| KP 352 | 195.4 | NT | NT | 51.1 ± 0.3 | NT |
| KP 508 | 197.1 ± 0.9 | 190.5 ± 0.1e,g | 143.7 ± 1.1e,f | 114.7 ± 4.9f,g | <0.001c |
| PSA 1504 | 186.2 ± 1.2 | 46.4 ± 1.5e | 86.2 ± 2.4e,f | 43.1 ± 0.0f | <0.001c |
| PSA 1544 | 188.2 ± 3.0 | 85.9 ± 4.8e | 185.8 ± 1.3e,f | 74.9 ± 15.8f | 0.002c |
| PSA 1547 | 182.9 ± 0.5 | 180.5 ± 0.4 | NT | 179.5 ± 0.6 | 0.189d |
aKP, K. pneumoniae; PSA, P. aeruginosa.
bExpressed as log10 cfu·h/mL over 24 h; the value for each isolate is the mean ± SD of two independent time–kill experiments for treatment groups and two or three experiments for control groups.
cOne-way ANOVA test among three treatment groups; NT, not tested.
dt-test between combination therapy and control group; two-tailed P value.
eP < 0.05 between amikacin monotherapy and meropenem monotherapy.
fP < 0.05 between meropenem monotherapy and combination therapy.
gP < 0.05 between amikacin monotherapy and combination therapy.
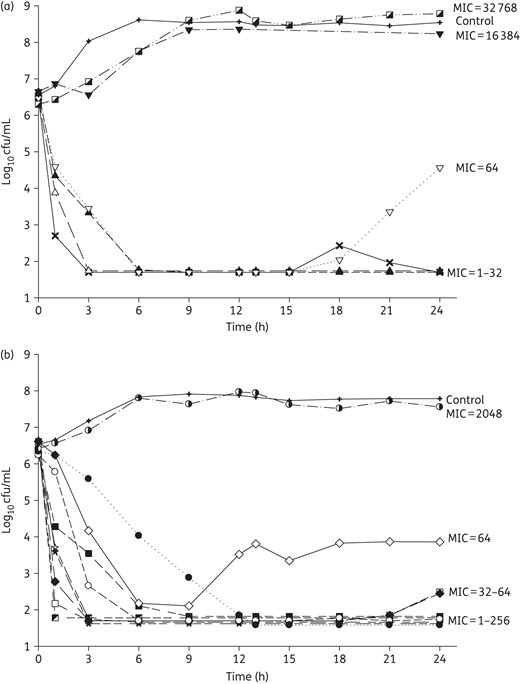
Mean bacterial density over 24 h for 6 K. pneumoniae (a) and 10 P. aeruginosa (b) tested in inhaled amikacin monotherapy. MIC values are given as mg/L.
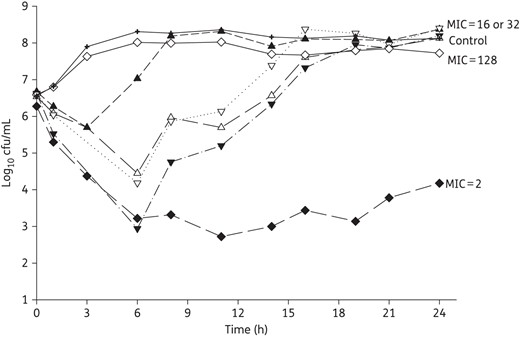
Mean bacterial density over 24 h for four K. pneumoniae and two P. aeruginosa tested in intravenous meropenem monotherapy. MIC values are given as mg/L.
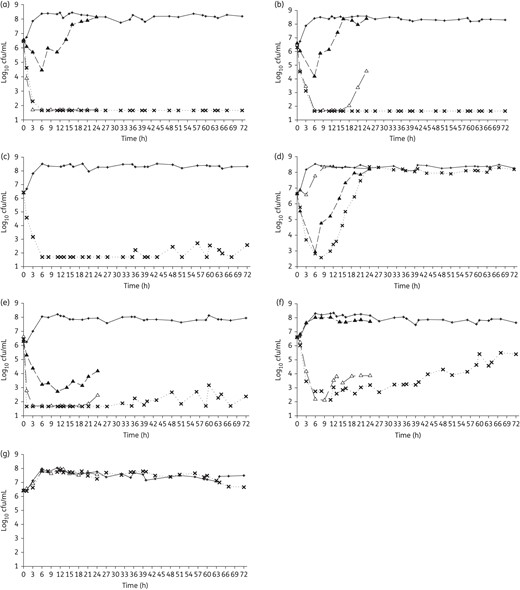
Mean bacterial density over 24 h monotherapy and/or over 72 h combination therapy against K. pneumoniae 376 (a), K. pneumoniae 375 (b), K. pneumoniae 352 (c), K. pneumoniae 508 (d), P. aeruginosa 1504 (e), P. aeruginosa 1544 (f) and P. aeruginosa 1547 (g). Open triangles, inhaled amikacin monotherapy; filled triangles, intravenous meropenem monotherapy; crosses, combination therapy; plus symbols, control groups.
Changes in MIC
When MICs were retested from the treatment models during 72 h combination therapy, amikacin MICs did not change across all experiments. For K. pneumoniae 508, the meropenem MIC was elevated from 16 to >128 mg/L at 24 h and the high MIC was sustained through the 72 h period. No changes in meropenem MIC were noted in the other isolates.
Discussion
Amikacin Inhale (BAY41-6551) is an integrated drug–device combination that utilizes amikacin specifically formulated for inhalation delivered via a proprietary gasless vibrating mesh nebulizer, the PDDS. Amikacin Inhale is currently under investigation in Phase III clinical trials as an adjunctive therapy to other intravenous antibiotics, such as meropenem, for the treatment of Gram-negative pneumonia in intubated and mechanically ventilated patients.
Secondary to the high achievable amikacin exposures in ELF, in this study, we found that human simulated ELF concentrations of inhaled amikacin delivered via the PDDS demonstrated rapid bactericidal activity as monotherapy against most tested isolates with MICs ≤256 mg/L and as an adjunct to meropenem against the isolates with amikacin/meropenem MICs ≤64/32 mg/L.
We included isolates with amikacin MICs ranging from 1 to 32 768 mg/L. While large surveillance studies examining this range in the context of the anticipated amikacin clinical MIC distribution against K. pneumoniae or P. aeruginosa are lacking, a number of smaller studies have been published. Against isolates collected from hospitalized patients with pneumonia from 62 US medical centres, Sader et al.21 reported amikacin MIC50 and MIC90 of 1 and 32 mg/L, respectively, against K. pneumoniae (n = 102). Another study, evaluating 50 carbapenem-resistant K. pneumoniae strains, reported MIC50 and MIC90 of 16 and 32 mg/L, respectively.22 In the aforementioned Sader et al.21 study, P. aeruginosa isolated in 62 US hospitals (n = 100) exhibited amikacin MIC50 and MIC90 of 4 and 8 mg/L, respectively. Similarly, amikacin MIC50 and MIC90 values of 4 and 16 mg/L, respectively, were reported against 127 clinical isolates of P. aeruginosa collected from Canadian hospitals in 2012.23 Slightly higher MICs were reported against 250 clinical isolates of P. aeruginosa collected from hospitals throughout Iran between 2007 and 2008, with MIC50 and MIC90 values of 8 and 128 mg/L, respectively.24 Although the prevalence of Enterobacteriaceae or P. aeruginosa isolates with amikacin MIC >512 mg/L would be rare worldwide,25,26 the prevalence of 16S rRNA methylase, a resistance mechanism that yielded MICs of >512 mg/L in the current study, has been reported in endemic regions of East Asia at rates of 3%–12% in South Korea,27,28 5%–7% in China,29,30 11% in India30 and 3% in Hong Kong.30 While we included three of these isolates in our model to fully evaluate the efficacy of amikacin over the entire MIC distribution, organisms with amikacin MIC >512 mg/L are extremely rare outside the endemic areas.
Along with the wide range of phenotypic profiles, we included isolates that had three pre-existing major mechanisms of resistance to amikacin: aminoglycoside-modifying enzymes, target site mutation by 16S rRNA methylases and efflux systems expressing MexXY-OprM. We observed that amikacin resistance conferred by a single amikacin-active aminoglycoside-modifying enzyme with or without MexXY-OprM mutations resulted in modest MIC elevations relative to achievable ELF exposures of inhaled amikacin delivered via the PDDS, while production of 16S rRNA methylase resulted in the highest MICs (16 384 and 32 768 mg/L). Among the many genes encoding aminoglycoside-modifying enzymes found in our isolates, aac(6′)-Ib and aph(3′)-VIa are known to encode the enzymes that confer amikacin resistance.31,32 As observed among K. pneumoniae 376, 329B and 375, the presence of aminoglycoside-modifying enzymes had varied effects on the final amikacin MIC, ranging from susceptible to resistant, an observation made by others as well.22,33 Of note, Lambert et al.34 suggested that the resistance level caused by aac(6′)-I can vary depending on the host bacterium and it seems reasonable to conclude that enzyme expression could also be playing a role. While other studies have reported resistant MIC values for organisms with aminoglycoside-modifying enzymes with or without target site mutation, ours is the first that we are aware of to quantify the specific values (i.e. MIC ≥2048 mg/L).26–29,35 The co-carriage of carbapenemases or ESBLs along with aminoglycoside-modifying enzymes or 16S rRNA methylase by the isolates included in our analysis is also consistent with previous reports.25,33
In this study, we evaluated humanized ELF exposures of inhaled amikacin via PDDS since adequate antimicrobial concentrations at the site of infection have been linked to a successful treatment of pneumonia.2 While the pharmacodynamic target required within the ELF to achieve positive outcomes is not fully understood, strong association between the ratio of the plasma peak concentration to MIC (Cmax/MIC) of 8–10 and clinical response has been reported for amikacin.36 More recently, Pajot et al.37 suggested a higher plasma free Cmax/MIC target of 15 in the treatment of ventilator-associated pneumonia caused by Gram-negative bacilli when systemic amikacin was used concomitantly with imipenem. In the light of these published targets, albeit determined based on plasma concentrations, the observed activity of amikacin monotherapy against most isolates with MIC ≤256 mg/L in our study was predictable based on the simulated Cmax ELF concentration of ∼5000 mg/L. Taken collectively, the data derived herein suggest that the current systemically drawn breakpoints may not be useful for inhaled amikacin delivered via the PDDS. In fact, there are no defined breakpoints for inhaled antibiotics to date, and the data further suggest that every nebulizer would need its own breakpoint as the different types of nebulizer yield varying ELF exposures based on differences in the delivery efficiency and particle size.
As for meropenem monotherapy, previous animal studies have reported a fT>MIC target of 40% for carbapenems against Gram-negative organisms.30–40 Consistent with these targets, we observed a sustained 2 log reduction over 24 h against P. aeruginosa 1504 (78% fT>MIC). Meropenem monotherapy showed no activity against the remaining isolates with MIC ≥16 mg/L, as predicted from 0% fT>MIC. Of note, meropenem concentrations lower than the target in the presence of blaKPC producers were presumably due to the rapid in vitro hydrolysis of meropenem, an observation we made previously.20
Importantly, targeted meropenem concentrations were sustained during combination therapy for the three blaKPC carriers (K. pneumoniae 376, 375 and 352). This observation was likely due to the rapid bactericidal activity of amikacin, leaving few or no organisms to produce carbapenemases. This hypothesis is further supported by the observation that meropenem concentrations were not sustained for K. pneumoniae 508 (blaKPC-2) or P. aeruginosa 1547 (blaIMP-15), isolates against which combination therapy failed to suppress bacterial growth.
Given the potent activity of inhaled amikacin monotherapy in the current study, we were unable to fully evaluate the synergistic killing effect of amikacin and meropenem for most strains. The exception was K. pneumoniae 375, which showed sustained killing for 72 h with combination therapy but regrowth after 24 h with amikacin monotherapy. Consistent with this observation, synergy between amikacin and carbapenems has been previously reported. A study by Le et al.41 described synergy between humanized blood concentrations of intravenous meropenem and intravenous amikacin against four clinical K. pneumoniae isolates with blaKPC-3 in a time–kill study. Moreover, a chequerboard study by Clock et al.42 reported a synergistic 4-fold decrease in amikacin MIC when combined with doripenem against 10% of the 48 KPC-producing K. pneumoniae strains tested.
Besides its observed activity against isolates currently defined as non-susceptible based on the current systemic breakpoint, we did not see the development of amikacin resistance during combination therapy studies. While we did not compare the development of resistance between aerosolized and systemic exposures, previous studies have suggested that aerosolized antibiotic therapy resulted in significantly decreased resistance compared with standard systemic antibiotics.43,44 In contrast to amikacin, the meropenem MICs for K. pneumoniae 508 increased due to both the sub-MIC concentration of meropenem45 and the lack of protection afforded by amikacin due to the extremely high MIC of this organism (i.e. amikacin MIC of 16 384 mg/L). This situation mimics the observations of the development of meropenem resistance in patients treated clinically with meropenem.46,47
While in vitro pharmacodynamic models provide valuable information in assessing the exposure–response relationship, it is important to recognize some limitations when interpreting our data. First, while we simulated the average ELF concentrations of amikacin in our in vitro system, the variability in pharmacokinetics observed in clinical practice could have affected the bactericidal activity observed herein, as would host factors such as immune function. Second, while we used an inoculum that is commonly employed for these in vitro investigations, it is possible that higher inocula may be observed in some patients with severe and invasive bronchopulmonary infections. To fully assess the antibacterial effects of these agents in the setting of a higher inoculum, additional studies will be required.
In conclusion, amikacin, at an exposure simulating the clinically observed ELF concentrations when delivered via the PDDS, achieved rapid and sustained bactericidal activity against most isolates with amikacin MICs of ≤256 mg/L. The addition of adjunctive amikacin via the PDDS to intravenous meropenem sustained these effects for 72 h with amikacin/meropenem MICs ≤64/32 mg/L, without further increases in amikacin MIC. These data are unique to Amikacin Inhale since different nebulizing therapies produce very different ELF profiles and support the development of Amikacin Inhale, an integrated drug–device combination, as an adjunctive therapy for the treatment of Gram-negative pneumonia.
Funding
This work was supported by an investigator-initiated research grant from Bayer Pharma AG (Berlin, Germany).
Transparency declarations
D. P. N. received grants from Bayer Pharma AG during the conduct of the study and grants from Bayer Pharma AG outside the submitted work. All other authors: none to declare.
Study design, data acquisition and manuscript preparation were determined and conducted independently by the investigators. The sponsor was given the opportunity to review and comment on the final publication prior to submission, but any modifications were made at the discretion of the investigators.
Acknowledgements
This work was presented at the Fifty-fifth Interscience Conference on Antimicrobial Agents and Chemotherapy, San Diego, CA, USA, 2015 (Abstracts A503 and C630).
We acknowledge Sara Robinson, Kim Greenwood and Christina Sutherland for their assistance with the conduct of the study and HPLC analysis of meropenem. We thank Dr Steven Jenkins for kindly providing K. pneumoniae 352, 375 and 376, Dr George G. Zhanel for kindly providing K. pneumoniae 510 (98 556) and P. aeruginosa 1543 (90 832), 1544 (91 152) and 1547 (96 918), Drs Yohei Doi and Doroti de Oliveira Garcia for kindly providing K. pneumoniae 508 (KP64/11) and Dr Keith Poole for kindly providing P. aeruginosa 1504 (K2158), 1505 (K2160) and 1506 (K2965). We thank Michael A. Browne and Dr Leslie E. Edinboro from Quest Diagnostics for their assay work for the determination of amikacin concentrations. We thank Drs Patrick T. McGann and Emil P. Lesho for the WGS.
