


Abstract
We utilized the database of the Defining Antibiotic Levels in Intensive care unit patients (DALI) study to statistically compare the pharmacokinetic/pharmacodynamic and clinical outcomes between prolonged-infusion and intermittent-bolus dosing of piperacillin/tazobactam and meropenem in critically ill patients using inclusion criteria similar to those used in previous prospective studies.
This was a post hoc analysis of a prospective, multicentre pharmacokinetic point-prevalence study (DALI), which recruited a large cohort of critically ill patients from 68 ICUs across 10 countries.
Of the 211 patients receiving piperacillin/tazobactam and meropenem in the DALI study, 182 met inclusion criteria. Overall, 89.0% (162/182) of patients achieved the most conservative target of 50% fT>MIC (time over which unbound or free drug concentration remains above the MIC). Decreasing creatinine clearance and the use of prolonged infusion significantly increased the PTA for most pharmacokinetic/pharmacodynamic targets. In the subgroup of patients who had respiratory infection, patients receiving β-lactams via prolonged infusion demonstrated significantly better 30 day survival when compared with intermittent-bolus patients [86.2% (25/29) versus 56.7% (17/30); P = 0.012]. Additionally, in patients with a SOFA score of ≥9, administration by prolonged infusion compared with intermittent-bolus dosing demonstrated significantly better clinical cure [73.3% (11/15) versus 35.0% (7/20); P = 0.035] and survival rates [73.3% (11/15) versus 25.0% (5/20); P = 0.025].
Analysis of this large dataset has provided additional data on the niche benefits of administration of piperacillin/tazobactam and meropenem by prolonged infusion in critically ill patients, particularly for patients with respiratory infections.
Introduction
β-Lactam antibiotics are routinely prescribed for severe infections in the ICU. As time-dependent antibiotics, the most important pharmacokinetic (PK)/pharmacodynamic (PD) index for their activity is the duration of time over which the unbound (or free) drug concentration remains above the MIC (fT>MIC).1 Intermittent-bolus (IB) dosing, the standard method of β-lactam administration, commonly produces suboptimal drug concentrations in critically ill patients with conserved renal function.2–4 Such patients generally exhibit extreme physiological derangements, which may alter the β-lactam PK and consequently reduce its exposure.5,6 Numerous PK/PD simulation studies suggest that optimal β-lactam exposures are readily obtained via continuous infusion or an extended 2–4 h infusion.2–4,7 Continuous infusion and extended infusion are jointly referred to as prolonged infusion, with either approach considered to be potentially advantageous compared with traditional IB administration.
Owing to persisting poor sepsis-related clinical outcomes in the ICU, there has been growing concern that conventional antibiotic dosing in critically ill patients is suboptimal. If this notion is true, global antibiotic prescribing practices may need to change accordingly. Aiming to improve antibiotic treatment in the ICU, the Defining Antibiotic Levels in Intensive care unit patients (DALI) study,8 a large multinational PK point-prevalence study, was undertaken to determine whether conventional dosing of β-lactam antibiotics attains drug concentrations associated with therapeutic benefits in critically ill patients. The implications of the study are profound; 16% of the patients did not achieve the most conservative PK/PD target and these patients were 32% more likely to demonstrate negative clinical outcomes. Although these data led to the conclusion that different dosing strategies are needed in the ICU, they were not discretely analysed to ascertain the potential merits of altered β-lactam infusion in critically ill patients. Of note, with the exception of piperacillin/tazobactam and meropenem, the other six β-lactam antibiotics included in the DALI study were almost exclusively administered by IB dosing, which signifies its ‘authority’ over prolonged-infusion dosing in current prescribing practices.
Despite compelling pre-clinical and PK/PD data, clinical comparative trials have failed to demonstrate the perceived clinical advantage of prolonged-infusion over IB dosing.9 Furthermore, most meta-analyses of the clinical trials are still indecisive over the notion of the clinical superiority of prolonged-infusion over IB dosing.10–18 There are currently four recent meta-analyses that report significant improvement in clinical cure10,11,13 and survival10,11,15 favouring prolonged-infusion administration. However, their findings should be interpreted with caution as these meta-analyses have included a considerable number of retrospective and non-randomized studies in their pooled analysis. Given the above uncertainty, we utilized the database of the DALI study with the primary aim of distinguishing the relative abilities of prolonged-infusion and IB dosing of piperacillin/tazobactam and meropenem to achieve specific PK/PD exposure targets in relation to the offending pathogen MIC during antibiotic therapy. Secondary aims were to describe clinical response and 30 day survival for both administration approaches and which patient subgroups were most likely to benefit from this intervention.
Methods
Study design
This is a post hoc analysis of the DALI study, for which the detailed study protocol has been described elsewhere.8,19 Briefly, during a single dosing interval on the investigation day, each patient had two blood samples drawn for the β-lactams they were receiving (mid-dose and a trough concentration). Various demographic, clinical and treatment-related variables were collected on the day of investigation. CLCR was estimated using the Cockcroft–Gault formula.20
Patients were included if they received either piperacillin/tazobactam or meropenem, which were administered by prolonged infusion (either continuous or extended infusion) or IB dosing. We followed the inclusion criteria used in previous randomized clinical trials of this intervention,21–23 which meant that patients who received any form of extracorporeal renal support were excluded as patients with reduced drug clearances are less likely to benefit from altered administration approaches.24–26 For clinical outcome assessment, only patients who received antibiotic for treatment of infection, as opposed to prophylaxis, were included.
The lead site was The University of Queensland, Australia (ethics approval number 201100283). Informed consent was obtained from each eligible patient.
Sample integrity and bioanalysis
Blood samples were processed and stored per protocol prior to shipment to the Burns, Trauma and Critical Care Research Centre, The University of Queensland, Australia, where they were assayed. The details concerning bioanalysis have been described in detail elsewhere.27
PK/PD and clinical outcome measures
The primary endpoint, which was PK/PD target attainment, is described in detail in Table 1. Briefly, to assess the relative dosing adequacy of prolonged-infusion and IB administration, the observed unbound antibiotic concentrations were compared against the causative pathogens actual or ‘surrogate’ MIC.
Definitions used for PK/PD endpoints and clinical outcome variables
| Primary PK/PD endpointsa,b | Definition |
|---|---|
| 50% fT>MIC | free drug concentration maintained above the MIC for the pathogen for at least 50% of the dosing interval |
| 50% fT>4×MIC | free drug concentration maintained >4× the MIC for the pathogen for at least 50% of the dosing interval |
| 100% fT>MIC | free drug concentration maintained above the MIC for the pathogen throughout the dosing interval |
| 100% fT>4×MIC | free drug concentration maintained >4× the MIC for the pathogen throughout the dosing interval |
| Secondary endpoints | Definition and description |
| Clinical response | |
| clinical cure | completion of treatment course without change or addition of antibiotic therapy, and with no additional antibiotics commenced within 48 h of cessation |
| clinical failure | any clinical outcome other than clinical cure |
| 30 day survival | survival at day 30 following entry to the study |
aThe PK/PD exposure targets have all been identified in clinical studies recruiting critically ill patients in which achieving these targets would increase the probability of clinical efficacy.
bActual MIC values, provided by the local microbiology laboratory, were used when available. Where a pathogen was isolated, but the MIC was unavailable, the ‘surrogate’ MIC was defined by EUCAST MIC90 data. Where no pathogen was formally identified, the MIC breakpoints for Pseudomonas aeruginosa (16 mg/L for piperacillin/tazobactam and 2 mg/L for meropenem) were inferred as the surrogate MIC, which reflects the least susceptible pathogen that could be encountered during β-lactam therapy.
The secondary endpoints, clinical response and 30 day survival, were assessed using definitions described in Table 1. Additionally, to investigate clinical differences between prolonged-infusion and IB dosing within the subgroup of patients with the highest illness severity, as described by Lodise et al.,28 we performed a classification and regression tree (CART) analysis to further stratify patients based on SOFA score to identify the patients who were at the greatest risk of clinical failure and 30 day mortality.
Statistical analysis
Data are presented as median values with IQR for continuous variables and number and percentage for categorical variables. A multivariate logistic regression model (manual entry and stepwise, backward elimination) was constructed to identify significant predictors associated with the primary and secondary endpoints, with OR and 95% CI reported. Biologically plausible variables with a P value of ≤0.15 on univariate analysis were considered for model building. However, the administered β-lactam and the method of administration were forced into the regression models regardless of the univariate analysis results. Goodness of fit was assessed using the Hosmer–Lemeshow statistic. A two-sided P value of <0.05 was considered statistically significant in all analyses. Statistical analysis was performed using IBM SPSS Statistics v22 (IBM Corporation, Armonk, NY, USA).
Results
A total of 211 patients received either piperacillin/tazobactam or meropenem and were considered for study inclusion. Twenty-nine patients were excluded as they received extracorporeal renal support during ICU stay. The patient inclusion and exclusion process is depicted in Figure 1 and the baseline characteristics of the 182 included patients are presented in Table 2. For clinical outcome assessment, 37 patients who were only receiving antibiotic prophylaxis were further excluded.
Baseline demographics and characteristics
| Characteristic | All patients (n = 182) | Prolonged infusion (n = 67) | IB (n = 115) | P valuea,b |
|---|---|---|---|---|
| Age (years), median (IQR) | 61 (47–74) | 56 (47–75) | 64 (48–74) | 0.417 |
| Male, n (%) | 113 (62.1) | 44 (65.7) | 69 (60.0) | 0.447 |
| Weight (kg), median (IQR) | 73 (65–84) | 73 (64–88) | 74 (65–80) | 0.646 |
| APACHE II, median (IQR) | 18 (13–25) | 20 (13–26) | 18 (14–24) | 0.215 |
| SOFA, median (IQR) | 5 (3–8) | 5 (3–8) | 5 (3–8) | 0.797 |
| Serum creatinine concentration (μmol/L), median (IQR) | 71 (52–125) | 64 (48–140) | 73 (53–119) | 0.726 |
| Cockroft–Gault CLCR (mL/min), median (IQR) | 85 (46–131) | 95 (42–141) | 82 (48–130) | 0.510 |
| Pre-ICU hospital stay (days), median (IQR) | 2 (1–9) | 1 (1–9) | 2 (1–9) | 0.260 |
| Duration of antibiotic therapy (days), median (IQR) | 9 (4–14) | 8 (4–13) | 9 (4–14) | 0.371 |
| Concomitant antibiotic usage, n (%) | 110 (60.4) | 39 (58.2) | 71 (61.7) | 0.733 |
| Surgery within 24 h of antibiotic sampling, n (%) | 33 (18.1) | 14 (20.9) | 19 (16.5) | 0.460 |
| Organisms identified, n (%) | 121 (66.5) | 50 (74.6) | 71 (61.7) | 0.103 |
| Polymicrobial infection, n (%) | 29 (15.9) | 11 (16.4) | 18 (15.7) | 0.577 |
| Primary infection site, n (%) | ||||
| respiratory | 70 (38.5) | 33 (49.3) | 37 (32.2) | 0.041 |
| abdominal | 50 (27.5) | 16 (23.9) | 34 (29.6) | 0.593 |
| blood | 23 (12.6) | 6 (9.0) | 17 (14.8) | 0.664 |
| urinary | 21 (11.5) | 6 (9.0) | 15 (13.0) | 0.231 |
| CNS | 8 (4.4) | 4 (6.0) | 4 (3.5) | 0.639 |
| others | 10 (5.5) | 2 (3.0) | 8 (7.0) | 0.082 |
aRepresents the P value between prolonged-infusion versus IB dosing and the value in bold indicates a significant difference between the two dosing groups (P < 0.05).
bLinear variables were compared using the Mann–Whitney U-test as data were non-normally distributed as indicated by the Kolmogorov–Smirnov test. Dichotomous variables were compared using the Pearson χ2 test or Fisher's exact test as appropriate.
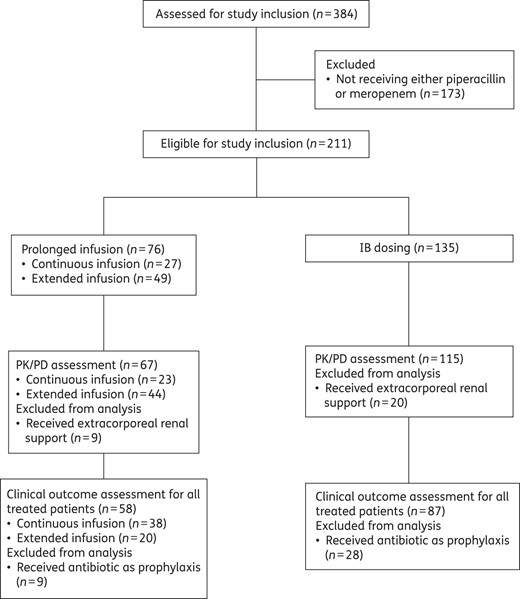
Study flow chart demonstrating the number of patients who were included and excluded in each stage of the planned analysis.
Of the 182 included patients, 110 (60.4%) received piperacillin/tazobactam. Additionally, 60.4% (110/182) of patients also received concomitant antibiotic therapy as part of their treatment. The most common administration method was IB; 63.2% (115/182) of the patients received β-lactams via this approach. Among the 67 prolonged-infusion patients, 23 (34.3%) and 44 (65.7%) were continuous-infusion and extended-infusion patients, respectively. Figure 2 illustrates the preferred method of dosing by participating country. Although most countries favoured IB dosing, two countries, Belgium and France, had more than half of the patients receiving the β-lactams by prolonged-infusion dosing.
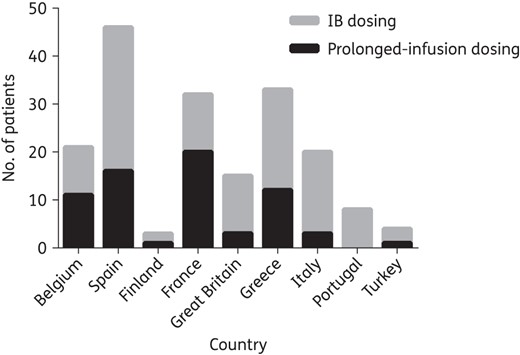
Method of piperacillin/tazobactam and meropenem administration according to participating countries.
Of 182 patients who received β-lactams, 70 (38.5%) were prescribed them for either presumed or confirmed respiratory infection. Of the patients treated for infection (n = 145), 114 (78.6%) had at least one causative pathogen isolated and 40.4% (46/114) of them had actual MIC values for the causative pathogens identified. The numbers of patients with actual MIC data were similar between prolonged-infusion and IB treatment arms [37.5% (18/48) and 42.4% (28/66), respectively; P = 0.769]. The distribution of the isolated pathogens was similar between the treatment arms and most of the isolates were Gram-negative bacteria [prolonged infusion 79.2% (38/48), IB 80.3% (53/66); P = 0.881]. Of the 114 isolated pathogens, the most prevalent Gram-negative and -positive pathogens were Pseudomonas aeruginosa (24/91; 26.4%) and Staphylococcus aureus (6/23; 26.1%), respectively.
PK/PD and clinical outcome measures
Overall, 89.0% (162/182) of patients achieved the lower PK/PD target of 50% fT>MIC. For the higher thresholds of 100% fT>MIC and 100% fT>4×MIC, 63.2% (115/182) and 27.5% (50/182) of patients, respectively, achieved these PK/PD targets. Although prolonged-infusion patients generally demonstrated numerically higher target attainment rates compared with IB patients across all PK/PD indices, a statistically significant difference was only observed at 100% fT>MIC: 50% fT>MIC [prolonged infusion 91.0% (61/67) versus IB 87.8% (101/115); P = 0.532]; 50% fT>4×MIC [prolonged infusion 62.7% (42/67) versus IB 49.6% (57/115); P = 0.106]; 100% fT>MIC [prolonged infusion 73.1% (49/67) versus IB 57.4% (66/115); P = 0.045]; and 100% fT>4×MIC [prolonged infusion 31.3% (21/67) versus IB 25.2% (29/115); P = 0.357]. When only patients with actual MIC data were analysed, those who received β-lactams via prolonged-infusion dosing also demonstrated numerically higher target attainment rates, albeit not statistically significantly higher, compared with IB patients across all PK/PD indices.
The clinical cure and 30 day survival rate of patients who received antibiotics for treatment of infection (n = 145) was 73.1% (106/145) and 73.1% (106/145), respectively. Table 3 presents the differences in patient characteristics between those who demonstrated positive and negative clinical outcomes in this study. The clinical outcomes were mostly similar between prolonged-infusion and IB patients receiving antibiotics for treatment of infection (Figures 3 and 4). However, in the subgroup of patients who had respiratory infection (n = 59), patients receiving β-lactams via prolonged-infusion dosing demonstrated significantly better 30 day survival when compared with IB patients [86.2% (25/29) and 56.7% (17/30), respectively; P = 0.012].
Differences in patient characteristics and treatment-related variables between those who demonstrated positive and negative clinical outcome
| Variable | Clinical cure | Significance P valuea,b | 30 day survival | P valuea,b | ||
|---|---|---|---|---|---|---|
| yes (n = 106) | no (n = 39) | alive (n = 106) | deceased (n = 39) | |||
| Age (years), median (IQR) | 65 (50–75) | 64 (51–79) | 0.297 | 59 (47–74) | 65 (56–77) | 0.048c |
| Male, n (%) | 67 (63.2) | 24 (61.5) | 0.929 | 66 (62.3) | 25 (64.1) | 0.890 |
| Weight (kg), median (IQR) | 73 (63–86) | 75 (65–81) | 0.927 | 75 (65–88) | 71 (60–76) | 0.074c |
| APACHE II score, median (IQR) | 19 (15–25) | 18 (15–24) | 0.643 | 18 (14–25) | 21 (16–24) | 0.499 |
| SOFA score, median (IQR) | 5 (2–7) | 7 (4–9) | 0.029c | 4 (2–7) | 7 (4–10) | 0.001c |
| Serum creatinine (μmol/L), median (IQR) | 65 (51–144) | 87 (53–130) | 0.457 | 64 (48–130) | 92 (64–143) | 0.101 |
| Cockcroft–Gault CLCR (mL/min), median (IQR) | 86 (41–130) | 78 (39–131) | 0.445 | 93 (45–147) | 59 (36–93) | 0.014c |
| Duration of treatment (days), median (IQR) | 9 (5–13) | 7 (4–10) | 0.030c | 10 (5–14) | 8 (4–12) | 0.217 |
| Pre-ICU hospital stay (days), median (IQR) | 2 (1–8) | 6 (2–12) | 0.005c | 2 (1–9) | 3 (1–12) | 0.046c |
| Surgery within 24 h, n (%) | 12 (11.3) | 6 (15.4) | 0.420 | 14 (13.2) | 4 (10.3) | 1.000 |
| Culture positive, n (%) | 83 (78.3) | 31 (79.5) | 0.759 | 85 (80.2) | 29 (74.4) | 0.387 |
| Gram-negative pathogen, n (%) | 61 (73.5) | 30 (96.8) | 0.036c | 64 (75.3) | 27 (93.1) | 0.039c |
| Polymicrobial infection, n (%) | 16 (19.3) | 7 (22.6) | 0.536 | 20 (23.5) | 7 (24.1) | 0.824 |
| Primary infection site, n (%) | ||||||
| respiratory | 40 (37.7) | 19 (48.7) | 0.303 | 42 (39.6) | 17 (43.6) | 0.591 |
| abdominal | 30 (28.3) | 12 (30.8) | 0.695 | 31 (29.2) | 11 (28.2) | 0.639 |
| blood | 14 (13.2) | 5 (12.8) | 1.000 | 13 (12.3) | 6 (15.4) | 0.542 |
| urinary | 14 (13.2) | 0 (0.0) | 0.035 | 11 (10.4) | 3 (7.7) | 0.515 |
| CNS | 4 (3.8) | 1 (2.6) | 1.000 | 4 (3.8) | 1 (2.6) | 1.000 |
| others | 4 (3.8) | 2 (5.1) | 1.000 | 5 (4.7) | 1 (2.6) | 1.000 |
| β-Lactam antibiotics, n (%) | ||||||
| piperacillin | 60 (56.6) | 26 (66.7) | 0.295c | 62 (58.5) | 24 (61.5) | 0.787 |
| meropenem | 46 (43.4) | 13 (33.3) | 44 (41.5) | 15 (38.5) | ||
| Concomitant antibiotics, n (%) | 58 (54.7) | 32 (82.1) | 0.020c | 60 (56.6) | 30 (76.9) | 0.023c |
| Dosing method, n (%) | ||||||
| prolonged infusion | 44 (41.5) | 14 (35.9) | 0.641c | 47 (44.3) | 12 (30.8) | 0.156c |
| IB | 62 (58.5) | 25 (64.1) | 59 (55.7) | 27 (69.2) | ||
| PK/PD ratiod, median (IQR) | ||||||
| 50% fT>MIC | 7.1 (2.2–13.0) | 3.5 (2.1–10.0) | 0.097c | 5.3 (1.9–11.7) | 8.1 (2.9–15.0) | 0.383 |
| 100% fT>MIC | 2.2 (0.6–7.1) | 1.7 (0.5–3.1) | 0.280 | 1.7 (0.5–5.3) | 3.2 (1.1–7.2) | 0.060c |
aLinear variables were compared using the Mann–Whitney U-test as data were non-normally distributed as indicated by the Kolmogorov–Smirnov test. Dichotomous variables were compared using the Pearson χ2 test or Fisher's exact test as appropriate.
bBold values indicate statistical significance (P < 0.05).
cRepresents variable that was included in the multivariate logistic regression model.
dPK/PD ratios observed at 50% and 100% of the dosing interval. These indices were defined as the ratio between the unbound plasma concentration (piperacillin/tazobactam or meropenem) at 50% or 100% of the dosing interval and the causative pathogen MIC. Actual MIC values were used when available. Where the MIC was unavailable or no pathogen was formally identified, surrogate MIC values were assumed.
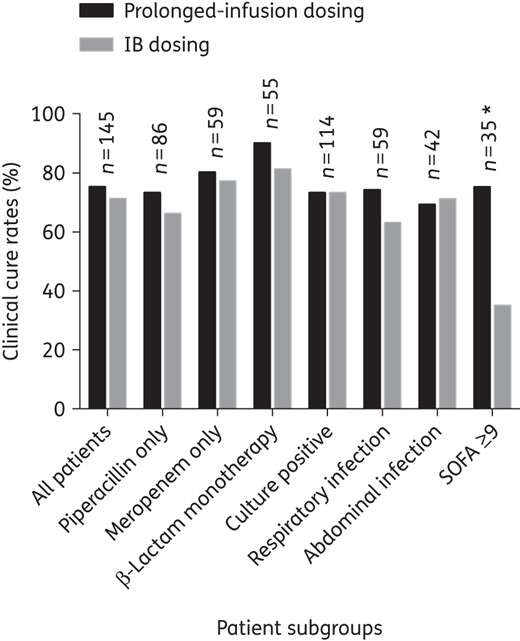
Clinical cure rate comparison between prolonged-infusion and IB dosing for patients who received antibiotics for treatment of infections, stratified according to subgroups. An asterisk indicates a significant difference between prolonged-infusion and IB dosing (P < 0.05). n, number of patients in the subgroup.
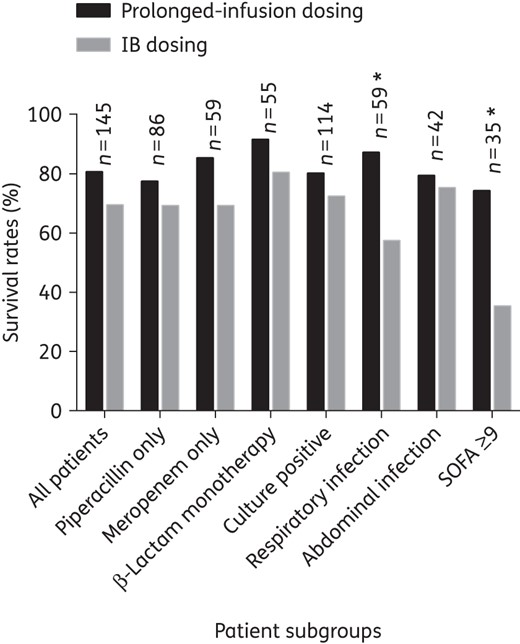
Comparison of 30 day survival between prolonged-infusion and IB dosing for patients who received antibiotics for treatment of infections, stratified according to subgroups. An asterisk indicates a significant difference between prolonged-infusion and IB dosing (P < 0.05). n, number of patients in the subgroup.
Patients who had a SOFA score ≥9 were identified by CART analysis to have the greatest risk of clinical failure [clinical cure rates were 80.0% (88/110) in patients with a SOFA score <9 versus 51.4% (18/35) in patients with a SOFA score ≥9; P = 0.004] and 30 day mortality [mortality rates were 18.2% (20/110) in patients with a SOFA score <9 versus 54.3% (19/35) in patients with a SOFA score ≥9; P = 0.001]. In patients with a SOFA score ≥9 (n = 35), those receiving β-lactams via prolonged-infusion dosing demonstrated significantly higher clinical cure [prolonged infusion 73.3% (11/15) versus IB 35.0% (7/20); P = 0.035] and 30 day survival rates [prolonged infusion 73.3% (11/15) versus IB 25.0% (5/20); P = 0.025].
Outcome measure predictors
Based on the most parsimonious model, decreasing CLCR values significantly increased the PTA for all PK/PD targets: 50% fT>MIC, OR 0.97, 95% CI 0.98–0.99, P = 0.007; 50% fT>4×MIC, OR 0.97, 95% CI 0.98–0.99, P = 0.014; 100% fT>MIC, OR 0.97, 95% CI 0.98–0.99, P < 0.001; and 100% fT>4×MIC, OR 0.97, 95% CI 0.96–0.98, P < 0.001. The use of prolonged-infusion dosing, as opposed to IB dosing, significantly increased the PTA for 100% fT>MIC (OR 2.78, 95% CI 1.24–6.24, P = 0.013).
The results of all multivariate logistic regression models for clinical cure and 30 day survival are available in Table 4. Based on the most parsimonious logistic regression model, SOFA score (OR 0.89, 95% CI 0.80–0.99, P = 0.029) and concomitant antibiotic use (OR 0.31, 95% CI 0.10–0.96, P = 0.043) were identified as significant factors associated with clinical cure whilst only SOFA score (OR 0.82, 95% CI 0.73–0.92, P = 0.001) was identified as a factor associated with 30 day survival.
Factors predicting clinical cure and 30 day survival for all patients who received antibiotics for treatment of infections (n = 145)
| Variable | All factors included in the model | Final model | ||
|---|---|---|---|---|
| OR (95% CI) | P value | OR (95% CI) | P value | |
| Factors predicting clinical cure | ||||
| SOFA score (per 1 point increase) | 0.90 (0.80–1.01) | 0.071 | 0.89 (0.80–0.99) | 0.029 |
| concomitant antibiotic therapya | 0.24 (0.07–0.84) | 0.025 | 0.31 (0.10–0.96) | 0.043 |
| duration of antibiotic therapy (per 1 day increase) | 1.08 (0.98–1.18) | 0.115 | — | — |
| Gram-negative pathogenb | 0.35 (0.06–1.87) | 0.218 | — | — |
| 50% fT>MICc (per 1 point increase) | 1.02 (0.97–1.08) | 0.405 | — | — |
| piperacillind | 0.84 (0.28–2.46) | 0.746 | — | — |
| prolonged infusione | 0.86 (0.31–2.43) | 0.782 | — | — |
| pre-ICU hospital stay (per 1 day increase) | 1.00 (0.97–1.03) | 0.966 | — | — |
| Goodness of fit | ||||
| Hosmer–Lemeshow test | χ2 = 6.00, df = 8 | 0.647 | χ2 = 8.41, df = 8 | 0.394 |
| Factors predicting 30 day survival | ||||
| SOFA score (per 1 point increase) | 0.83 (0.73–0.96) | 0.009 | 0.82 (0.73–0.92) | 0.001 |
| concomitant antibiotic therapya | 0.24 (0.05–1.04) | 0.056 | — | — |
| piperacillind | 2.70 (0.86–8.49) | 0.090 | — | — |
| age (per 1 year increase) | 0.96 (0.92–1.01) | 0.099 | — | — |
| weight (per 1 kg increase) | 1.03 (0.99–1.07) | 0.119 | — | — |
| Gram-negative pathogenb | 0.32 (0.05–2.05) | 0.228 | — | — |
| pre-ICU hospital stay (per 1 day increase) | 0.98 (0.95–1.01) | 0.232 | — | — |
| estimated Cockcroft–Gault CLCR (per mL/min) | 1.00 (0.99–1.01) | 0.675 | — | — |
| prolonged infusione | 1.10 (0.33–3.67) | 0.878 | — | — |
| 100% fT>MICf (per 1 point increase) | 1.00 (0.92–1.08) | 0.960 | — | — |
| Goodness of fit | ||||
| Hosmer–Lemeshow test | χ2 = 6.57, df = 8 | 0.584 | χ2 = 5.05, df = 8 | 0.751 |
df, degrees of freedom.
When available, actual MIC values were used.
Dashes indicate there was no variable output in the model.
aOR ratio compares concomitant antibiotic therapy relative to antibiotic monotherapy.
bOR compares Gram-negative relative to Gram-positive pathogens.
cRatio between unbound plasma concentration (either piperacillin or meropenem) at 50% of the dosing interval and the causative pathogen MIC (actual or assumed values).
dOR compares piperacillin relative to meropenem.
eOR compares prolonged-infusion relative to IB dosing.
fRatio between unbound plasma concentration (either piperacillin or meropenem) at 100% of the dosing interval and the causative pathogen MIC (actual or assumed values).
Discussion
Altered β-lactam PK is widely reported among ICU patients, potentially leading to suboptimal antibiotic exposures when ‘standard’ β-lactam dosing is applied in the cohort.5,6,29 In this study, the majority of patients achieved a lower PK/PD target of 50% fT>MIC and the attainment rates were similarly high across the two administration methods and antibiotics. However, clinical data from critically ill patients have suggested that such exposure should be regarded as the minimum, with larger exposures associated with improved outcomes.30–33 A more prudent target of 100% fT>MIC should be considered and this was not achieved by one-third of the study patients. Nonetheless, the patients in this cohort were 3-fold more likely to achieve 100% fT>MIC when receiving β-lactams via prolonged-infusion dosing (OR 2.78, 95% CI 1.24–6.24, P = 0.013). Although such an observation was anticipated, our current work remains unique given that the data were derived from a broad range of ICU environments across 10 countries and the strength of association was established and supported by multivariate regression analyses.
As the β-lactams are predominantly cleared by the kidney, elevated renal function as observed in augmented renal clearance (ARC) may likely lead to suboptimal PK/PD target attainment.34–36 In our cohort, increasing values of the estimated CLCR significantly reduced the PTA for all PK/PD indices. Moreover, the observed relationship between CLCR and suboptimal PK/PD exposure was relatively strong in both univariate and multivariate analysis for all PK/PD indices. The probability of attaining 100% fT>MIC would be reduced by 3% with every 1 mL/min increase in the estimated CLCR (OR 0.97, 95% CI 0.98–0.99, P < 0.001). The median CLCR of patients who did not attain 100% fT>MIC was 132 mL/min and only 28.2% (11/39) of those with a CLCR ≥132 mL/min achieved the target. Such patients, who are at risk and usually have apparently ‘normal’ renal function, need to be identified early so that appropriate dose modification can occur. Young trauma patients (<60 years), without significant organ dysfunction (SOFA ≤4),37,38 were more likely to develop ARC and these factors were also evident in our patients who manifested elevated CLCR; median age was 45 (IQR 35–57) and median SOFA was 4 (IQR 2–7).
The significance of illness severity for clinical outcome is also highlighted in this study. In this context, higher SOFA scores were independently associated with greater likelihood of developing clinical failure and death at 30 days after antibiotic sampling. An increase in SOFA score by 1 point reduced the probability of clinical cure and survival by 11.0% and 18.0%, respectively (Table 4). Accordingly, we also observed that patients with a SOFA score ≥9 were more likely to demonstrate negative clinical outcomes and, when only these patients were tested, those receiving β-lactams via prolonged-infusion dosing demonstrated significantly better outcomes compared with IB dosing (Figures 3 and 4). Higher survival rates favouring prolonged-infusion dosing were also seen in the subgroup of patients with respiratory infection, and our findings further substantiate similar claims of earlier studies that suggested potential benefits of prolonged-infusion administration in severely ill patients with pneumonia.39–41 As inappropriate antibiotic treatment has been associated with reduced survival in patients with severe pneumonia,31,32,42,43 prompt antibiotic administration, with an optimal dosing schedule, is therefore an essential intervention in this population. In this respect, the application of prolonged-infusion dosing could have the merit of enhancing β-lactam penetration into the interstitial fluid of the infected lung tissues,26,44,45 where the antibiotic–bacteria interactions occur.46 Furthermore, optimal antibiotic dosing is crucial in this population as it may be directly linked with patient outcomes,47,48 whilst for other infection sites, such as intra-abdominal and surgical-site infections, effective source control and the role of the surgeon are probably more crucial in predicting positive outcomes.
However, it is also important to mention that the sample size of patients in these two subgroups was relatively small compared with the number of clinically evaluable patients (<60 versus 145, respectively) and thus the observed statistical significance could have been the result of random chance, although the findings do agree with previous published data.28 Furthermore, due to the relatively small number of patients in the two subgroups, logistic regression analyses could not be performed and therefore the conclusion that prolonged infusion provided clinical benefits was based on unadjusted analyses, which do not consider the influence of potential confounders. Hence, it is important to highlight that the median pre-ICU days for prolonged-infusion patients in the two subgroups were significantly shorter compared with IB patients (prolonged infusion 2 days, IQR 1–8; IB 7 days, IQR 2–12; P = 0.039), and the large difference might skew the results in favour of prolonged infusion. Indeed, our clinical findings provide further evidence that prolonged-infusion dosing of β-lactam antibiotics may not be beneficial for all but rather for a specific subset of critically ill patients with severe infections. Interestingly, no subgroup had worse outcomes with prolonged-infusion dosing, suggesting that widespread use of such an intervention is not likely to have an inferior effect compared with the current standard practice. We believe that this study generates an interesting ‘therapeutic’ signal, signifying potential clinical superiority of prolonged-infusion dosing in patients with higher SOFA scores and in patients with respiratory infections. Accordingly, future clinical studies should focus on and test the hypotheses of prolonged-infusion dosing benefits specifically in these patient groups. As has been demonstrated by a recent randomized controlled trial, Dulhunty et al.21 showed that continuous infusion demonstrated better PK/PD and clinical outcomes when compared with IB dosing, and these findings may stem from the strategic approach of only recruiting patients with a higher acuity of illness and in patients not receiving renal replacement therapy.
In this study, concomitant antibiotic therapy reduced the probability of clinical cure by 69.0% (Table 4). Although the reasons were unclear, we hypothesize that the more severely ill the patient was, the more likely it was that the patient received multiple antibiotics in an attempt to ‘reverse’ the impending poor prognosis associated with such patients. Our notion was corroborated by the higher median SOFA score observed in patients who received concomitant antibiotics compared with those who did not (SOFA 6, IQR 3–9, and SOFA 4, IQR 1–7, respectively; P = 0.048). Whilst data on concomitant antibiotics were available, we did not specifically evaluate the duration of therapy with these antibiotics and assess their PK/PD, all of which could have confounded the findings in this study.
This study has several limitations that we would like to declare. It is imperative to clarify that in 60% of the patients ‘surrogate’ MIC values were assumed from population estimates, and such an approach could markedly inflate, or even deflate, the magnitudes of PK/PD target non-attainment observed in this study. In addition, this approach would adversely affect the target attainment rates of IB patients more than those for the prolonged-infusion patients if the surrogate MIC values were indeed higher than the actual MIC values. However, when we employed actual MIC data in our analysis, the findings were consistent with our main approach, where prolonged-infusion patients demonstrated numerically higher target attainment rates, albeit not statistically significantly higher, compared with IB patients across all PK/PD indices. Actual MIC values would have been preferable, although we believe that our present approach closely mimics the real-life clinical approach, in which the MIC for a pathogen is rarely available upon antibiotic treatment initiation. We also acknowledge the limitation of the Cockcroft–Gault formula in estimating the measures of renal function in this cohort, and that measured CLCR would be more appropriate, particularly in patients with ARC. The post hoc nature of this analysis also limits our ability to establish a causal relationship between the methods of β-lactam administration and clinical outcomes. As the antibiotic dosing regimen and all subsequent patient management were at the discretion of the treating physician, this might have introduced potential bias towards better patient management among prolonged-infusion patients in this study.
Conclusions
This study provides additional PK/PD and clinical outcome data to support the practice of administration of piperacillin/tazobactam and meropenem by prolonged infusion in critically ill patients, particularly for patients with respiratory infections. However, future clinical studies should focus on and test the potential clinical superiority of altered β-lactam dosing approaches in a specific subset of critically ill patients with severe infections who are not receiving renal replacement therapy.
Funding
This project has received funding from the European Society of Intensive Care Medicine's European Critical Care Research Network (ESICM ECCRN) and the Royal Brisbane and Women's Hospital Research Foundation. Neither organization had a role in study design, analysis or drafting of the manuscript. J. A. R. is funded by a Career Development Fellowship from the National Health and Medical Research Council of Australia (APP1048652).
Transparency declarations
None to declare.
Author contributions
M. H. A.-A. drafted the manuscript, had full access to the data and took responsibility for the integrity of the data and the accuracy of the data analysis. J. A. R. and J. L. designed the study and wrote the initial protocol. S. C. W. performed the sample bioanalysis. M. H. A.-A. and J. D. performed the statistical analysis. J. L., M. A., M. B., J. J. D. W., G. D., K.-M. K., D. K., C. M., P. M., J. R., A. R., T. S. and J. A. R. helped conduct the trial. All authors provided input into the interpretation of the data and critical revision of the manuscript for important intellectual content.
Acknowledgements
Members of the DALI Study Group
Jason A. Roberts, Burns Trauma and Critical Care Research Centre, The University of Queensland, Brisbane, Australia; Royal Brisbane and Women's Hospital, Brisbane, Australia.
Jeffrey Lipman, Burns Trauma and Critical Care Research Centre, The University of Queensland, Brisbane, Australia; Royal Brisbane and Women's Hospital, Brisbane, Australia.
Therese Starr, Royal Brisbane and Women's Hospital, Brisbane, Australia.
Steven C. Wallis, Burns Trauma and Critical Care Research Centre, The University of Queensland, Brisbane, Australia.
Sanjoy Paul, Queensland Clinical Trials & Biostatistics Centre, School of Population Health, The University of Queensland, Brisbane, Australia.
Antonio Margarit Ribas, Hospital Nostra Senyora de Meritxell, Escaldes-Engordany, Andorra.
Jan J. De Waele, Ghent University Hospital, Ghent, Belgium.
Luc De Crop, Ghent University Hospital, Ghent, Belgium.
Herbert Spapen, Universitair Ziekenhuis Brussels, Brussels, Belgium.
Joost Wauters, Universitair Ziekenhuis Gasthuisberg, Leuven, Brussels.
Thierry Dugernier, Clinique Saint Pierre, Ottignies, Belgium.
Philippe Jorens, Universitair Ziekenhuis Antwerpen, Edegem, Belgium.
Ilse Dapper, Algemeen Ziekenhuis Monica, Deurne, Belgium.
Daniel De Backer, Erasme University Hospital, Brussels, Belgium.
Fabio S. Taccone, Erasme University Hospital, Brussels, Belgium.
Jordi Rello, Vall d'Hebron Institut of Research, Universitat Autonoma de Barcelona, Spain Centro de Investigación; Biomedica En Red- Enfermedades Respiratorias (CibeRes).
Laura Ruano, Vall d'Hebron Institut of Research. Universitat Autonoma de Barcelona, Spain Centro de Investigación; Biomedica En Red- Enfermedades Respiratorias (CibeRes).
Elsa Afonso, Hospital Universitari Vall d'Hebron Vall d'Hebron Institut of Research, Universitat Autonoma de Barcelona, Spain Centro de Investigación Biomedica En Red- Enfermedades Respiratorias (CibeRes).
Francisco Alvarez-Lerma, Hospital Del Mar, Parc Salut Mar, Barcelona, Spain.
Maria Pilar Gracia-Arnillas, Hospital Del Mar, Parc Salut Mar, Barcelona, Spain.
Francisco Fernández, Centro Médico Delfos, Barcelona, Spain.
Neus Feijoo, Hospital General de L'Hospitalet, Barcelona, Spain.
Neus Bardolet, Hospital General de L'Hospitalet, Barcelona, Spain.
Assumpta Rovira, Hospital General de L'Hospitalet, Barcelona, Spain.
Pau Garro, Hospital General de Granollers, Barcelona, Spain.
Diana Colon, Hospital General de Granollers, Barcelona, Spain.
Carlos Castillo, Hospital Txagorritxu, Vitoria, Spain.
Juan Fernado, Hospital Txagorritxu, Vitoria, Spain.
Maria Jesus Lopez, Hospital Universitario de Burgos, Burgos, Spain.
Jose Luis Fernandez, Hospital Universitario de Burgos, Burgos, Spain.
Ana Maria Arribas, Hospital Universitario de Burgos, Burgos, Spain.
Jose Luis Teja, Hospital Universitario Marques de Valdecilla, Santander, Spain.
Elsa Ots, Hospital Universitario Marques de Valdecilla, Santander, Spain.
Juan Carlos Montejo, Hospital Universitario 12 de Octubre, Madrid, Spain.
Mercedes Catalan, Hospital Universitario 12 de Octubre, Madrid, Spain.
Isidro Prieto, Hospital Ramon y Cajal, Madrid, Spain.
Gloria Gonzalo, Hospital Ramon y Cajal, Madrid, Spain.
Beatriz Galvan, Hospital Universitario La Paz, Madrid, Spain.
Miguel Angel Blasco, Hospital Universitario Severo Ochoa, Madrid, Spain.
Estibaliz Meyer, Hospital Universitario Severo Ochoa, Madrid, Spain.
Frutos Del Nogal, Hospital Universitario Severo Ochoa, Madrid, Spain.
Loreto Vidaur, Hospital Universitario de Donostia, Donostia, Spain.
Rosa Sebastian, Hospital Universitario de Donostia, Donostia, Spain.
Pila Marco Garde, Hospital Universitario de Donostia, Donostia, Spain.
Maria del Mar Martin Velasco, Hospital Universitario Nuestra Señora de Candelaria, Spain.
Rafael Zaragoza Crespo, Hospital Universitario Dr Peset, Spain.
Mariano Esperatti, Institut Clínic del Tòrax, Hospital Clinic, IDIBAPS, Barcelona, Spain; Centro de Investigación Biomedica En Red- Enfermedades Respiratorias (CibeRes).
Antoni Torres, Institut Clínic del Tòrax, Hospital Clinic, IDIBAPS, Barcelona, Spain; Centro de Investigación Biomedica En Red- Enfermedades Respiratorias (CibeRes).
Philippe Montravers, Centre Hospitalier Universitaire Bichat-Claude Bernard, AP-HP, Université Paris VII, Paris, France.
Olivier Baldesi, Centre Hospitalier Pays D Aix, Aix en Provence, France, and AzuRea Group, France.
Herve Dupont, Centre Hospitalier Universitaire d'Amiens, Amiens, France.
Yazine Mahjoub, Centre Hospitalier-Universitaire d'Amiens, Amiens, France, and AzuRea Group, France.
Sigismond Lasocki, Centre Hospitalier-Universitaire d'Angers, Angers, France.
Jean Michel Constantin, Centre Hospitalier Universitaire de Clermont-Ferrand, Clermont-Ferrand, France, and AzuRea Group, France.
Jean François Payen, Centre Hospitalier-Universitaire Grenoble, Grenoble France, and AzuRea Group, France.
Claude Martin, Hopital Nord, Marseille, France, and AzuRea Group, France.
Jacques Albanese, Hopital Nord, Marseille, France, and AzuRea Group, France.
Yannick Malledant, Hôpital Pontchaillou, Rennes, France.
Julien Pottecher, University Hospital, Strasbourg, France, and AzuRea Group, France.
Jean-Yves Lefrant, Centre Hospitalier-Universitaire Nimes, Nimes, France, and AzuRea Group, France.
Samir Jaber, Hospitalier-Universitaire Montpellier, Montpellier, France, and AzuRea Group, France.
Olivier Joannes-Boyau, Centre Hospitalier-Universitaire Bordeaux, Bordeaux, France, and AzuRea Group, France.
Christophe Orban, Centre Hospitalier-Universitaire Nice, Nice, France, and AzuRea Group, France.
Marlies Ostermann, St Thomas' Hospital, London, UK.
Catherine McKenzie, St Thomas' Hospital, London, UK.
Willaim Berry, St Thomas' Hospital, London, UK.
John Smith, St Thomas' Hospital, London, UK.
Katie Lei, St Thomas' Hospital, London, UK.
Francesca Rubulotta, Charing Cross Hospital, Imperial Healthcare NHS Trust, London, UK.
Anthony Gordon, Charing Cross Hospital, Imperial Healthcare NHS Trust, London, UK.
Stephen Brett, Hammersmith Hospital, Imperial Healthcare NHS Trust, London, UK.
Martin Stotz, St Mary's Hospital, Imperial Healthcare NHS Trust, London, UK.
Maie Templeton, St Mary's Hospital, Imperial Healthcare NHS Trust, London, UK.
Andrew Rhodes, St George's Hospital, St George's Healthcare NHS Trust, London, UK.
Claudia Ebm, St George's Hospital, St George's Healthcare NHS Trust, London, UK.
Carl Moran, St George's Hospital, St George's Healthcare NHS Trust, London, UK.
Kirsi-Maija Kaukonen, Helsinki University Central Hospital, Helsinki, Finland.
Ville Pettilä, Helsinki University Central Hospital, Helsinki, Finland.
George Dimopoulos, Attikon University Hospital, Athens, Greece.
Despoina Koulenti, Attikon University Hospital, Athens, Greece.
Aglaia Xristodoulou, Attikon University Hospital, Athens, Greece.
Vassiliki Theodorou, University Hospital of Alexandroupolis, Alexandroupolis, Greece.
Georgios Kouliatsis, University Hospital of Alexandroupolis, Alexandroupolis, Greece.
Eleni Sertaridou, University Hospital of Alexandroupolis, Alexandroupolis, Greece.
Georgios Anthopoulos, 251 Air Force General Hospital of Athens, Athens, Greece.
George Choutas, 251 Air Force General Hospital of Athens, Athens, Greece.
Thanos Rantis, 251 Air Force General Hospital of Athens, Athens, Greece.
Stylianos Karatzas, General Hospital of Athens ‘Hippokrateion’, Athens, Greece.
Margarita Balla, General Hospital of Athens ‘Hippokrateion’, Athens, Greece.
Metaxia Papanikolaou, General Hospital of Athens ‘Hippokrateion’, Athens, Greece.
Pavlos Myrianthefs, ‘Aghioi Anargyroi’ Hospital, Athens, Greece.
Alexandra Gavala, ‘Aghioi Anargyroi’ Hospital, Athens, Greece.
Georgios Fildisis, ‘Aghioi Anargyroi’ Hospital, Athens, Greece.
Antonia Koutsoukou, Sotiria General Hospital, Athens, Greece.
Magdalini Kyriakopoulou, Sotiria General Hospital, Athens, Greece.
Kalomoira Petrochilou, Sotiria General Hospital, Athens, Greece.
Maria Kompoti, ‘Thriassio’ General Hospital of Eleusi, Athens, Greece.
Martha Michalia, ‘Thriassio’ General Hospital of Eleusi, Athens, Greece.
Fillis-Maria Clouva-Molyvdas, ‘Thriassio’ General Hospital of Eleusi, Athens, Greece.
Georgios Gkiokas, Aretaieion University Hospital, Athens, Greece.
Fotios Nikolakopoulos, Aretaieion University Hospital, Athens, Greece.
Vasiliki Psychogiou, Aretaieion University Hospital, Athens, Greece.
Polychronis Malliotakis, University Hospital Herakleion, Crete, Greece.
Evangelia Akoumianaki, University Hospital Herakleion, Crete, Greece.
Emmanouil Lilitsis, University Hospital Herakleion, Crete, Greece.
Vassilios Koulouras, University Hospital of Ioannina, Ioannina, Greece.
George Nakos, University Hospital of Ioannina, Ioannina, Greece.
Mihalis Kalogirou, University Hospital of Ioannina, Ioannina, Greece.
Apostolos Komnos, General Hospital of Larisa, Larisa, Greece.
Tilemachos Zafeiridis, General Hospital of Larisa, Larisa, Greece.
Christos Chaintoutis, General Hospital of Larisa, Larisa, Greece.
Kostoula Arvaniti, General Hospital of Thessaloniki ‘G. Papageorgiou’, Thessaloniki, Greece.
Dimitrios Matamis, General Hospital of Thessaloniki ‘G. Papageorgiou’, Thessaloniki, Greece.
Christos Chaintoutis, General Hospital of Thessaloniki ‘G. Papageorgiou’, Thessaloniki, Greece.
Christina Kydona, General Hospital of Thessaloniki ‘Hippokrateion’, Thessaloniki, Greece.
Nikoleta Gritsi-Gerogianni, General Hospital of Thessaloniki ‘Hippokrateion’, Thessaloniki, Greece.
Tatiana Giasnetsova, General Hospital of Thessaloniki ‘Hippokrateion’, Thessaloniki, Greece.
Maria Giannakou, Ahepa University Hospital, Thessaloniki, Greece.
Ioanna Soultati, Ahepa University Hospital, Thessaloniki, Greece.
Ilias Chytas, Ahepa University Hospital, Thessaloniki, Greece.
Eleni Antoniadou, General Hospital ‘G. Gennimatas’, Thessaloniki, Greece.
Elli Antipa, General Hospital ‘G. Gennimatas’, Thessaloniki, Greece.
Dimitrios Lathyris, General Hospital ‘G. Gennimatas’, Thessaloniki, Greece.
Triantafyllia Koukoubani, General Hospital of Trikala, Trikala, Greece.
Theoniki Paraforou, General Hospital of Trikala, Trikala, Greece.
Kyriaki Spiropoulou, General Hospital of Trikala, Trikala, Greece.
Vasileios Bekos, Naval Hospital of Athens, Athens, Greece.
Anna Spring, Naval Hospital of Athens, Athens, Greece.
Theodora Kalatzi, Naval Hospital of Athens, Athens, Greece.
Hara Nikolaou, ‘Aghia Olga-Konstantopouleion’ General Hospital, Athens, Greece.
Maria Laskou, ‘Aghia Olga-Konstantopouleion’ General Hospital, Athens, Greece.
Ioannis Strouvalis, ‘Aghia Olga-Konstantopouleion’ General Hospital, Athens, Greece.
Stavros Aloizos, General Hospital of Athens ‘NIMITS’, Athens, Greece.
Spyridon Kapogiannis, General Hospital of Athens ‘NIMITS’, Athens, Greece.
Ourania Soldatou, General Hospital of Athens ‘NIMITS’, Athens, Greece.
Matteo Bassetti, Azienda Ospedaliera Universitaria Santa Maria della Misericordia, Udine, Italy.
Chiara Adembri, Azienda Ospedaliero Universitaria Careggi, Florence, Italy.
Gianluca Villa, Azienda Ospedaliero Universitaria Careggi, Florence, Italy.
Antonio Giarratano, Università degli Studi di Palermo, Palermo, Italy.
Santi Maurizio Raineri, Università degli Studi di Palermo, Palermo, Italy.
Andrea Cortegiani, Università degli Studi di Palermo, Palermo, Italy.
Francesca Montalto, Università degli Studi di Palermo, Palermo, Italy.
Maria Teresa Strano, Università degli Studi di Palermo, Palermo, Italy.
V. Marco Ranieri, San Giovanni-Battista Molinette, Turin, Italy.
Claudio Sandroni, Catholic University School of Medicine, Rome, Italy.
Gennaro De Pascale, Catholic University School of Medicine, Rome, Italy.
Alexandre Molin, University of Genoa, Genoa, Italy.
Paolo Pelosi, University of Genoa, Genoa, Italy.
Luca Montagnani, Universitaria San Martino, Genova, Italy.
Rosario Urbino, Universitaria S. Giovanni Battista della Città di Torino, Torino, Italy.
Ilaria Mastromauro, Universitaria S. Giovanni Battista della Città di Torino, Torino, Italy.
Francesco G. De Rosa, Universitaria S. Giovanni Battista della Città di Torino, Torino, Italy.
V. Marco Ranieri, Universitaria S. Giovanni Battista della Città di Torino, Torino, Italy.
Teresa Cardoso, Hospital de Santo António, Porto, Portugal.
Susana Afonso, Hospital de St António dos Capuchos, Lisbon, Portugal.
João Gonçalves-Pereira, Hospital de São Francisco Xavier, Lisbon, Portugal.
João Pedro Baptista, Hospital de Universidade de Coimbra, Coimbra, Portugal.
Murat Akova, Hacettepe University School of Medicine, Ankara, Turkey.
Arife Özveren, Hacettepe University School of Medicine, Ankara, Turkey.
References
Author notes
All members of the DALI Study Group are listed in the Acknowledgements section.
