


Abstract
Atazanavir without ritonavir, despite efficacy and tolerability, shows low plasma concentrations that warrant optimization.
In a randomized, controlled, pilot trial, stable HIV-positive patients on atazanavir/ritonavir (with tenofovir/emtricitabine) were switched to atazanavir. In the standard-dose arm, atazanavir was administered as 400 mg once daily, while according to patients' genetics (PXR, ABCB1 and SLCO1B1), in the pharmacogenetic arm: patients with unfavourable genotypes received 200 mg of atazanavir twice daily. EudraCT number: 2009-014216-35.
Eighty patients were enrolled with balanced baseline characteristics. The average atazanavir exposure was 253 ng/mL (150–542) in the pharmacogenetic arm versus 111 ng/mL (64–190) in the standard-dose arm (P < 0.001); 28 patients in the pharmacogenetic arm (75.7%) had atazanavir exposure >150 ng/mL versus 14 patients (38.9%) in the standard-dose arm (P = 0.001). Immunovirological and laboratory parameters had a favourable outcome throughout the study with non-significant differences between study arms.
Atazanavir plasma exposure is higher when the schedule is chosen according to the patient's genetic profile.
Introduction
In the lifelong perspective of anti-HIV treatment, individual tailoring of the antiretroviral regimen will be increasingly required. Although never formally approved in Europe, the use of atazanavir without concurrent intake of ritonavir has been shown to be effective and well tolerated in two induction–maintenance clinical trials of relevant size and several retrospective studies.1–4 However, in a significant proportion of patients, the pharmacokinetic exposure of atazanavir might be potentially insufficient to guarantee long-term HIV inhibition.5,6 Lower atazanavir exposure when combined with tenofovir disoproxil fumarate has been shown in healthy volunteers; however it was subsequently found to be less relevant in HIV-positive patients.7–9 Atazanavir pharmacokinetics is significantly influenced by genetic polymorphisms in the region coding for the pregnane X receptor (PXR, controlling the expression of several genes involved in drug metabolism and transport); additionally, polymorphisms in ABCB1 (coding for P-glycoprotein) and SLCO1B1 (coding for OATP1B1) have been shown to have a comparable effect on atazanavir exposure.10–12 Furthermore, we observed that the pharmacokinetic exposure of atazanavir was significantly improved when administered as 200 mg twice daily instead of 400 mg once daily.13
We report here the results of a randomized comparative study on the clinical use of unboosted atazanavir with or without pharmacogenetic guidance in patients also taking coformulated tenofovir/emtricitabine.
Methods
HIV-positive adult patients on treatment with atazanavir/ritonavir (300/100 mg) plus tenofovir/emtricitabine with HIV RNA <50 copies/mL for ≥6 months were eligible for enrolment at two sites in Italy. Switch to atazanavir was proposed for toxicity/tolerability reasons or simplification, according to physicians' evaluation in clinical practice. Exclusion criteria were previous virological failure, genotypic resistance-associated mutations, ongoing opportunistic infections/neoplasias, liver cirrhosis, chronic renal failure, self-reported adherence <90% (visual scale) and consumption of potentially interacting drugs.
The study was approved by the institutional review board at both participating centres and each participant provided signed informed consent before enrolment. The procedures were in accordance with the ethics standards of the Helsinki Declaration of 1975 (as revised in 1983).
The study was a randomized, controlled, open-label, pilot trial. Patients were randomized 1 : 1 (block randomization) to either the standard-dose arm (400 mg of atazanavir once daily) or the pharmacogenetic arm (400 mg of atazanavir once daily in patients with a favourable genetic profile or 200 mg of atazanavir twice daily in patients with an unfavourable genetic profile). At enrolment, genomic DNA was extracted using the QIAmp whole blood mini kit (Qiagen, Valencia, CA, USA) and genotyping was conducted by real time-based allelic discrimination with the use of standard methods (Bio-Rad, Milan, Italy). The following SNPs were analysed: C63396T in PXR (rs2472677), C3435T in ABCB1 (rs1045642) and C521T in SLCO1B1 (rs4149056). PXR 63396 TT, ABCB1 3435 CT/TT and SLCO1B1 521 TT were codified as 1 (associated with lower plasma concentrations). On the basis of the pharmacogenetic results, patients were given a score (minimum 0 to maximum 3) and a different dosing schedule according to favourable (≤1) or unfavourable genetic profiles (≥2).
The primary endpoint was the prevalence of atazanavir average trough concentrations (geometric mean of the first three determinations at weeks 4, 8 and 12) >150 ng/mL (suggested target plasma level) in the two arms. Secondary endpoints were the comparison of the proportion of patients with HIV RNA <50 copies/mL and of the changes in indirect bilirubin, total cholesterol, LDL cholesterol, HDL cholesterol and triglycerides at 48 weeks.
Atazanavir trough plasma concentrations [12/24 h after drug intake according to drug schedule (±2 h)] were measured by a previously validated HPLC-photodiode array method and determined in Turin.14
A sample size of 80 patients (40 per group) was calculated to provide a statistical power of ≥80%, in order to identify a difference in mean atazanavir Ctrough below the minimum effective concentration (MEC) of 150 ng/mL between the two study arms. A proportion of 20% of atazanavir Ctrough under MEC in the pharmacogenetic arm, and 50% in the control arm was inferred from previous studies results.10–12 Standard non-parametric tests were used for all analyses and performed using SPSS 20.0 software for Mac (SPSS, IBM).
EudraCT number: 2009-014216-35.
Results
Eighty patients were enrolled (2009–11) and demographic and immunovirological characteristics were well balanced between the study arms (Table 1). Patients' disposition is shown in Figure S1 (available as Supplementary data at JAC OnlineSupplementary Data; no subject dropped out of the study due to toxicity, virological failure or major clinical events. The prevalence of SNPs is reported in Table 1; all variants were in Hardy–Weinberg equilibrium. Twenty-seven patients in the pharmacogenetic arm received 200 mg of atazanavir twice daily.
Demographics and immunovirological and pharmacogenetic characteristics of randomized patients
| Characteristic | Standard-dose arm (n = 40) | Pharmacogenetic arm (n = 40) | P |
|---|---|---|---|
| Age (years), median (IQR) | 43 (37–47) | 44 (38–50) | 0.424 |
| Male, n (%) | 28 (70) | 30 (75) | 0.783 |
| Ethnicity, n (%) | 0.487 | ||
| white | 37 (92.5) | 34 (85) | |
| black | 1 (2.5) | 3 (7.5) | |
| other | 2 (5) | 3 (7.5) | |
| BMI (kg/m2), median (IQR) | 22.9 (20.2–25.3) | 23.9 (21–26.2) | 0.421 |
| Duration of HIV infection (years), median (IQR) | 5.9 (3.7–12.4) | 7.3 (3.7–12.3) | 0.665 |
| CD4+ T lymphocytes (cells/mm3), median (IQR) | 541 (428–628) | 467 (320–600) | 0.063 |
| CD4+/CD8+ T lymphocyte ratio, median (IQR) | 0.65 (0.53–1.1) | 0.60 (0.5–1.29) | 0.864 |
| Hepatitis B surface antigen positive, n (%) | 6 (15) | 1 (2.5) | 0.049 |
| Hepatitis C antibody positive, n (%) | 8 (20) | 8 (20) | 0.823 |
| SNPs, n (%) | |||
| PXR 63396 TT | 12 (30) | 10 (25) | 0.848 |
| ABCB1 3435 CT/TT | 28 (70) | 29 (72.5) | 0.364 |
| SLCO1B1 521 TT | 30 (75) | 33 (82.5) | 0.848 |
| Favourable pharmacogenetic score (≤1), n (%) | 14 (35) | 13 (32.5) | 0.797 |
Values were compared between the two arms using the χ2 test (Fisher's exact test where appropriate) for categorical values and the Mann–Whitney test for continuous variables; two-sided P values are shown in the last column.
Atazanavir plasma trough concentrations are shown in Supplementary Data and Supplementary Data. Atazanavir Ctrough was slightly higher at baseline in the pharmacogenetic arm [1034 ng/mL (592–1935) versus 587 ng/mL (77–1290); P = 0.06, Mann–Whitney] as compared with the standard-dose arm; it was significantly higher at every timepoint after randomization (P < 0.001 for all comparisons, Mann–Whitney) in the pharmacogenetic arm.
The geometric mean of week 4–12 atazanavir Ctrough values was 253 ng/mL (150–542) in the pharmacogenetic arm versus 111 ng/mL (64–190) in the standard-dose arm, favouring the former (P < 0.001, Mann–Whitney). As for the primary endpoint, 28 patients in the pharmacogenetic arm (75.7%) had an average atazanavir Ctrough >150 ng/mL versus 14 patients (38.9%) in the standard-dose arm (P = 0.001; RR 4.89, 95% CI 1.79–13.38) (Figure 1).
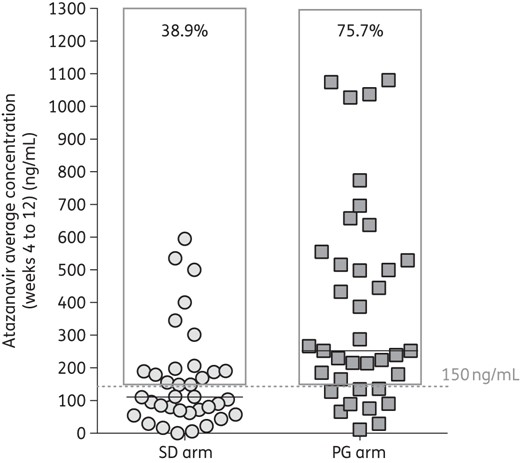
Atazanavir average concentration (weeks 4–12) according to study arm. Symbols indicate the geometric means of trough concentrations obtained at weeks 4, 8 and 12 and the horizontal lines represent median values. The grey frames represent the percentage of patients with average exposure >150 ng/mL. SD, standard dose; PG, pharmacogenetic.
At week 48 similar rates of plasma HIV RNA <50 copies/mL were observed: 37 patients (100%) in the pharmacogenetic arm versus 33 patients (97%) in the standard-dose arm at week 48. Three patients (8.1%) and four patients (11.1%) in the pharmacogenetic arm and standard-dose arm, respectively, presented a viral blip during the study (P = 0.703, Fisher's exact test). Patients in both arms had similar CD4+ T lymphocyte recovery at week 48: 39 cells/mm3 in the pharmacogenetic arm versus 53 cells/mm3 in the standard-dose arm (P = 0.744, Mann–Whitney).
At 48 weeks, significant decreases (all P < 0.05, Wilcoxon) in safety markers were noted as compared with baseline; however, no significant differences between study arms were found (Mann–Whitney) (Supplementary Data).
Discussion
In this pilot, randomized, controlled study, we found that the pharmacokinetic exposure of atazanavir, when coadministered with tenofovir/emtricitabine, was significantly higher and closer to the desired target concentration when the frequency of administration was chosen according to the patient's genetic profile. The proportion of patients with atazanavir Ctrough above the cut-off concentration rose from 40% (previous studies and the standard arm) to 75.7% (study arm) when the frequency of atazanavir administration (400 mg once daily or 200 mg twice daily) was decided on the basis of the individual genotypic profile.10–12 Although not all patients had a Ctrough level above the pre-specified cut-off value of 150 ng/mL, the pharmacokinetic exposure in the study arm was found to be significantly more appropriate than in the control arm. Baseline atazanavir levels were higher in the pharmacogenetic arm than in the standard dose arm: this was possibly due to unbalanced factors between the study arms (such as CYP3A5 genotype and adherence levels), and atazanavir exposures not explained by the studied genotypes (Supplementary Data) may suggest the importance of other variables in explaining the observed variability in drug exposure.15 It must, however, be considered that the 150 ng/mL threshold resulted from the analysis of a moderately experienced population of HIV-infected patients that was no longer formally reassessed in treatment-naive patients: it appears possible that it could be lower in patients not harbouring virus with resistance associated mutations and after achieving viral suppression.6,16,17 The documented higher intracellular accumulation of atazanavir as compared with other PIs might also support this hypothesis.18,19 No significant difference in the prevalence of viral control or in changes in safety markers between study arms was seen. It is possible that longer follow-up may be required to observe the effect of improved pharmacokinetic exposure or that lower atazanavir concentrations may be adequate.
Independently of study arm, the atazanavir-based regimens were well tolerated and associated with improved safety profiles. Even if the drug is nowadays less used given the availability of safe and very compact antiretroviral regimens, it may be very useful in the long-term treatment of HIV-positive patients. The absence of ritonavir (associated with side effects even at low doses) and the uncommon incidence of hyperbilirubinaemia (being the main determinant of atazanavir/ritonavir inferior performance in naive patients) support the attractiveness of atazanavir-containing regimens.20 Even if the need for genetic testing prior to starting atazanavir might not be commonly accepted, it can be a tool for avoiding unnecessary treatment interruptions and side effects.21 Although some patients (those with an unfavourable genetic profile) would be required to take the drug twice daily instead of once daily, the advantage in terms of side effect reduction might compensate for the higher frequency of administration.
We have to recognize some limitations of this study: the limited sample size, the restricted number of included genetic polymorphisms, the presence of potentially unbalanced factors between the study arms, and the need for therapeutic drug monitoring in some patients in the pharmacogenetic arm.
Genetic testing performed ‘once in a lifetime’ offers the possibility to know in advance the likelihood of an individual patient achieving a more appropriate atazanavir pharmacokinetic exposure and to choose the frequency of administration accordingly. If confirmed, this observation supports the use of pharmacogenetics for treatment tailoring in atazanavir-receiving, HIV-positive patients.
Funding
This study was funded by an unrestricted grant from Bristol-Myers Squibb, the manufacturer of atazanavir. The funding source had no role in data collection, analysis, interpretation, trial design, patient recruitment, writing of the manuscript or the decision to submit the manuscript for publication. The corresponding author had full access to all the data in the study and had final responsibility for the decision to submit for publication.
Transparency declarations
S. B. has received grants, travel grants and consultancy fees from Abbott, Boehringer Inghelheim, Bristol-Myers Squibb, Gilead Sciences, GlaxoSmithKline, Merck Sharp & Dohme, Pfizer and Janssen-Cilag. S. R. has received grants, travel grants and speaker's honoraria from Abbott, Bristol-Myers Squibb, Merck Sharp & Dohme and Janssen-Cilag. A. C. has received grants, travel grants and speaker's honoraria from Abbott, Bristol-Myers Squibb, Merck Sharp & Dohme and Janssen-Cilag. M. G. has received grants, travel grants and speaker's honoraria from Abbott, Bristol-Myers Squibb, Merck Sharp & Dohme and Janssen-Cilag. G. D. P. has received grants, travel grants and consultancy fees from Abbott, Boehringer Ingelheim, Bristol-Myers Squibb, Gilead Sciences, GlaxoSmithKline, Merck Sharp & Dohme, Pfizer, Roche and Tibotec (Johnson & Johnson). All other authors: none to declare.
Author contributions
S. B., S. R., M. S., A. D. and G. D. P. designed the study and contributed to data collection. A. C. performed data interpretation and statistical analysis and generated the random allocation sequence. S. R., M. B., O. V., M. L., A. T. and L. M. contributed to data collection. A. C. and M. B. drafted the first version of the manuscript and finalized the manuscript. J. C., M. S. and A. D. performed the pharmacokinetic and pharmacogenetic analysis and revised the technical details of the paper. S. B., S. R., G. D. P. and M. G. contributed to study design, supervision and critical revision of the manuscript for intellectual content. All authors read and approved the final manuscript.
Acknowledgements
This work was presented at the Twentieth Conference on Retroviruses and Opportunistic Infections, Atlanta, GA, USA, 2013 (P556) and at the Fourteenth Conference of the European AIDS Clinical Society, Brussels, Belgium, 2013 (PE 10/14).
References
Author notes
These two authors equally contributed to the study.
