


Abstract
We aimed to examine whether Emergency Department (ED) quality strategies, safety culture and leadership were associated with patient-level outcomes, after controlling for other organization-level factors, in 32 large Australian hospitals.
Quantitative observational study, using linear and multi-level modelling to identify relationships between quality management systems at organization level; quality strategies at ED level for acute myocardial infarction (AMI), hip fracture and stroke; clinician safety culture and leadership and patient-level outcomes of waiting time and length of stay.
Thirty-two large Australian public hospitals.
Audit of quality management processes at organization and ED levels, senior quality manager at each of the 32 participating hospitals, 394 ED clinicians (doctors, nurses and allied health professionals).
Within the multi-level model, associations were assessed between organization-level quality measures and ED quality strategies; organization-level quality measures and ED quality strategies and ward-level clinician measures of teamwork climate (TC), safety climate (SC) and leadership for AMI, hip fracture and stroke treatment conditions; and organization-level quality measures and ED quality strategies and ward-level clinician measures of TC, SC and leadership, and ED waiting time and length of stay (performance).
We found seven statistically significant associations between organization-level quality systems and ED-level quality strategies; four statistically significant associations between quality systems and strategies and ED safety culture and leadership; and nine statistically significant associations between quality systems and strategies and ED safety culture and leadership, and ED waiting time and length of stay.
Organization-level quality structures influence ED-level quality strategies, clinician safety culture and leadership and, ultimately, waiting time and length of stay for patients. By focusing only on time-based measures of ED performance we risk punishing EDs that perform well on patient safety measures. We need to better understand the trade-offs between implementing safety culture and quality strategies and improving patient flow in the ED, and to place more emphasis on other ED performance measures in addition to time.
Introduction
Both in Australia and internationally, Emergency Departments (EDs) typically measure headline performance in terms of patient flow. In 2017–18 there were >8 million presentations to Australian EDs: a 3.4% increase in presentations overall compared with the previous year [1]. Despite the introduction of National Emergency Access Targets (NEAT) across Australia in 2010, 28% of patients were not ‘seen on time’ in accordance with Australasian Triage Scale standards, and 29% of visits were not concluded within four hours [1]. Increasing numbers of patient presentations, coupled with limited in-patient bed capacity, can result in long waiting times and prolonged lengths of stay (LOS) in the ED. Overcrowding is becoming more prevalent and has previously been associated with an increase in medical errors [2, 3] and poor patient outcomes [4, 5] including death [6].
Australian EDs are required to report their performance on aspects such as waiting time and LOS, and quantifying how fast patients receive care [1]. When patients first arrive at EDs in Australian hospitals, a nurse allocates them to a triage category depending on the urgency of the presenting condition (resuscitation, emergency, urgent, semi-urgent and non-urgent). Waiting time performance targets are based on this triage category (immediate, within 10, 30, 60 and 120 min, respectively) [7]. Quality improvement strategies and models of care (e.g. Fast track, Clinical Initiatives Nurse) have been developed to reduce the time patients spend in ED [8]. ED performance targets such as the Emergency Treatment Performance (ETP; initially implemented as NEAT) expect 81% of patients presenting will physically leave the ED for admission, referral or discharged home within four hours [7]. Across Australia, the introduction of and compliance with NEAT/ETP has improved the timely provision of urgent care in public hospitals and is associated with reduced in-hospital mortality rates for patients admitted through ED [9]. However, EDs across Australia continue to experience access block (where the patient needs to be admitted, but there are no hospital beds available) and ED overcrowding (where there are no beds available in the ED) [1].
Concentrating on improving patient flow, however, has meant that less attention has been paid to other aspects of ED performance, such as clinician safety culture and leadership, patient experiences, and adherence to quality management practices and clinical guidelines. In the ED, safety culture and leadership measures capture the values, behaviours, perceptions and competencies of the ED staff related to health and safety [10, 11]. Patient and professional experiences can provide insight into the culture of the organization and the potential trade-offs that are being made to meet resource-based performance targets. Associations have been found between patient experience, patient safety and clinical effectiveness [12, 13]. Similarly, accreditation processes tell us about ED compliance with quality management practices and clinical guidelines. We suggest that factors such as safety culture and leadership influence ED performance and provide a richer picture of performance than measures of patient flow alone.
Hospitals are complex organizations with multiple competing targets (e.g. budget, quality and service) [11]. Performance culture, effective and supportive leaders across the hospital, as well as the existence, implementation and sustainability of quality systems are characteristics that are associated with high performing hospitals [11]. We know that patients are more satisfied with their care when staff display positive attitudes and waiting times are shorter [14, 15]. To date, however, research has yet to examine the relationship between hospital and department-level quality strategies with ED patient outcomes, so we do not know to what extent hospital quality management systems influence quality and safety at a department level such as the ED and therefore performance. Access blockages for admitted patients to other wards are the primary cause of overcrowding in the ED [16]. Therefore, in order to address ED overcrowding, it is important to consider organization-level factors that influence bed capacity throughout the hospital.
The ‘Deepening our Understanding of Quality in Australia’ (DUQuA) study [17] was a 5-year Australia-wide, multi-level, multimillion dollar cross-sectional study exploring how quality management systems, leadership and culture in Australian hospitals are related to care delivery and patient outcomes for acute myocardial infarction (AMI), hip fracture and stroke. Evidence- or consensus-based measurement tools were designed or modified and then utilized to collect quantitative data on quality management systems at hospital and care pathway levels, clinician leadership and culture, clinical treatment processes, patient outcomes and patient perceptions of safety. Because the ED is a common entry point for AMI, hip fracture and stroke in Australian hospitals, we aimed to explore whether ED quality strategies were associated with patient-level outcomes after controlling for other organization-level factors.
Methods
A study protocol for the full study has been published [17]. Here, we provide a summary of the methods relevant to this study, focused on the ED measures, including waiting times and LOS; four department-level care pathway measures for AMI, hip fracture and stroke; and three department-level culture and leadership measures. The three department-level and four care pathway measures were initially developed for the Deepening our Understanding of Quality improvement in Europe (DUQuE) study and adapted and validated by DUQuA to ensure relevance to the targeted Australian hospitals [18]. Figure 1 shows the hypothesised relationships between the ED measures in the DUQuA study. These measures are described below.
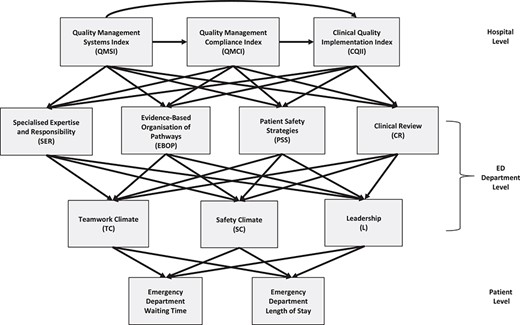
Simplified Directed Acyclic Graph (DAG) showing the relationships between the ED measures in DUQuA.
Measures
Organization-level measures
The three organization-level measures are the Quality Management Systems Index (QMSI), the Quality Management Compliance Index (QMCI), and the Clinical Quality Implementation Index (CQII). QMSI is a measure of the managerial aspects of quality management, such as developing and implementing formally agreed quality policy, and is measured using a questionnaire completed by the quality manager in each hospital. QMSI consists of eight subscales, seven of which achieved adequate internal consistency (Cronbach’s α > 0.8) during validation [18]. QMCI is a measure of the managerial aspects of quality improvement in hospitals, such as monitoring patient and professional opinions. QMCI consists of two subscales, both of which achieved adequate internal consistency (Cronbach’s α > 0.8) during validation [18]. CQII is a seven subscale measure of the existence, implementation and sustainability of quality systems, for example preventing and controlling healthcare associated infections. QMCI and CQII are both assessed during an on-site audit by trained external surveyors. When validating CQII, lack of variation and ceiling effects in the data resulted in very low internal consistency scores, but items were retained for theoretical reasons [18]. Detail on refinement and validation of the organization-level measures is presented elsewhere in this Supplement [18].
ED-level care pathway measures
The four measures of quality management activities in the ED are based on the results of an on-site audit completed by trained external surveyors. Specialized Expertise and Responsibility (SER) explores how clinical responsibilities were assigned for a particular condition; Evidence-Based Organization of Pathways (EBOP) measures whether ED processes, such as admission, acute care, rehabilitation and discharge, were organized to facilitate evidence-based care recommendations; Patient Safety Strategies (PSS) measures the use of clinical practice guidelines; and Clinical Review (CR) assesses the extent to which audit and systematic monitoring are integrated in ED quality management mechanisms. Separate condition-specific measures were developed for SER, EBOP and CR, relevant to the ED component of care for each condition; PSS items are all generic, so no condition-specific versions were needed. Refinement and validation methods for the department-level measures are described elsewhere in this Supplement [18]; data for the ED-level care pathway measures is presented at Supplementary eTable 1 in this article’s Appendix Material.
ED-level culture and leadership measures
The DUQuA safety culture and leadership scale comprises the following three subscales: teamwork climate (TC), safety climate (SC) and leadership, (L). TC (14 items) is a measure of perceived quality of collaboration between personnel, whereas SC (13 items) measures staff perceptions of the presence of a strong and proactive organizational commitment to patient safety. The leadership scale (eight items) measures clinician perceptions of the vision, inclusiveness and internal and external collaborative behaviours of healthcare leaders in the ED. Refinement and validation of the clinician safety culture and leadership measures is presented elsewhere in this supplement [19]. The three scales are completed by volunteer ED clinicians.
Patient-level measures
Patient-level measures include waiting time to be seen for emergency presentations, and LOS from ED presentation to physical departure. Hospital-level summary data were extracted by the Australian Institute of Health and Welfare (AIHW) from the National Non-admitted Patient Emergency Department Care Database (NNAPEDC) to which all participating hospitals contribute; we used the published results for the participating hospitals for 1 July 2014 to 30 June 2015.
Participants
The study population comprised 78 Australian public hospitals meeting the DUQuA hospital inclusion criteria of approximately 200 beds or more, with an ED, and 10 or more admissions per month for AMI, hip fracture and stroke [17]. All were invited, and 32 received ethics approval and participated.
Statistical analysis
The simplified Directed Acyclic Graph (DAG) at Figure 1 shows the hypothesized relations among variables, identifying the key variables controlled for in the statistical models. For example, to examine whether QMCI has an effect on ED-level PSS, we controlled for QMSI because the DUQuE study findings indicated that it is a predictor of both QMCI and the ED-level PSS.
The dataset was processed as detailed elsewhere in this Supplement [18] and analysed using SAS/STAT software version 9.4 (SAS Institute, Cary, NC, USA). Where there were no repeated measures (i.e. care pathway quality and clinician measures, and ED performance measures) general linear models were used to analyse the relationships. Models were adjusted for hospital peer group categorized as Referral vs Acute (A or B), in addition to variables in the DAG (Figure 1). For the ED performance measures, we included measures for the five triage categories (resuscitation, emergency, urgent, semi-urgent and non-urgent) and also adjusted for triage category in the models. When examining whether the ED-level clinician measures had an effect on the ED performance measures, we used the median department score for each of the three clinician measures. General linear mixed models were used to analyse repeated measures (in each ED multiple clinicians assessed TC, SC and leadership). The mixed models were adjusted for one random effect (hospital), several fixed effects (hospital peer group, clinician age, gender and profession and self-identified leadership role) and higher-level measures designated in the DAG. A large number of associations were assessed, but no adjustment was made for multiple comparisons; given the small number of hospitals and the resulting lack of statistical power, we preferred to examine the pattern of results, including the number of statistically significant results compared to that expected by chance (rationale for this approach is further discussed in another article in this Supplement) [20].
Multiple imputations [21] were used to address missing data at the organization level, as described in this Supplement [18]. Analysis was repeated for each of the 100 imputation datasets and the SAS/STAT MIANALYZE procedure was applied to obtain pooled parameter estimates and standard errors, if any imputed values were used in the calculations.
Results
Characteristics of participants
Hospitals and EDs
ED measures were collected from all 32 hospitals in the DUQuA study, and from 394 ED clinicians (doctors, nurses and allied health professionals). Characteristics of the participating hospitals can be found in Table 1 (compared to non-participating hospitals in Supplementary eTable 2). A timetable showing when data were collected for each measure can be found in Table 2.
Characteristics of participating hospitals
| Participating (N = 32) | ||
|---|---|---|
| Characteristic | N | % |
| State | ||
| ACT | 2 | 6.3 |
| NSW | 11 | 34.4 |
| NT | 1 | 3.1 |
| QLD | 8 | 25.0 |
| SA | 1 | 3.1 |
| TAS | 1 | 3.1 |
| VIC | 8 | 25.0 |
| WA | 0 | 0.0 |
| Hospital peer group | ||
| Principal referral | 17 | 53.1 |
| Public acute group A | 14 | 43.8 |
| Public acute group B | 1 | 3.1 |
| Remoteness area | ||
| Major cities | 26 | 81.3 |
| Inner regional | 4 | 12.5 |
| Outer regional | 2 | 6.3 |
| Average funded beds | ||
| <200 | 2 | 6.3 |
| 200–<500 | 17 | 53.1 |
| 500–<1000 | 11 | 34.4 |
| 1000 and more | 2 | 6.3 |
Timeline for data collection by measures for the DUQuA study
| Measures | Data collection timeline |
|---|---|
| Organization level | |
| 1. QMSI | September 2015–August 2017 |
| 2. External Quality Assessment (EQA) | April 2016–July 2017 |
| (a) QMCI | |
| (b) CQII | |
| Department level | |
| 1. EQA | April 2016–July 2017 |
| (a) SER | |
| (b) EBOP | |
| (c) PSS | |
| (d) CR | |
| 2. Safety culture and leadership measures | June 2016–November 2017 |
| Patient level | |
| 1. Clinical treatment indicators | September 2014–February 2015a |
| 2. AIHW inpatient statistic | July 2014–June 2015a |
| 3. Patient Measure of Safety (PMOS) | January 2016–November 2017 |
aReference date of collected data.
ED clinicians
Characteristics of the responding clinicians are summarized in Table 3. Respondents were more likely to be female and most commonly aged 25–34 years. The proportion of self-identified leaders was 61%, and more than half (52%) of the respondents were doctors. EDs are staffed primarily by doctors and nurses, so there were few allied health professionals.
Characteristics of ED clinicians
| ED (N = 394) | ||
|---|---|---|
| Characteristic | N | % |
| Gender | ||
| Male | 167 | 42.4 |
| Female | 227 | 57.6 |
| Age group (years) | ||
| 18–24 | 21 | 5.3 |
| 25–34 | 160 | 40.6 |
| 35–44 | 111 | 28.2 |
| 45–54 | 73 | 18.5 |
| 55–64 | 25 | 6.3 |
| 65–74 | 4 | 1.0 |
| Leadership | ||
| Yes | 242 | 61.4 |
| No | 152 | 38.6 |
| Profession | ||
| Physician | 205 | 52.0 |
| Nurse | 176 | 44.7 |
| Allied health | 13 | 3.3 |
Descriptive statistics
ED performance measures
Waiting time and LOS for the ED presentations are summarized in Table 4. Across all hospitals, the median waiting time for resuscitation was zero minutes for all hospitals. The median waiting time for emergency triage was 5.5 min on average across 32 hospitals, and the interquartile range was 4–6 min. For the rest of the presentations, the average median waiting time was over 19–27 min: the interquartile range was 12.5–24.0 min for urgent presentations, 19.0–38.0 min for semi-urgent presentations and 18.0–31.5 min for non-urgent presentations. The average median LOS in ED was similar for resuscitation, emergency and urgent triage categories (222–231 min), all longer than semi-urgent (155 min) and non-urgent (101 min) cases. Across all triage categories, the interquartile range was 169–207 min.
ED presentations waiting time and length of stay
| Triage category (performance target) | N | Mean | Median | Min | Max | Q1 | Q3 |
|---|---|---|---|---|---|---|---|
| Median waiting time (min) | |||||||
| Resuscitation (immediate) | 32 | 0.0 | 0.0 | 0 | 0 | 0.0 | 0.0 |
| Emergency (<10 min) | 32 | 5.5 | 6.0 | 1 | 10 | 4.0 | 6.0 |
| Urgent (<30 min) | 32 | 21.0 | 19.0 | 8 | 47 | 14.5 | 24.0 |
| Semi-urgent (<60 min) | 32 | 29.6 | 26.5 | 10 | 72 | 19.0 | 38.0 |
| Non-urgent (<120 min) | 32 | 27.1 | 25.5 | 11 | 59 | 18.0 | 31.5 |
| Totala | 32 | 20.0 | 17.5 | 8 | 48 | 13.0 | 27.0 |
| Median length of stay (min) | |||||||
| Resuscitation (<240 min) | 32 | 235.5 | 226.0 | 154 | 397 | 210.0 | 259.0 |
| Emergency (<240 min) | 32 | 239.0 | 231.0 | 186 | 344 | 215.0 | 262.5 |
| Urgent (<240 min) | 32 | 221.6 | 222.0 | 171 | 290 | 194.0 | 237.0 |
| Semi-urgent (<240 min) | 32 | 160.0 | 154.5 | 117 | 210 | 141.5 | 175.5 |
| Non-urgent (<240 min) | 32 | 99.7 | 100.5 | 55 | 138 | 87.5 | 109.5 |
| Totala | 32 | 187.2 | 188.5 | 147 | 232 | 169.0 | 206.5 |
aIncludes records for which the triage category was missing/unknown.
ED care pathway measures
As shown in Table 5, PSS and EBOP had mean scores above 3.0 (3.4 and 3.3 respectively). The mean score for SER was 2.4 and for CR was 1.8.
Descriptive statistics for ED-level measures
| Scalea | N | Mean | SD | Median | Min | Max | Q1 | Q3 |
|---|---|---|---|---|---|---|---|---|
| SER | 32 | 2.4 | 0.94 | 2.3 | 0.7 | 4 | 1.9 | 3.3 |
| EBOP | 32 | 3.3 | 0.61 | 3.5 | 1.9 | 4 | 3.1 | 3.8 |
| PSS | 32 | 3.4 | 0.43 | 3.6 | 2.3 | 4 | 3.1 | 3.8 |
| CR | 32 | 1.8 | 1.33 | 1.9 | 0 | 4 | 0.4 | 2.9 |
aEach scale had a possible range from 0 to 4.
ED safety culture and leadership measures
Descriptive statistics of the clinician-level measures are summarized in Table 6. Mean score was highest for TC (78.5) and around 70 for both SC and leadership (70.6 and 70.4 respectively).
Descriptive statistics for ED culture and leadership measures
| Scalea | N | Mean | SD | Median | Min | Max | Q1 | Q3 |
|---|---|---|---|---|---|---|---|---|
| TC | 372 | 78.5 | 12.21 | 78.6 | 21.4 | 100.0 | 71.4 | 87.5 |
| SC | 373 | 70.6 | 14.45 | 73.1 | 21.2 | 100.0 | 59.6 | 80.8 |
| Leadership (L) | 391 | 70.4 | 18.40 | 71.9 | 3.1 | 100.0 | 59.4 | 81.3 |
| Scalea | N | Mean | SD | Median | Min | Max | Q1 | Q3 |
|---|---|---|---|---|---|---|---|---|
| TC | 372 | 78.5 | 12.21 | 78.6 | 21.4 | 100.0 | 71.4 | 87.5 |
| SC | 373 | 70.6 | 14.45 | 73.1 | 21.2 | 100.0 | 59.6 | 80.8 |
| Leadership (L) | 391 | 70.4 | 18.40 | 71.9 | 3.1 | 100.0 | 59.4 | 81.3 |
aEach scale had a possible range from 0 to 100.
Associations
Effects of organization measures on ED-level measures
In Table 7, we report the effects of the three organization measures on the four ED-level measures. Out of the 12 associations examined, seven were statistically significant. QMSI had positive and statistically significant effect on SER, EBOP and PSS. For every unit increase in QMSI score (range 0–24), SER increased by 0.12; EBOP increased by 0.08 and PSS increased by 0.05 (range 0–4 for department-level scores). QMCI had positive and statistically significant effect on EBOP after adjusting for QMSI. For every unit increase in QMCI score (range 0–8), EBOP increased by 0.20 (range 0–4). CQII had positive and statistically significant effect on SER, EBOP and CR after adjusting for QMSI and QMCI. For every unit increase in CQII score (range 0–28), SER increased by 0.17; EBOP increased by 0.09 and CR increased by 0.24 (range 0–4 for all).
Associations of ED-level measures with hospital-level measures
| SER | EBOP | PSS | CR | |||||||||
|---|---|---|---|---|---|---|---|---|---|---|---|---|
| Predictor | N | Beta (95% CI) | P-value | N | Beta (95% CI) | P-value | N | Beta (95% CI) | P-value | N | Beta (95% CI) | P-value |
| QMSIa | 32 | 0.121 (0.019, 0.224) | 0.022* | 32 | 0.081 (0.014, 0.148) | 0.019* | 32 | 0.053 (0.005, 0.101) | 0.031* | 32 | 0.073 (−0.082, 0.229) | 0.343 |
| QMCIa,b | 32 | −0.055 (−0.339, 0.229) | 0.706 | 32 | 0.195 (0.024, 0.366) | 0.025* | 32 | 0.017 (−0.115, 0.150) | 0.797 | 32 | 0.175 (−0.252, 0.602) | 0.421 |
| CQIIa,b,c | 32 | 0.169 (0.060, 0.279) | 0.002* | 32 | 0.093 (0.026, 0.161) | 0.007* | 32 | 0.036 (−0.021, 0.094) | 0.217 | 32 | 0.236 (0.068, 0.404) | 0.006* |
Legend: QMSI (Index 0–24), QMCI (Index 0–8), CQII (Index 0–28), SER (Index 0–4), EBOP (Index 0–4), PSS (Index 0–4), CR (Index 0–4).
aAdjusted for hospital peer group.
b–cAdditionally adjusted for: bQMSI; and cQMCI.
*Statistically significant at 5%.
Effects of organization and pathway measures on culture and leadership measures
In Table 8, we report the effects of the three organization measures and the four pathway measures on the safety culture and leadership measures in the ED. Out of the 21 associations examined, four were statistically significant, as compared to one expected by chance. QMSI had positive and statistically significant effect on SC and leadership. For every unit increase in QMSI score, SC and leadership scores each increased by around one unit, on a 0–100 possible score range. EBOP had a negative and statistically significant effect on SC after adjusting for the three organization measures. For every unit increase in EBOP score, SC decreased by around six units (0–100 range). CR had a negative and statistically significant effect on leadership, after adjusting for the three organization measures. For every unit increase in CR score, leadership decreased by almost three units (0–100 range).
Associations of ED culture and leadership measures with hospital and ED-level measures
| TC | SC | L | |||||||
|---|---|---|---|---|---|---|---|---|---|
| Predictor | N | Beta (95% CI) | P-value | N | Beta (95% CI) | P-value | N | Beta (95% CI) | P-value |
| QMSIa | 372 | 0.325 (−0.290, 0.939) | 0.283 | 373 | 0.976 (0.155, 1.797) | 0.022* | 391 | 1.089 (0.179, 2.000) | 0.021* |
| QMCIa,b | 372 | 0.132 (−1.647, 1.911) | 0.878 | 373 | −0.204 (−2.596, 2.189) | 0.862 | 391 | −0.077 (−2.731, 2.577) | 0.952 |
| CQIIa,b,c | 372 | 0.420 (−0.354, 1.194) | 0.287 | 373 | 0.618 (−0.420, 1.655) | 0.243 | 391 | 0.246 (−0.942, 1.435) | 0.685 |
| SERa,b,c,d | 372 | −0.744 (−3.206, 1.719) | 0.554 | 373 | −2.599 (−5.685, 0.486) | 0.099 | 391 | −2.626 (−6.165, 0.914) | 0.146 |
| EBOPa,b,c,d | 372 | −2.196 (−6.315, 1.922) | 0.296 | 373 | −6.106 (−11.15, −1.07) | 0.018* | 391 | −4.607 (−10.66, 1.443) | 0.136 |
| PSSa,b,c,d | 372 | 0.080 (−5.850, 6.011) | 0.979 | 373 | 0.059 (−7.563, 7.682) | 0.988 | 391 | 1.359 (−7.396, 10.11) | 0.761 |
| CRa,b,c,d | 372 | −0.928 (−2.696, 0.839) | 0.303 | 373 | −1.961 (−4.119, 0.197) | 0.075 | 391 | −2.765 (−5.204, −.326) | 0.026* |
Legend: QMSI (Index 0–24), QMCI (Index 0–8), CQII (Index 0–28), SER (Index 0–4), EBOP (Index 0–4), PSS (Index 0–4), CR (Index 0–4), TC (Index 0–100), SC (Index 0–100), L (Index 0–100).
aAdjusted for random effect (hospital), and fixed effects (hospital peer group, clinician gender, age group, profession and leadership).
b–dAdditionally adjusted for fixed effects: bQMSI; cQMCI; and dCQII.
*Statistically significant at 5%.
Effects of organization, ED level, and ED safety culture and leadership measures on ED performance measures
Table 9 reports the effects of the three organization measures, the four pathway measures and the three culture and leadership measures on the two ED performance measures. Of the 20 associations examined, nine were statistically significant. In accordance with national ED performance targets, we treat shorter median waiting time and median LOS as positive outcomes. QMSI had a positive and statistically significant effect on both the ED performance measures. For every unit increase in QMSI score, which has a possible range of 0–24, the median waiting time decreased by 1.4 min and the median LOS decreased by 2.3 min. QMCI had a negative and statistically significant effect on median LOS after adjusting for QMSI; for every unit increase in QMCI score, which has a possible range of 0–8, the median LOS increased by 4.7 min. PSS, with a possible range of 0–4, had a negative and statistically significant effect on both the ED performance measures after adjusting for the three organization measures. For every unit increase in PSS score, the median waiting time increased by 5 min and the median LOS increased by 18 min. TC had statistically significant effect on both the performance measures after adjusting for the three organization and the four pathway measures. For every unit increase in TC score (0–100 range), the median waiting time decreased by 0.3 min, and the median LOS increased by 0.9 min; returned to its original scale of 1–5 (so that a one-unit change is equivalent to that of the PSS measure), a one-unit change in TC was associated with an 8-min decrease in waiting time and a 23-min increase in length of stay. SC had a positive and statistically significant effect on both performance measures, after adjusting for the three organization and four pathway measures. For every unit increase in SC score (0–100 range), the median waiting time decreased by 0.3 min; and the median LOS decreased by 1.1 min; returned to its original five-point scale, a one-unit change in SC was equivalent to a 7-min decrease in waiting time and a 28-min decrease in LOS.
Associations of ED performance measures with hospital, ED and clinician level measures
| Median waiting time | Median length of stay | |||||
|---|---|---|---|---|---|---|
| Predictor | N | Beta (95% CI) | P-value | N | Beta (95% CI) | P-value |
| QMSIa | 160 | −1.373 (−1.815, −.931) | 0.000* | 160 | −2.326 (−3.936, −.716) | 0.005* |
| QMCIa,b | 160 | 0.218 (−1.055, 1.492) | 0.737 | 160 | 4.655 (0.103, 9.207) | 0.045* |
| CQIIa,b,c | 160 | −0.287 (−0.835, 0.260) | 0.304 | 160 | 0.743 (−1.235, 2.721) | 0.461 |
| SERa,b,c,d | 160 | −0.440 (−2.335, 1.456) | 0.649 | 160 | −5.658 (−12.43, 1.112) | 0.101 |
| EBOPa,b,c,d | 160 | −1.017 (−4.090, 2.055) | 0.516 | 160 | −7.941 (−18.92, 3.036) | 0.156 |
| PSSa,b,c,d | 160 | 4.935 (1.405, 8.465) | 0.006* | 160 | 17.620 (4.881, 30.36) | 0.007* |
| CRa,b,c,d | 160 | 0.019 (−1.216, 1.255) | 0.975 | 160 | −1.471 (−5.915, 2.973) | 0.517 |
| TCa,b,c,d,e,f,g,h | 145 | −0.329 (−0.540, −.117) | 0.002* | 145 | 0.913 (0.118, 1.708) | 0.024* |
| SCa,b,c,d,e,f,g,h | 145 | −0.288 (−0.510, −.066) | 0.011* | 145 | −1.134 (−1.953, −.314) | 0.007* |
| La,b,c,d,e,f,g,h | 145 | −0.211 (−0.428, 0.006) | 0.056 | 145 | 0.091 (−0.724, 0.906) | 0.827 |
Legend: QMSI (Index 0–24), QMCI (Index 0–8), CQII (Index 0–28), SER (Index 0–4), EBOP (Index 0–4), PSS (Index 0–4), CR (Index 0–4), TC (Index 0–100), SC (Index 0–100), Leadership (Index 0–100).
aAdjusted for hospital peer group and triage category.
b–dAdditionally adjusted for: bQMSI; cQMCI; dCQII; eSER; fEBOP; gPSS; and hCR.
*Statistically significant at 5%.
Discussion
Across all hospitals, both the median waiting time for triage category, and LOS, met performance targets. We found seven statistically significant associations between organization-level quality systems and ED-level quality strategies; four statistically significant associations between quality systems and strategies and ED clinician safety culture and leadership; and nine statistically significant associations between quality systems and strategies, ED safety culture and leadership and ED performance. While statistically significant, however, in some cases the size of the effect was small. A greater number of significant associations were found between organization-level measures and ED-level measures than were found for AMI, hip fracture and stroke departments [22]. One possible explanation lies in the hospital-wide focus on the movement of patients as hospital demand for beds increases, and the degree to which the ED is integral to patient flow through the hospital.
We found that by increasing hospital-level quality strategies, ED specialized expertise and responsibility, evidence-based organization of pathways and patient safety strategies also increase. This supports our conjecture that, for the ED, the executives’ values, perceptions and operationalization of health and safety strategies flow down and influence how safety is practiced in the department. If the hospital executives do not value and put time into safety strategies, then the underlying message to the wards is that it is not valued and, therefore, does not get done. This is an important finding for the ED, as continued focus on attending to time-based measures of performance tells the system that time is the most important measure, so tasks are at risk of being performed with time in mind rather than quality of care.
One of the most interesting negative associations, and one which reinforces this conjecture, was that the median waiting time increased by 5 min and the median LOS increased by 18 min for every unit increase in PSS score (range 0–4). Examples of patient safety strategies that comprise the PSS include identifying patients by bracelet, providing readily accessible hand sanitizer and sharps disposal boxes at the point of patient care, ensuring each emergency crash cart has a completed checklist of equipment and supplies, and providing a system to report clinical incidents (adverse events). These specific activities are a general measure of an underlying construct relating to commitment to patient safety, which is associated with greater LOS. While we know that implementation strategies such as these take time, we now have data that shows attention to patient safety items can be translated to longer waits for treatment and longer stays in the ED. This finding highlights the need for measures that place emphasis on or prioritize quality of care rather than being solely time based—in order to provide a richer understanding of how an ED is performing.
There were also significant associations between TC, SC and ED waiting time and LOS performance. A one-unit change in TC (range 0–5) was associated with a 9-min decrease in waiting time and a 23-min increase in length of stay. This result implies that, with better communication and teamwork, patients are seen quicker but spend longer in the department. There is potential for the increased LOS to be explained by greater attention to care: we know that communication and therefore teamwork takes time—especially if the team member is a phone call away, as is often the case for treatment in an ED. Teamwork and patient safety are related [23, 24], hence longer stays for improved teamwork also aligns with our finding that patient safety strategies are associated with longer stays. Further research is required to better understand this finding.
A one-unit change in SC (range 0–5) was equivalent to a 7-min decrease in waiting time and a 28-min decrease in LOS. These results are not surprising (except perhaps in their magnitude) as SC covers aspects, such as sufficient staffing to handle the number of patients, which are vital for EDs to function effectively.
Of note was the number of self-identified leaders that participated in our study (61% in the ED). Perhaps it is not surprising that self-identified leaders are more likely to be interested in participating in research about the performance of the ED and, therefore, self-select into our study. Within an ED, formally appointed leaders are also more likely to be able to find time to participate. While participation of a large proportion of self-identified leaders had potential to introduce selection bias [25], we asked the same questions of leaders and non-leaders in regard to safety culture and leadership. Additionally, we did not find a statistically significant difference in responses between clinicians and clinician-leaders.
Limitations
The DUQuA QMSI and clinician safety culture and leadership scales are based on self-reported data. In mitigation, both scales have been validated [18, 19], and the QMCI and CQII scales are based on external audit of hospital quality processes. There was limited variation in the hospital-level characteristics, and we had unequal numbers of clinicians participating. In addition, we had substantially fewer participating hospitals than the DUQuE study and this limits our statistical power to detect smaller associations, especially when controlling for the multiple factors specified in the DAG. While we assumed (based on other large-scale studies) [26] that characteristics associated with our measures would be relatively stable over time, it should be noted that some measures were collected over a 2-year period. In addition, patient flow measures were collected before safety culture and leadership measures, so it is possible that a change in leadership after patient outcomes were collected may have influenced our results.
The low reliability of the SER and PSS scales, discussed in another paper in this Supplement [18], has potential implications for the current findings, as the low reliability can be interpreted as random measurement error. Where SER and PSS were the exposure variables of interest, the statistical significance of associations (i.e. with clinician scales and ED waiting time and length of stay) are likely to be systematically underestimated by an unknown amount. Random measurement error in SER and PSS considered as covariates, however, has unpredictable impacts on the assessment of other associations (i.e. may either increase or decrease the statistical significance); the statistical significance of associations between clinician scales and ED waiting time and length of stay, which adjust for SER and PSS, should therefore be interpreted with caution.
Implications for research, policy and practice
After nearly 10 years of NEAT, ETP and the 4-hour rule and multiple models of care to address patient flow to reduce overcrowding, it is not enough that EDs do not operate in isolation. This study shows that the hospital-level quality structures affect the delivery of urgent care in the ED. Therefore, future strategies and policies to address patient flow in EDs need to be implemented at the organization level as ED performance is a hospital-wide issue. The study also has implications for the measurement and interpretation of ED performance. Current time-based measures are influenced by patient safety strategies. As such, prioritization of other measures of ED performance are needed to give a complete picture of performance, otherwise we put patient safety at risk by biasing our measures to time.
The findings also have practical significance for training. Implementation of Crew Resource Management-based teamwork training in EDs, for example, has been shown to increase SAQ TC scores by more than one point (on a scale of 1–5), when scores were measured prior to and 8 months following completion of training [27]. Our findings suggest that time spent in training is time saved in practice.
Conclusions
Hospital quality structures influence ED quality strategies and, ultimately, waiting time and length of stay for patients. By focusing on time-based measures, we risk punishing EDs that perform well on patient safety measures. There is a need for organizations to recognize the trade-offs required to meet patient safety standards and that this should be considered when judging performance. Further research is needed to better understand the relationships between quality strategies and patient flow in the ED, and to develop more suitable ED performance measures. In the interim, there is a need for EDs to adopt creative approaches to ensuring waiting times meet standards while adequate safety and quality activities are maintained.
Acknowledgements
Members of the original DUQuE team (Oliver Gröne, Rosa Suñol) provided extensive input and advice in the initial stages of the project, supporting design modifications from DUQuE and the planned DUQuA study approach. Dr Annette Pantle provided expert advice on revision and development of DUQuA measures, and Professor Sandy Middleton, Associate Professor Dominique Cadillac, Kelvin Hill, Dr Carmel Crock, and Professor Jacqueline Close provided input into the development of our stroke, AMI, and hip fracture clinical process indicator lists. Nicole Mealing and Victoria Pye provided statistical advice in the initial phases of the project. We greatly appreciate their efforts.
Funding
This research was funded by National Health and Medical Research Council (NHMRC) Program Grant APP1054146 (CI Braithwaite).
Authors’ contributions
The research team consists of experienced researchers, clinicians, biostatisticians and project managers with expertise in health services research, survey design, and validation, large-scale research and project management, sophisticated statistical analysis, quality improvement and assessment, accreditation, clinical indicators, policy and patient experience. JB conceived the idea, led the research grant to fund the project and chairs the steering committee. RCW and NT co-led the detailed study design, managed the project across time and contributed to the development of the manuscript. EA assisted in data interpretation, and contributed to development of the manuscript. HPT and GA provided statistical expertise for the study design and developed the analysis plan for the manuscript. TW contributed to the logistics of project management, the refinement of measures and the development of the manuscript.
Ethics approval
Ethical approvals were secured from State and Territory human research ethics committees in New South Wales (#14/206), Victoria (#15/36), the Australian Capital Territory (#15/131), South Australia (#15/260), the National Territory (#15–2509), Tasmania (#H0015383) and Queensland (#15/361). Site-specific authorizations, including permission for external researchers to collect data in hospitals, were granted. We complied with confidentiality requirements of national legislation or standards of practice of each jurisdiction. Separate ethics approval was provided by the AIHW (#EO2017/2/315), for patient-level hospital data.
Data sharing statement
Data will be made publicly available to the extent that individual participants or participating hospitals cannot be identified, in accordance with requirements of the approving Human Research Ethics Committees.
