


Abstract
This study aimed to refine and validate a tool to measure safety culture and leadership in Australian hospitals.
The clinician safety culture and leadership questionnaire was constructed by combining and refining the following two previously validated scales: Safety Attitudes Questionnaire and the Leadership Effectiveness Survey. Statistical processes were used to explore the factor structure, reliability, validity and descriptive statistics of the new instrument.
Thirty-two large Australian public hospitals.
1382 clinicians (doctors, nurses and allied health professionals).
Descriptive statistics, structure and validity of clinician safety culture and leadership scale.
We received 1334 valid responses from participants. The distribution of ratings was left-skewed, with a small ceiling effect, meaning that scores were clustered toward the high end of the scale. Using confirmatory factor analysis, we confirmed the structure of the three scales as a combined measure of safety culture and leadership. The data were divided into equal calibration and validation datasets. For the calibration dataset, the Chi-square: df ratio was 4.4, the root mean square error of approximation RMSEA (a measure of spread of the data) was 0.071, the standardized root mean square residual SRMR (an absolute measure of the fit of the data) was 0.058 and the Confirmatory Fit Index (CFI) (another test confirming the fit of the data) was 0.82; while none of the indices suggested good fit, all but CFI fell within acceptable thresholds. All factors demonstrated adequate internal consistency and construct reliability, as desired. All three domains achieved discriminant validity through cross-loadings, meaning that the three domains were determined to be independent constructs. Results for the validation dataset were effectively identical to those found in the calibration dataset.
While the model may benefit from additional refinement, we have validated the tool for measuring clinician safety culture and leadership in our Australian sample. The DUQuA safety culture and leadership scale can be used by Australian hospitals to assess clinician safety culture and leadership, and is readily modifiable for other health systems depending on their needs.
Introduction
There is a growing body of evidence linking hospital safety culture with improved patient outcomes [1, 2] and hospital performance [3]. The terms ‘safety culture’ and ‘safety climate’ are often used interchangeably in healthcare [4]; however, if we think of ‘safety climate’ as the perceived value placed on safety within an organization [5], then there are additional dimensions comprising safety culture that include leadership and teamwork [4]. In this framing, a safety culture that contributes to high hospital performance can depend on the combination of a positive safety climate [6], the level of teamwork demonstrated by clinicians [7–9] and effective leadership within the organization [10].
Over the last decade, a number of systematic reviews have reported the development and psychometric properties of a variety of instruments available to assess different aspects of patient safety climate [4, 11–13]. Of the reviewed instruments, the Safety Attitudes Questionnaire (SAQ) [14] is the most commonly used survey tool to assess healthcare workers’ perceptions of patient safety related attitudes in various clinical areas and healthcare settings.
There are many versions of the SAQ, including adaptations of the survey for the Intensive Care Unit [15], surgery [16], Emergency Department (ED) [17], pharmacies [18], ambulatory care [19] and so on. Although varieties of the SAQ can include up to 60 items, a minimum of 30 items is required to assess all six subdomains as follows: teamwork climate (six items), safety climate (seven items), job satisfaction (five items), stress recognition (four items), perceptions of management (four items) and working conditions (four items) [14]. A common version, recommended by the University of Texas where the tool originated, is the Safety Climate questionnaire [20], which consists of 27 items, but measures only two domains—14 items under teamwork climate and 13 items under safety climate. Despite the name, the Safety Climate version includes two of the four questions that comprise the perceptions of management domain from the full 60-item SAQ: the quality of collaboration with other clinical professionals; and the importance of briefing and other communication during handover and shift change, which we believe from the literature to be important for safe care [21, 22].
To measure safety culture in participating hospitals for the Deepening our Understanding of Quality in Australia (DUQuA) study [23], we sought a valid and reliable tool that measured safety culture across the components of teamwork, safety climate and leadership in healthcare. In particular, we needed a measurement instrument that was easy to administer and broadly applicable across a variety of hospital settings. Clinicians in Australian hospitals are already heavily burdened with requests to complete surveys (both mandatory and voluntary). Furthermore, hospital work can be piecemeal, with frequent interruptions [24, 25]. In EDs, for example, clinicians are interrupted on average 6.6 times/h, and when interrupted failed to return to 18.5% of interrupted tasks [25]. Other studies have shown interruptions and multitasking to be prevalent throughout the hospital [24]. Therefore, we needed a questionnaire that could be completed quickly in a single sitting. Although we found an abundance of tools to measure safety culture, teamwork and leadership, we did not find any instrument where all three aspects were measured using a single survey. This paper reports on the development and validation of a tool to measure safety culture and leadership in Australian hospitals.
Method
Participants
DUQuA used purposive sampling. Clinicians were recruited from participating DUQuA hospitals in New South Wales, Victoria, Northern Territory, Queensland, South Australia, Tasmania and the Australian Capital Territory. Local Principal Investigators in each hospital informed the department head and/or clinical leaders and clinical staff on participating wards about the study and invited them to participate in the research through email, workshops and/or meetings and verbal conversations. Participating departments included the ED and departments treating acute myocardial infarction (AMI), stroke and hip fracture. Doctors, nurses or allied health professionals practising in participating departments at least 50% of their work time were eligible to participate. Participants could complete the survey electronically or on paper.
Measures
As with the development of the other scales used in DUQuA, we consulted with lead researchers on the equivalent scale used in the Deepening our Understanding of Quality improvement in Europe (DUQuE) study. In DUQuE [26, 27], teamwork and safety climate were measured using the Teamwork (six items) and Safety Climate (seven items) domains from the SAQ [14]. The composite scale reliability for the SAQ has been reported as 0.90 (Raykov’s ρ coefficient), indicating strong reliability [14]. For the DUQuA safety culture measure, we adopted the Australian version of the SAQ [28], but rather than just the 13 questions comprising the safety climate and teamwork climate domains of the SAQ, we used the full 27-item Safety Climate survey. Within this survey, teamwork climate measures interdisciplinary support and collaboration. Safety climate measures clinician and institutional response to error. As this version includes two of the four items from the perceptions of management domain, we added the other two to provide a partial assessment of leadership. To provide a more comprehensive assessment of leadership, we also added Shipton et al.’s [29] six-item Leadership Effectiveness Scale (LES). The LES was validated in a survey of ~18,000 employees of the UK National Health Service (Cronbach’s α = 0.92) [29], which measures staff perceptions of the vision, inclusiveness and internal and external collaborative behaviours of healthcare leaders. Higher scores on the LES have been associated with higher hospital performance and fewer patient complaints [29]. All items were combined into one 35-item DUQuA Safety Culture and Leadership questionnaire, consisting of three factors: teamwork climate (n = 14 items), safety climate (n = 13) and leadership (n = 8).
The 35-item Safety Culture and Leadership Questionnaire (Figure 1) was used to measure the following three domains: perceived quality of collaborating between clinicians; organizational commitment to patient safety and management style and the effectiveness of healthcare leaders in their workplace. Each item was scored by clinicians on a five-point Likert scale ranging from 1 (strongly disagree) to 5 (strongly agree).
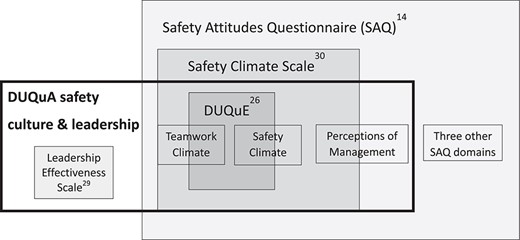
Composition of the DUQuA safety culture and leadership questionnaire.
Data analysis
Data were analysed in IBM SPSS Amos 25, IBM SPSS Statistics 25 (both Armonk, New York, USA) and SAS/STAT 9.4 (Cary, North Carolina, USA). Demographic characteristics of the clinicians were analysed and the scores of the items and domains were calculated. Scores on negatively-worded items were first reversed and item scores were rescaled from a one to five-point scale to a zero to 100-point scale, as per published procedures for analysing the SAQ [30]. Observations with any factor with >50% missing items were deleted. Missing items were examined using Little’s test [31], i.e. a non-significant test result indicates data are missing completely at random (MCAR); a significant test result indicates that data are not MCAR and leads to visual examination of the data to determine if the missingness pattern indicates that data are missing at random (MAR) or missing not at random (MNAR). Imputation using the Expectation-Maximization (EM) method assumes that the missing data pattern is at least MAR [32]. Domain scores were calculated as the mean score of the items that made up that domain.
The sample was randomly split into halves. Confirmatory factor analysis (CFA) was used to test the three-domain theoretical framework with the calibration sample and reassessed in the validation sample. CFA determines how well the items represent the domains in our safety culture and leadership questionnaire. Maximum likelihood estimation was used to perform CFA [33]. This method assumes multivariate normality, which was assessed using Mardia’s coefficients of multivariate skewness and kurtosis, with statistically significant results for these tests indicating non-normality. In the event of multivariate non-normality, appropriate transformations were attempted.
To assess convergent validity (whether the items in the scale load onto the intended factor), we followed guidance from a review by Hooper et al. [34]. We used three recommended absolute fit indices (Chi-square score, root mean square error of approximation [RMSEA] and standardized root mean squared residual [SRMR]) and one incremental fit index (comparative fit index [CFI]) to assess model fit [35]. Absolute fit indices compare a pre-specified model to no model, while incremental fit indices compare the pre-specified model to a model where all items are uncorrelated (a worst case). Each of the indices has strengths and weaknesses.
First, we consider the absolute fit indices, all of which assess different measures of the differences between the sample data and the hypothesized model. A statistically significant Chi-square statistic (P <0.05) indicates poor model fit. As the chi-square statistic is routinely statistically significant with large sample sizes, we added the Chi-square:degrees of freedom (df) ratio, which is insensitive to sample size, with a desirable value <2 [36], but with values of <5 considered acceptable [37]. Chi-square is also sensitive to non-normality, leading to higher scores even when the model is appropriately specified [38]. The calculation of RMSEA includes the chi-square score, the df and the sample size; while RMSEA calculation controls for large sample size, inflation of the chi-square statistic due to non-normality can lead to higher values. RMSEA <~0.06 [39] has been suggested as indicating a good fit, but lower thresholds of <0.08 [40] have also been proposed. SRMR compares the observed and hypothesized models and is sensitive to small sample size; good fitting models of SRMR have values of <0.05 [41, 42], with values <0.08 deemed acceptable [39].
The sole incremental fit index, CFI assesses the Chi-square (adjusted for df) as a ratio of the target to the null model [43]. In a simulation study, CFI appears to be most resilient to deviations from normality and it is known to be robust to small sample size [44]. A CFI of 0.95 or above is considered a good fit, but earlier recommendations suggested >0.90 is acceptable [39].
The thresholds used to assist with assessing model fit for convergent validity, as a signal for a possible need for model review were: Chi-square:df >2 [37], CFI <0.95, RMSEA >0.06 and SRMR >0.05. Where model review was indicated, modification was guided by modification indices, factor loadings and multiple R-squared. Items with factor loading of <0.32 [36] and multiple R-square <0.2 [34] were considered for deletion or model respecification, with the decision to modify principally guided by theoretical considerations.
To assess internal consistency reliability (whether individual subscale items demonstrate good relationships with one another), Cronbach’s α and construct reliability were used. Cronbach’s α of >0.8 [45] was used to indicate adequate internal consistency, and construct reliability of >0.6 [46, 47] was considered adequate. To assess discriminant validity (whether theoretically different subscales are distinguishable from one another), we used cross-loadings; each item’s factor loadings on the assigned construct should be higher than loading on any other constructs [48].
Results
Questionnaire forms were received from 1382 clinicians. A total of 48 responses (3.5%) were excluded due to insufficient data. Each participating department (n = 120, comprising 32 ED, 27 AMI, 29 hip fracture and 32 stroke) was expected to undertake 30 clinician assessments (i.e. 3600 in total).
Characteristics of the participants
Characteristics of the participants are summarized in Table 1. There were 1334 valid responses (37.1% of target) from 31 hospitals. Responses were received from 25 departments that treated AMI patients (n = 309 participants); 26 departments treating hip fracture (n = 307); 25 departments treating stroke (n = 324) and 29 EDs (n = 394). Almost half of the participants were under 35 years old and 61% were female. The majority of the participants were either a physician (38%) or nurse (52%), and almost half identified themselves as leaders.
Summary of clinician characteristics
| Characteristic | n | Percent (%) |
|---|---|---|
| Gender | ||
| Male | 517 | 38.8 |
| Female | 817 | 61.2 |
| Age group (years) | ||
| 18–24 | 105 | 7.9 |
| 25–34 | 524 | 39.3 |
| 35–44 | 323 | 24.2 |
| 45–54 | 246 | 18.4 |
| 55–64 | 118 | 8.8 |
| 65–74 | 18 | 1.3 |
| Leader | ||
| Yes | 631 | 47.3 |
| No | 703 | 52.7 |
| Profession | ||
| Physician | 511 | 38.3 |
| Nurse | 695 | 52.1 |
| Allied Health | 128 | 9.6 |
| Department | ||
| AMI | 309 | 23.2 |
| Hip Fracture | 307 | 23.0 |
| Stroke | 324 | 24.3 |
| ED | 394 | 29.5 |
Missing data
Out of the 1334 valid responses, the percentage of missing data was 0.5% (range = 0–1.4% per item). Little’s MCAR test [31] was significant (P-value <0.001), indicating data were potentially not MCAR; however, visual inspection of missing data patterns suggested the data were MAR, permitting imputation.
Descriptive statistics
The descriptive statistics of the factor and item scores are summarized in Table 2. The mean for the 35 items ranged from 57.4 to 87.3. The mean domain scores were 78.9 for teamwork climate, 71.7 for safety climate and 67.9 for leadership. Item distributions were mostly left-skewed and kurtotic, resulting in significant variation from multivariate normality (both Mardia’s coefficients of multivariate skewness and kurtosis had P <0.001). Transformations were attempted but did not achieve multivariate normality.
Descriptive statistics of domain and item scores
| Factor and items | n | Mean | SD | Median | Min | Max | Floora(%) | Ceilinga(%) |
|---|---|---|---|---|---|---|---|---|
| Teamwork climate | 1237 | 78.9 | 12.57 | 80.4 | 17.9 | 100 | ||
| Q95.1 Nurse input (defined as the views and suggestions about patient care made by nurses) is well received in my clinical area | 1322 | 83.4 | 19.28 | 75 | 0 | 100 | 1 | 48 |
| Q95.2 In my clinical area, it is difficult to speak up if I perceive a problem with patient careb | 1321 | 79.1 | 25.07 | 75 | 0 | 100 | 2 | 45 |
| Q95.3 Decision-making in my clinical area utilizes input from relevant staff | 1324 | 83.5 | 19.61 | 75 | 0 | 100 | 1 | 48 |
| Q95.4 The staff in my department work together as a well-coordinated team | 1321 | 84.3 | 19.75 | 100 | 0 | 100 | 1 | 51 |
| Q95.5 Disagreements in my clinical area are resolved appropriately (i.e. not who is right but what is best for the patient) | 1325 | 75.9 | 22.21 | 75 | 0 | 100 | 2 | 32 |
| Q95.6 I am frequently unable to express disagreement with senior staffb | 1327 | 69.1 | 28.77 | 75 | 0 | 100 | 4 | 31 |
| Q95.7 It is easy for staff here to ask questions when there is something that they do not understand. | 1326 | 85.8 | 19.58 | 100 | 0 | 100 | 1 | 56 |
| Q95.8 I have the support I need from other staff to care for patients | 1327 | 84.7 | 19.11 | 100 | 0 | 100 | 1 | 51 |
| Q95.9 I know the first and last names of all the staff I worked with during my last shift | 1325 | 58.8 | 35.44 | 75 | 0 | 100 | 14 | 27 |
| Q95.10 Important issues are well communicated at shift changes | 1316 | 74.1 | 21.31 | 75 | 0 | 100 | 1 | 26 |
| Q95.11 Briefing staff before the start of a shift (i.e. to plan for possible contingencies) is important for patient safety | 1328 | 87.3 | 19.09 | 100 | 0 | 100 | 1 | 62 |
| Q95.12 Briefings are common in my clinical area | 1329 | 75.8 | 24.78 | 75 | 0 | 100 | 2 | 37 |
| Q95.13 I am satisfied with the quality of collaboration that I experience with doctors in my clinical area | 1332 | 77.1 | 22.36 | 75 | 0 | 100 | 1 | 34 |
| Q95.14 I am satisfied with the quality of collaboration that I experience with nurses in my clinical area | 1331 | 83.1 | 17.85 | 75 | 0 | 100 | 0 | 44 |
| Safety climate | 1251 | 71.7 | 13.91 | 73.1 | 17.3 | 100 | ||
| Q96.1 The levels of staffing in my clinical area are sufficient to handle the number of patients | 1328 | 57.4 | 30.98 | 75 | 0 | 100 | 11 | 16 |
| Q96.2 I would feel safe being treated here as a patient | 1325 | 76.9 | 23.36 | 75 | 0 | 100 | 2 | 37 |
| Q96.3 I am encouraged by my colleagues to report any patient safety concerns I may have | 1325 | 83.7 | 19.10 | 75 | 0 | 100 | 1 | 49 |
| Q96.4 Staff frequently disregard rules or guidelines (e.g. handwashing, treatment protocols/clinical pathway, sterile field, etc.) that are established for my clinical areab | 1325 | 74.3 | 27.00 | 75 | 0 | 100 | 3 | 38 |
| Q96.5 The culture in my clinical area makes it easy to learn from the errors of others | 1333 | 69.7 | 22.51 | 75 | 0 | 100 | 3 | 19 |
| Q96.6 I receive appropriate feedback about my performance | 1326 | 69.7 | 25.10 | 75 | 0 | 100 | 3 | 24 |
| Q96.7 Medical errors are handled appropriately here | 1330 | 77.7 | 21.01 | 75 | 0 | 100 | 1 | 35 |
| Q96.8 I know the proper channels to direct questions regarding patient safety in my clinical area | 1330 | 82.6 | 18.49 | 75 | 0 | 100 | 1 | 43 |
| Q96.9 In my clinical area, it is difficult to discuss errorsb | 1327 | 72.9 | 26.45 | 75 | 0 | 100 | 3 | 33 |
| Q96.10 Hospital management does not knowingly compromise the safety of patients | 1323 | 67.3 | 29.36 | 75 | 0 | 100 | 6 | 30 |
| Q96.11 The hospital is doing more for patient safety now, than it did one year ago | 1317 | 62.9 | 23.48 | 50 | 0 | 100 | 3 | 15 |
| Q96.12 Leadership is driving us to be a safety-centred hospital | 1329 | 68.5 | 23.27 | 75 | 0 | 100 | 2 | 21 |
| Q96.13 My suggestions about safety would be acted upon if I expressed them to management | 1326 | 66.8 | 24.56 | 75 | 0 | 100 | 3 | 20 |
| Leadership | 1313 | 67.9 | 19.09 | 68.8 | 0 | 100 | ||
| Q97.1 Hospital administration supports my daily efforts | 1330 | 61.0 | 25.75 | 75 | 0 | 100 | 5 | 14 |
| Q97.2 I am provided with adequate, timely information about events in the hospital that might affect my work | 1329 | 65.8 | 24.47 | 75 | 0 | 100 | 3 | 17 |
| Q97.3 The leadership team in my department describes exciting new opportunities for the organization | 1331 | 66.9 | 24.23 | 75 | 0 | 100 | 3 | 19 |
| Q97.4 The leadership team in my department proposes new and creative ideas for improving services or processes | 1331 | 69.4 | 23.78 | 75 | 0 | 100 | 3 | 22 |
| Q97.5 The leadership team in my department is effectively leading the organization to meet patient needs and care for patient safety | 1334 | 74.6 | 22.05 | 75 | 0 | 100 | 2 | 28 |
| Q97.6 The leadership team in my department takes account of both service requirements and staff needs when implementing major changes | 1330 | 69.3 | 24.41 | 75 | 0 | 100 | 3 | 22 |
| Q97.7 The leadership team in my department builds strong and positive relationships with the community | 1332 | 67.2 | 23.19 | 75 | 0 | 100 | 2 | 19 |
| Q97.8 The leadership team in my department builds strong, co-operative links with other organizations | 1332 | 68.2 | 22.43 | 75 | 0 | 100 | 2 | 19 |
aThe % floor/ceiling represents the percentage of all records with the lowest/highest score possible.
bNegatively-worded item; the score has been reversed.
Safety Culture and Leadership scale: structure and validity
Calibration dataset
We used CFA to confirm the structure for the three scales as a combined measure of safety culture and leadership. Only one item failed to meet our preferred criteria: item Q95.9 ‘I know the first and last names of all the staff I worked with during my last shift’ had factor loading <0.32 and multiple R-squared <0.2. The item was considered for deletion, but retained as deletion of the item did not significantly improve the model fit indices and it did not make theoretical sense to respecify the item in the model, as it has been part of the SAQ, and its antecedent the Flight Management Attitudes Questionnaire (FMAQ), for over two decades (note: the SAQ version was derived from the FMAQ item ‘working here is like being part of a large family’) [49]. We, therefore, retained the pre-specified theoretical model.
Table 3 summarizes the key model fit statistics in the calibration dataset. The Chi-square P-value was <0.001, the Chi-square/df ratio was 4.4, the CFI was 0.82 and RMSEA was 0.07 and the SRMR was 0.06; except for CFI, all model fit indices were within the acceptable target. Convergent validity measures are shown in Table 4. All factors demonstrated adequate internal consistency and construct reliability. All three pairs of domains achieved discriminant validity through cross-loadings (Supplement eTable A1).
Final model fit statistics on calibration and validation dataset
| Preferred target | Acceptable target | Calibration n = 667 | Validation n = 667 | |
|---|---|---|---|---|
| Chi-square | NA | NA | 2433.7 | 2461.7 |
| DF | NA | NA | 557 | 557 |
| P-value | >0.05 | NA | <0.001 | <0.001 |
| CMIN/DF | <2 | <5 | 4.4 | 4.4 |
| RMSEA | <~ 0.06 | ≤0.08 | 0.071 | 0.072 |
| SRMR | <0.05 | ≤0.08 | 0.058 | 0.062 |
| CFI | >0.95 | >0.9 | 0.82 | 0.81 |
NA, Not applicable.
Convergent validity measures on calibration and validation dataset
| Calibration | Validation | |||
|---|---|---|---|---|
| Factor | Construct reliability | Cronbach’s α | Construct reliability | Cronbach’s α |
| Teamwork climate | 0.86 | 0.83 | 0.85 | 0.82 |
| Safety climate | 0.84 | 0.83 | 0.84 | 0.82 |
| Leadership | 0.92 | 0.92 | 0.92 | 0.92 |
| Calibration | Validation | |||
|---|---|---|---|---|
| Factor | Construct reliability | Cronbach’s α | Construct reliability | Cronbach’s α |
| Teamwork climate | 0.86 | 0.83 | 0.85 | 0.82 |
| Safety climate | 0.84 | 0.83 | 0.84 | 0.82 |
| Leadership | 0.92 | 0.92 | 0.92 | 0.92 |
Validation dataset
The final model (eFigure A1) is reported in eTable A1. Fit statistics are shown detailed in Table 3; the results are effectively identical to those found in the calibration dataset, with all model fit indices except for CFI met the acceptable range. The convergent reliability statistics are detailed in Table 4 with, once again, virtually identical results. All domain pairs achieved discriminant validity through cross-loadings (eTable A2).
Discussion
Interpretation of results
We sought to refine and validate a tool to measure teamwork climate, safety climate and leadership in Australian hospitals. Our tool was developed from a strong theoretical base, informed by the evidence underpinning the SAQ and LES surveys from which it was derived.
While, in our sample, we found the distribution of ratings to be asymmetrical, and skewed toward higher scores, it is a common occurrence for SAQ data in healthcare to be distributed this way. Previous studies [44, 50, 51] have shown that multivariate non-normality such as this leads to higher Chi-square and RMSEA scores, even when the models were correctly specified, potentially explaining the failure to meet the desired thresholds for chi-square and RMSEA in our study. The CFI indices (0.82–0.83) were lower than the preferred threshold (>0.95) and acceptable range (>0.90). The other indices were all outside the preferred threshold for good fit, but within the acceptable range: chi-square:df ratio <5; RMSEA <0.08; and SRMR <0.08.
In addition, the domains of the proposed 35-item combined scale showed good convergent validity, as consistently demonstrated by construct reliability and Cronbach’s α. Item cross-loadings consistently placed the questions in the domains specified in the pre-specified theoretical model. Although the model may benefit from additional refinement, we found the model to be adequate to assess clinician safety culture and leadership for DUQuA.
We were able to compare our DUQuA findings with those from DUQuE and also from a previous South Australian SAQ study [28], by calculating aggregated scores for the three SAQ domains of teamwork climate (six items), safety climate (seven items) and perceptions of management (four items): see Table 5. While there is some variation, the scores for teamwork climate, safety climate and perceptions of management are broadly comparable across the three studies. This aligns with other research on the SAQ, which has found variation within countries to be higher than variation between countries for the SAQ [14, 52].
SAQ component comparison with other studies
SAQ component comparison with other studies
Limitations
The DUQuA safety culture and leadership scale is based on self-reported data, with its inherent limitations. While we have shown the genesis of the scale, and its development from the internationally validated SAQ and LESs, the DUQuA version of this scale has only been validated for the Australian context. Differences between the DUQuA and DUQuE scales must be taken into account when comparing findings from Australian and European hospitals. While our final scale consists of 35 items, it assesses both safety culture and leadership in one instrument; additionally, we found it took clinicians only 5–10 min to complete.
Implications for research, policy and practice
It can be difficult for hospitals to access validated measurement tools for assessing healthcare safety culture that are powerful, yet easy to use. This leads to a variety of unvalidated tools being used in healthcare, making results difficult to interpret and to compare. In contrast, and as a consequence of our assessment, we are aware of the statistical limitations of the DUQuA clinician safety culture and leadership tool, and hence we have direction for its targeted refinement. Furthermore, whereas there are a number of tools validated for healthcare that measure safety culture [4, 11, 12, 53] and teamwork [13], ours is the first we are aware of the combines safety culture and leadership into one short survey. The scales could be used to collect longitudinal data to assess change over time, to select the focus for an intervention, to assess change associated with an intervention, or used as part of a comparison of hospitals or hospital departments.
Conclusions
The DUQuA safety culture and leadership scale is available to assist hospital managers to measure and improve safety culture at organizational and departmental levels within their hospitals. The tool is modifiable for other healthcare organizations and systems, depending on their needs.
Acknowledgements
Members of the original DUQuE team (Oliver Gröne, Rosa Suñol) provided extensive input and advice in the initial stages of the project, supporting design modifications from DUQuE and the planned DUQuA study approach. Dr Annette Pantle provided expert advice on revision and development of DUQuA measures, and Professor Sandy Middleton, Associate Professor Dominique Cadillac, Kelvin Hill, Dr Carmel Crock and Professor Jacqueline Close provided input into the development of our stroke, AMI and hip fracture clinical process indicator lists. Nicole Mealing and Victoria Pye provided statistical advice in the initial phases of the project. We greatly appreciate theirefforts.
Funding
This research was funded by National Health and Medical Research Council (NHMRC) Program Grant APP1054146 (CI Braithwaite).
Contributions
The research team consists of experienced researchers, clinicians, biostatisticians and project managers with expertise in health services research, survey design and validation; large-scale research and project management, sophisticated statistical analysis, quality improvement and assessment, accreditation, clinical indicators, policy and patient experience. JB conceived the idea, led the research grant to fund the project, and chairs the steering committee. RCW and NT co-led the detailed study design, managed the project across time and contributed to the development of the manuscript. HPT and GA provided statistical expertise for the study design and developed the analysis plan for the manuscript. TW contributed to the logistics of project management, the refinement of measures and the development of the manuscript.
Ethics approval
Ethical approvals were secured from State and Territory human research ethics committees in New South Wales (#14/206), Victoria (#15/36), the Australian Capital Territory (#15/131), South Australia (#15/260), the National Territory (#15–2509), Tasmania (#H0015383) and Queensland (#15/361). We complied with confidentiality requirements of national legislation or standards of practice of each jurisdiction.
Data-sharing statement
Data will be made publicly available to the extent that individual participants or participating hospitals cannot be identified, in accordance with requirements of the approving Human Research Ethics Committees.
