


Abstract
Perfluorohexane sulfonate (PFHxS) is a member of the per- and polyfluoroalkyls (PFAS) superfamily of molecules, characterized by their fluorinated carbon chains and use in a wide range of industrial applications. PFHxS and perfluorooctane sulfonate are able to accumulate in the environment and in humans with the approximated serum elimination half-life in the range of several years. More recently, some PFAS compounds have also been suggested as potential immunosuppressants. In this study, we analyze immune cell numbers in mice following 28-d repeated oral exposure to potassium PFHxS at 12, 120, 1,200, and 12,000 ng/kg/d, with resulting serum levels ranging up to ∼1,600 ng/ml, approximating ranges found in the general population and at higher levels in PFAS workers. The immunosuppressant cyclophosphamide was analyzed as a positive control. B cells, T cells, and granulocytes from the bone marrow, liver, spleen, lymph nodes, and thymus were evaluated. We found that at these exposures, there was no effect of PFHxS on major T or B cell populations, macrophages, dendritic cells, basophils, mast cells, eosinophils, neutrophils, or circulating Ab isotypes. By contrast, mice exposed to cyclophosphamide exhibited depletion of several granulocyte and T and B cell populations in the thymus, bone marrow, and spleen, as well as reductions in IgG1, IgG2b, IgG2c, IgG3, IgE, and IgM. These data indicate that exposures of up to 12,000 ng/kg of PFHxS for 28 d do not affect immune cell numbers in naive mice, which provides valuable information for assessing the risks and health influences of exposures to this compound.
Introduction
Per- and polyfluoroalkyls (PFAS) are a large group of synthetic molecules defined by their fluorinated carbon chains. Among them, perfluorooctane sulfonate (PFOS) and perfluorooctanoate (PFOA) are long carbon chain (more than seven carbons) PFAS compounds that have been heavily studied because of their widespread presence in the environment and in humans. The lengthy serum half-lives of long carbon chain PFAS in humans continues to drive ongoing research, including the evaluation of their potential effects on human health (1–3). Perfluorohexane sulfonate (PFHxS), which is structurally similar to PFOS but with two less carbons, has serum elimination half-lives that are similar to or longer than PFOS (4, 5). Specifically, PFHxS serum elimination half-lives are reported to be ∼1 mo in rodents, ∼4 mo in monkeys (6), and from 5.3 to 7.3–8.5 y in humans (the former value based on the community residents whose drinking water contained higher levels of PFHxS [4], whereas the latter was based on the workers that had occupational exposure to PFAS [7]).
Like its C8 counterpart, PFHxS-related chemistry had been used in the manufacture of a variety of industrial applications such as in firefighting foams, and it was discontinued in the United States in early 2000 (8). In biomonitoring studies, PFHxS is frequently detected at low concentrations, typically lower than those of PFOS and PFOA. Within the United States, the Centers for Disease Control and Prevention’s National Health and Nutrition Examination Survey has been analyzing and reporting various serum PFAS levels in the general population since the 1999–2000 survey year. For PFHxS, a geometric mean of 2.13 ng/ml was first reported in its 1999–2000 cycle, and in its latest survey released for the 2017–2018 cycle, the geometric mean was 1.08 ng/ml (9). These biomonitoring data showed a continued decline of serum PFHxS levels in humans along with other selected long-chain PFAS that are routinely monitored by the National Health and Nutrition Examination Survey (10, 11). Despite being less prevalent than PFOS or PFOA, PFHxS is still widely present in the environmental biota, and, because of its persistent and bioaccumulative properties, it has been listed under the Stockholm Convention as a persistent organic pollutant, as are PFOS and PFOA (12). Although there are many similarities between PFOS and PFHxS, the latter appears to exhibit less toxicity when evaluated in laboratory animals under comparable study conditions (13, 14). Data from comparative modeling based on lymphoid organ weights, hematological cell counts, and globulin concentration observed in animal toxicity experiments from a number of published studies (in both humans and rodents) suggest that PFHxS may be the least immunotoxic compound when compared with other selected PFAS (ranking of immunotoxic potency in serum was determined to be perfluorodecanoic acid > perfluorononanoic acid > perfluorohexanoic acid > PFOS > perfluorobutane sulfonate > PFOA > PFHxS) (15).
Even though PFHxS (along with PFOS, PFOA, and perfluorononanoic acid) has been associated with changes in immune-related responses in some cross-sectional epidemiologic studies (1, 16, 17), the collective findings are inconsistent. For example, serum PFHxS was not associated with serum inflammatory cytokines IL-1β, IL-6, and IL-10 among community residents exposed to higher PFHxS concentrations in the water from firefighting foam-related operation (18). However, some studies did report slightly elevated lymphocytes in human PBMCs correlated with elevated serum PFHxS, suggesting an immunomodulatory effect (i.e., affecting the immune system in ways that could increase some responses while decreasing other responses) rather than a general suppression (i.e., decreasing the immune response) (19, 20). There have also been several studies investigating serum Ab levels in relation to PFHxS in humans, where higher serum PFHxS levels, for example, were associated with negative shifts in Ab levels for diphtheria (21), rubella (22, 23), and SARS-CoV-2 IgG Ab concentrations among PFAS workers (24) and in pregnant women (25).
To date, there has not been a comprehensive rodent study that investigates the potential effects of PFHxS on immune cell homeostasis, by which we mean immune cell numbers at steady state, in various organs in mice. In this study, we have explored the potential effects of PFHxS on immune homeostasis by systematically evaluating various immune cell populations. We report on studies exposing mice for 28 consecutive days to PFHxS across a broad range of exposure levels, ranging from the ambient environment to the highest dose aimed at approximating exposure in the upper percentile of PFAS workers (7). We find that at these exposure ranges, PFHxS exhibited no effect on the cell numbers of key immune cell populations, although it affected the levels of circulating IgG1, IgG2c, and IgA Ab isotypes. By contrast, mice exposed to the known immunosuppressant cyclophosphamide monohydrate (CTX) as a positive control led to significant changes in immune cell numbers and Ab levels.
Materials and Methods
Materials
Potassium PFHxS (K+PFHxS, 98.9% pure) was provided by the 3M Company (St. Paul, MN). CTX was from Sigma-Aldrich (St. Louis, MO) and was reported to be 99.7% pure. All other chemicals used were reagent grade. PFHxS was prepared in vehicle (0.5% Tween 20 in deionized water) at targeted anionic PFHxS concentrations verified by liquid chromatography–tandem mass spectrometry prior to dose administration. CTX was prepared in deionized water.
Mice
C57BL/6 mice were exposed to PFHxS at a testing facility (Charles River Laboratories, Ashland, OH) that is fully accredited by the Association for Assessment and Accreditation of Laboratory Animal Care International. C57BL/6 mice (n = 4/sex/group/experiment) were supplied by Charles River Laboratories (Raleigh, NC) and were examined and acclimated prior to receiving the test material. Mice were group housed and given ad libitum access to Certified Rodent Diet# 5002 (PMI Nutrition International, St. Louis, MO) and reverse osmosis processed and chlorine-fortified city municipal water (Ashland, OH). Mice were ∼8 wk old upon the initiation of dosing. All procedures involving laboratory animals were reviewed and approved by the Charles River Laboratories Institutional Animal Care and Use Committee. Mice were dosed by oral gavage at a volume of 10 ml per kg body weight, corresponding to daily PFHxS doses of either 0 (vehicle control), 12, 120, 1,200, or 12,000 ng/kg/d for 28 d, which reflects the half-life of PFHxS in rodents (6). CTX, documented to induce immunosuppression in mice (26), was prepared fresh each day of dosing and administered once daily on days 1, 4, 8, 11, 15, 18, 22, and 25 for eight total doses throughout the 28-d exposure. Independent dosing experiments were staggered over 3 consecutive weeks, with each phase including four mice per sex per dose group; all three sets of dosing resulted in n = 12 mice/sex/dose group for the entire study. All mice were observed for morbidity and mortality at least twice daily, and detailed clinical observations were made at least once daily. During the entire treatment and recovery periods, body weights were recorded and food consumption quantitatively measured and recorded weekly (±2 d). Repeated daily PFHxS doses up to 12,000 ng/kg/d for 28 d or CTX at 50 mg/kg/d for eight doses did not affect food consumption, and no test material–related mortality was observed in this study, with all the animals surviving to the scheduled necropsy.
Collection of blood, gross necropsy, and organ weights
At scheduled necropsies, mice were euthanized under carbon dioxide inhalation, and whole blood was collected from each animal via cardiac puncture. In addition to terminal body weight, the organ weights for liver, thymus, and spleen were also obtained and recorded. Whole blood was processed to serum and stored frozen at −80°C for subsequent serum PFHxS concentration determination and immunological analysis.
Lymphocyte isolation and flow cytometry
The following organs were collected and prepared by Charles River Laboratories: bone marrow from one femur, thymus, lymph nodes (mesenteric and mandibular), spleen, liver (after perfusion with cold normal saline, one lobe was excised and flash frozen in liquid nitrogen, and the remaining was placed in complete RPMI medium: RPMI, 10% FBS, 1 mM sodium pyruvate, 1× nonessential amino acids, 5 mM HEPES, 1 mM l-glutamine, 100 U/ml penicillin, and 100 μg/ml streptomycin). All the specimens that were preserved in 5°C complete RPMI medium and a frozen serum aliquot from each animal were subsequently shipped to Cornell University for further analysis. Upon receipt at Cornell University, cells were isolated for flow cytometric analysis as previously described (27). Briefly, the thymus, spleen, and liver were mashed with a 10-ml syringe plunger and passed through a 100-μm cell strainer to obtain single-cell suspensions. Liver cells were further isolated from the buffy coat after Lympholyte-M centrifugation. Bone marrow was flushed from femurs using 1 ml complete RPMI medium and a 1-ml syringe with a 23-gauge needle. All cells rested in complete RPMI medium on ice until stained for flow cytometry. Cell numbers were calculated on the basis of total cell counts of the respective tissues, whereas percentages were calculated on the basis of their immediate parent cell population as shown in the gating strategies provided in the figures. The following Abs were used for flow cytometry: B cell panel: IgM (Fisher, 17-5790-82), CD21 (BD Biosciences, 552957), CD43 (BioLegend, 143210), CD24 (BioLegend, 101823), CD27 (eBioscience, 47-0271-82), B220 (BioLegend, 103232), IgD (BioLegend, 405725), CD19 (BioLegend, 152404), and CD5 (BioLegend, 100644). T cell panel: TCRβ (BioLegend, 109220), TCRγδ (BioLegend, 118115), CD4 (BioLegend, 100428), CD8 (Tonbo Biosciences, 65-1886-U100), NK1.1 (BioLegend, 108714), CD44 (BD, 553133), CD62L (BioLegend, 104426). Granulocyte panel: Ly6G (BioLegend, 108430), F4/80 (Thermo Fisher, 45-4801-82), CD11c (eBioscience, 17-0114-82), MHC2 (eBioscience, 56-5321-80), c-Kit (BioLegend, 105826), SiglecF (BD Biosciences, 552126), FcεR1α (eBioscience, 25-5898-80), and CD11b (BioLegend, 101256). Abs were incubated at a 1:200 dilution, along with an Fc block (anti-CD16/CD32; eBioscience, 14016185) at the same concentration, and viability dye (eBioscience, 65-0866-18) at a 1:500 dilution at room temperature for 30 min. Flow cytometry data were acquired using Attune NxT (Thermo Fisher) and analyzed in FlowJo (FlowJo LLC, Ashland, OR) as previously described (28). Total cells were counted using the Z2 particle counter (Beckman Coulter).
Serum Ab analysis
Serum Ab isotypes IgG2b, IgG3, IgG2c, and IgM (diluted 1:10,000) and IgG1, IgA, and IgE (diluted 1:100) were analyzed using Ab Isotyping 7-Plex Mouse ProcartaPlex Panel 2 (Thermo Fisher Scientific) following the manufacturer’s instructions. Plates were read on the MagPix Instrument (Luminex) and calculated with Luminex xPONENT 4.1 software.
Serum PFHxS concentration analysis
Flash-frozen serum samples were subjected to LC-MS/MS, and PFHxS concentration was determined according to a method previously described (6). The lower limit of detection was 2.5 ng/ml.
Statistical analysis and data visualization
All flow cytometry data were manually gated using FlowJo to identify specific populations on the basis of well-described surface markers. Using a custom-written R pipeline (28), the percentages of each population were extracted from the FlowJo workspace gates and processed as follows: The three experimental replicates were analyzed separately for all flow cytometric analysis. The control group, four PFHxS-exposed groups, and one CTX-exposed group of each experiment were analyzed with one-way ANOVA with the Dunnett post hoc test. If p < 0.05 in all three replicates for a given group and population and the direction of change was the same in all three experiments, then it was considered significantly different from control. Heat map colors were calculated as previously described (28). All weight and serum metric data from the three independent experiments were combined for analyses and graphs. Endpoint weights, serum PFHxS, and serum Abs were analyzed with one-way ANOVA and the Dunnett post hoc test. Body weights over time were analyzed by repeated measures ANOVA with Sidak’s multiple comparisons post hoc test.
Results
No apparent effect on overall health following 28 d of daily PFHxS exposure at concentrations up to 12 μg/kg/d
To evaluate the effects of PFHxS exposure on immune cell numbers, mice were split into six treatment groups (Fig. 1A), including vehicle control and a 50 mg/kg seven-dose CTX exposure regimen over the same 28 d. Four different PFHxS exposure groups were generated of 10-fold increasing PFHxS concentration, ranging from 12 ng/kg/d to 12 μg/kg/d, resulting in final serum concentrations of <2.5 ng/ml, 17.2 ± 1.8 ng/ml, 170.9 ± 20.8 ng/ml, and 1627.0 ± 297.3 ng/ml (Fig. 1B). Evaluation of body weights revealed that both females and males had expected increases in body weight due to normal development over the 28-d experiment, with no groups showing differences in growth compared with controls (Fig. 1C), and there were no differences in final body weight at collection compared with controls (Fig. 1D). No differences in spleen weight were found in any of the PFHxS groups (Fig. 1E). Although we previously found acute 4-d exposure to CTX at 40 mg/kg/d caused decreases in splenic weight (28), in the present study, we found that CTX exposure at 50 mg/kg every 4 d for 28 d led to increased splenic weight in females but not in males (Fig. 1E). However, the thymus weight was reduced in both males and females in the CTX-exposed group (Fig. 1F), whereas no change was observed in the PFHxS-exposed mice. Liver weights were not altered in any of the exposure groups (Fig. 1G).
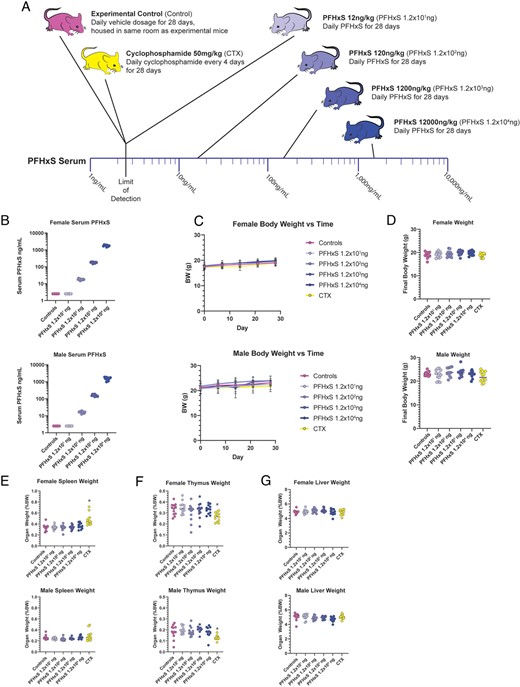
PFHxS does not affect body weight or organ weights.
(A) Schematic of exposure of mice to 28 d of varying doses of PFHxS, negative vehicle control, or the positive control CTX. (B) Serum PFHxS concentrations in female (top) and male mice (bottom). C) Animal body weights were taken weekly throughout the 28-d exposure and graphed separately for females and males. (D) Body weight at the experiment endpoint was plotted for females and males. (E) Spleen, females and males; (F) thymus, females and males; or (G) liver weights, females and males, were weighed at the experimental endpoint (n = 12). Data were analyzed with one-way ANOVA and Dunnett post hoc test. *p < 0.05.
No effect on thymocyte development following 28 d of daily PFHxS exposure at concentrations up to 12 μg/kg/d
Previous studies have found that acute PFAS exposures may alter the cellular composition of the thymus, such as 7 d of 0.02% PFOA (equivalent to 40 mg/kg/d), which was found to cause robust atrophy (80–90% reduction in size) of the thymus, with reductions in immature CD4/CD8 double-positive (DP) cells (29); a 10-d feeding of 0.02% dietary PFOS (resulting in 340,000 ng/ml in serum) led to decreased organ weight and reduced the cellular composition of both the spleen and the thymus (30). To evaluate the potential effects of PFHxS exposure on the thymus, we quantified the total number and percentage of key thymocyte subpopulations, CD4/CD8 double-negative (DN)1, DN2, DN3, DN4, CD4/CD8 DP, CD4 single positive (CD4 SP), CD8 SP, as well as total TCR αβ+ and γδ+ T cells, NKT, and NK cells (Fig. 2A). Of these populations, none were significantly altered by exposure to PFHxS at any of the exposure levels. Exposure to CTX, however, caused a decrease in total numbers of DN3 (2.8-fold lower) and NKT cells (4.2-fold lower) as well as the percentages of CD4 SP (2.7-fold lower) and TCR αβ+ T cells (1.8-fold lower) compared with controls (Fig. 2B, 2C). In all figures, statistical analyses were performed on each of the three independent replicates of the experiment, and if significant differences were observed in all three replicates, the heat map displays one or more horizontal lines (Fig. 2D). To further exhibit cell numbers of major populations in various organs, total counts from the three independent experiments are combined and graphed (see Supplemental Fig. 1).
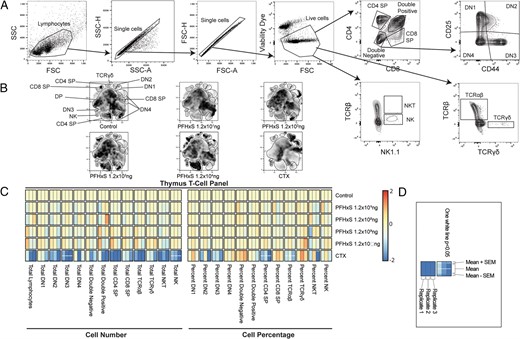
PFHxS does not influence thymus cell percentages or counts.
After 28 d of exposure to varying doses of PFHxS, vehicle control, or positive control CTX, the thymus was collected and cell populations were analyzed via flow cytometry. (A) Example of the gating strategy used to define cell populations. (B) Representative t-distributed stochastic neighbor embedding plots of each dose and condition. (C) Heat map of cellular changes based on counts (left) or percentages (right). Red indicates an increase, whereas blue indicates a decrease, and beige is no change from control animals. (D) Heat map key used for all heat maps within this article. Each minicolumn indicates one replicate of the experiment, with each experimental replicate having n = 8 per group. The length of each column indicates variation among the mean, whereas the mean is the middle portion, with the top and bottom segments shaded appropriately to visualize the SEM. One white line indicates p < 0.05 for all three experiments, and no line indicates no statistical difference. All heat map data were analyzed with one-way ANOVA and Dunnett post hoc test.
No effect on splenocyte populations following 28 d of daily PFHxS exposure at concentrations up to 12 μg/kg/d
To determine if key splenocyte populations were affected by PFHxS exposure, we quantified total and relative populations of splenic lymphocyte subpopulations: total αβ+ and γδ+ T cells, CD4+, CD8+, NKT, and NK cells, along with subpopulations of naive, effector, and central memory CD4+ and CD8+ T cells (Fig. 3A). There were no changes with PFHxS exposure for these cell types (Fig. 3B, 3C). We also investigated the following splenic B cell populations using established gating identification strategies (31–33): total B cells, B-1a cells, B-1b cells, B2 B cells, follicular B cells, and marginal zone B cells (Fig. 3A). There were no changes in B cell subsets found at any concentration of PFHxS (Fig. 3D, 3E).

PFHxS does not affect splenic lymphocyte percentages or counts.
After 28 d of exposure to varying doses of PFHxS, vehicle control, or the positive control CTX, the spleen was collected and cell populations were analyzed via flow cytometry. (A) Example of the gating strategy used to define cell populations. (B) Representative t-distributed stochastic neighbor embedding (tSNE) plots for splenic T cells of each dose. (C) Heat map of cellular changes based on counts (left) or percentages (right). (D) Representative t-distributed stochastic neighbor embedding plots for splenic B cells of each dosing condition. (E) Heat map of cellular changes based on counts (left) or percentages (right).
By contrast, CTX exposure caused multiple alterations in splenocyte populations. This included a reduced total number of CD8+ naive and effector cells (2.5-fold lower), as well as a reduced percentage and number of CD8+ central memory cells (1.5-fold lower). NKT percentage and counts were decreased (3.3-fold and 2.5-fold lower), as well as NK cell percentage and counts (2.0-fold lower) compared with controls (Fig. 3B, 3C). CTX also caused statistically significant decreases in total numbers of B cells, B-1b cells, and follicular B cells (each at least 6-fold lower); in addition, the percentage of B cells relative to lymphocytes was reduced (3.3-fold lower), and follicular B cells were decreased, whereas marginal zone B cells were increased, both as a percentage of B cells (Fig. 3D, 3E).
We also examined several key granulocyte populations in the spleen, including basophils, macrophages, dendritic cells, eosinophils, mast cells, and neutrophils (Fig. 4A), but none of them were altered by PFHxS exposure (Fig. 4B). By contrast, we found that CTX caused a significant increase of splenic macrophages compared with controls (5.3-fold higher in total macrophage count, 1.7-fold higher as a percentage of all splenocytes) (Fig. 4B).
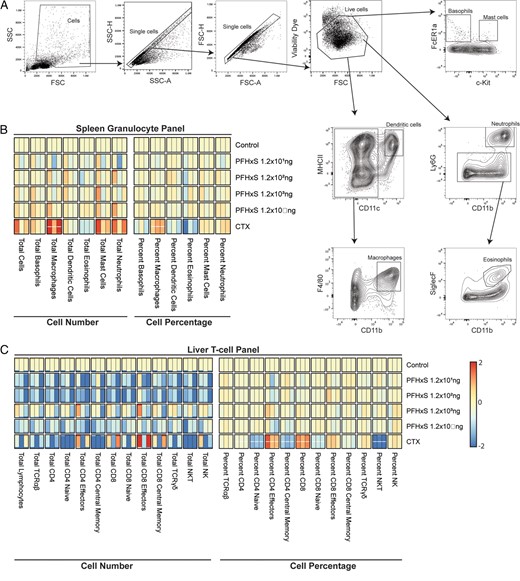
PFHxS does not influence spleen granulocytes or liver T cell percentages or counts.
After 28 d of exposure to varying doses of PFHxS, vehicle control, or the positive control CTX, the spleen and liver lymphocytes were collected, and cell populations were analyzed via flow cytometry. (A) Example of the gating strategy used to define cell populations. (B) Heat map of cellular changes for splenic granulocytes of each dose based on counts (left) or percentages (right). (C) Heat map of cellular changes for liver T cells per each condition based on counts (left) or percentages (right).
No effect on liver lymphocytes following 28 d of daily PFHxS exposure at concentrations up to 12 μg/kg/d
We quantified the total and relative population sizes of key T cell populations in the liver, including subpopulations of αβ T cells, CD4+ and CD8+ T cells (naive, effector, and central memory cells), γδ T cells, and NKT and NK cells. We did not observe any alterations caused by PFHxS exposure (Fig. 4C). CTX, however, caused significant changes in many of these T cell subpopulations. The percentages of CD4+ cells were reduced (1.8-fold lower), as were CD4+ central memory (4.1-fold lower), CD8+ naive (1.4-fold lower), and NKT cells (10.3-fold lower). By contrast, the percentages of CD4+ and CD8+ naive cells were increased (5.2- and 1.5-fold higher, respectively). Although there were no significant changes in the total numbers of liver-resident T cells, the high variability in total lymphocyte extraction between experiments may mask differences in total cell number (Fig. 4C).
No significant changes in lymph node B and T cell populations following 28 d of daily PFHxS exposure at concentrations up to 12 μg/kg/d
We quantified several key lymphocyte populations of lymph nodes, including B and T cells (Fig. 5A, 5B). No changes were found in any of the PFHxS-exposed groups, but CTX caused the loss of several cell populations in the lymph nodes. The total number of B cells was reduced (21.3-fold lower), as was the total number of follicular B cells. As a percentage of total lymphocytes, CTX reduced B cells, thereby slightly increasing T cell percentages (but not counts) compared with controls.
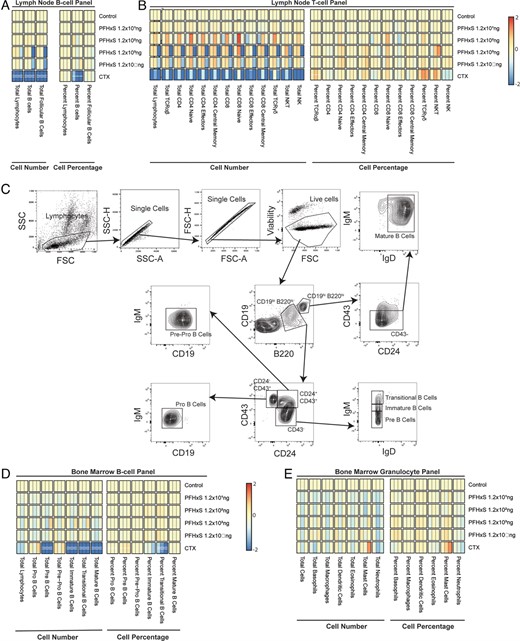
PFHxS does not influence lymph node lymphocytes or bone marrow B cells or granulocyte percentages or counts.
After 28 d of exposure to varying doses of PFHxS, vehicle control, or the positive control CTX, the lymph nodes and bone marrow were collected, and cell populations were analyzed via flow cytometry. (A) Heat map of cellular changes for lymph node B cells of each dosing condition based on counts (left) or percentages (right). (B) Heat map of cellular changes for lymph node T cells of each dosing condition based on counts (left) or percentages (right). (C) Example of the gating strategy used to define B cell populations in the bone marrow. Heat maps of cellular changes for bone marrow (D) B cells or (E) granulocytes per each condition based on counts (left) or percentages (right).
No effect on bone marrow B cells or granulocytes following 28 d of daily PFHxS exposure at concentrations up to 12 μg/kg/d
The bone marrow is a critical site for B cell development, so we quantified the total and percentage of B cells and their key developmental subpopulations in the bone marrow, including immature, transitional, mature, pre-, pro-, and pre-pro B cells (Fig. 5C), gated as previously defined in the literature (31–33). We also quantified basophil, macrophage, dendritic cell, eosinophil, mast cell, and neutrophil populations. Bone marrow populations appeared unaffected by PFHxS, whereas CTX caused substantial reductions in total pre-B cells, immature B cells, transitional B cells, and mature B cells (Fig. 5D). Most of these same populations were also altered as a percentage of total lymphocytes (Fig. 5D). Neither PFHxS nor CTX caused significant changes in bone marrow–resident granulocytes (Fig. 5E).
No effect on circulating Ab levels following 28 d of daily PFHxS exposure at concentrations up to 12 μg/kg
Because we saw significant changes in B cells from mice exposed to CTX, we wanted to assess the maintenance of B cell Ab production by comparing circulating Abs of various isotypes: IgG1, IgG2b, IgG2c, IgG3, IgA, IgE, and IgM levels between the six groups of mice in this study (Fig. 6). IgG1, IgG2b, IgG2c, IgG3, IgE, and IgM were significantly lower in the mice treated with CTX compared with controls; however, all PFHxS-exposed mice showed no change in any circulating Ab levels.
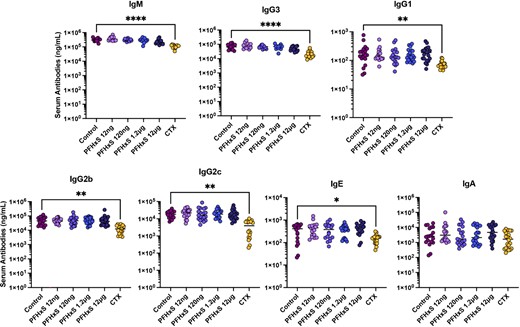
PFHxS does not influence serum Ig levels.
After 28 d of exposure to varying doses of PFHxS, vehicle control, or the positive immunomodulator control CTX, blood was collected and serum Ab isotypes were quantified by multiplex assay (n = 24). IgG1, IgA, and IgE were quantified using 1:100 serum dilution whereas IgM, IgG3, IgG2b, and IgG2c were quantified using 1:10,000 dilution of sera. Data were analyzed with one-way ANOVA and Dunnett post hoc test. *p < 0.05, **p < 0.01, ****p < 0.0001.
Discussion
Recent studies suggest that exposure to PFHxS may be associated with some negative immune implications (23–25, 34, 35), warranting further investigation using well-controlled animal studies. However, to date, there have not been comprehensive animal studies to examine whether 4-wk exposures at known environmental levels of PFHxS can affect the homeostasis of the immune system. In this study, we have evaluated groups of mice exposed to environmentally relevant levels of PFHxS that match current human exposure in the general population, as well as three orders of magnitude higher, to determine any effects that may become apparent at higher levels of exposure. We analyzed immune cell populations and naive Ab levels in mice with serum PFHxS concentrations <2.5 ng/ml, 17.2 ± 1.8 ng/ml, 170.9 ± 20.8 ng/ml, and 1627.0 ± 297.3 ng/ml. We found no effect of PFHxS exposure on any immune cell populations in the thymus, bone marrow, spleen, lymph nodes, or liver. In contrast to PFHxS, exposure to the known immunosuppressant CTX results in major disruptions of immune populations in these lymphoid organs. Our analyses are not without caveats. These include the Abs used for flow cytometric identification of T cell, B cell, and granulocyte subsets. The use of additional Abs could be helpful in defining smaller subsets of these and other populations or even the activation status of immune cells. Additionally, the time from organ harvest to flow cytometry staining was longer than ideal because of the large sample sizes of the independent experiments, along with shipping time, which may lead to increased cell death prior to our analysis.
Relatively few studies have interrogated the effects of PFHxS on the spleen or thymus, although a number of studies have examined exposure to PFOS. In mice, at high levels of PFOS exposure (10 mg/kg/d for 7 d) leading to serum PFOS concentrations 126,490 ng/ml, others have reported increased apoptosis in the thymus and spleen, causing splenic and thymic weight loss (36). In this evaluation of PFHxS exposure, we found no gross changes in the weights of the thymus or spleen, whereas CTX caused decreased weights of these organs. We found that exposure to CTX also reduced the number of several B cell subsets, CD8+ T cell subsets, NK, and NKT cells in the spleen and lymph nodes.
We also quantified circulating isotypes of immunoglobins as a correlate of plasma cell function and production of Abs. We did find, as expected, significantly reduced circulating levels of IgM, IgG1, IgG2c, IgG2b, IgG3, and IgE Abs in the mice chronically exposed to CTX. Quantification of bone marrow cell populations that are representative of B cell development was consistent with these effects in that CTX caused an overall decrease in nearly all lymphocyte populations in the bone marrow. Although PFHxS exposure did not change circulating levels of Abs, analysis of vaccination or immune challenge will be important for determining if immune responses could be affected by exposure.
Several studies have also found that some PFAS, including the longer-chain counterpart of PFHxS, PFOS, can cause hepatotoxicity (37, 38). Zhang et al. found that liver weight was increased in mice exposed to PFOS for 7 d at doses that resulted in PFOS serum concentrations of 87,560 ng/ml and higher (36). However, previous analysis of doses of PFHxS ranging up to 3 mg/kg/d for 42 d found no liver toxicity, as determined via measuring aspartate aminotransferase or alanine aminotransferase (14). In our study, we found no change in liver weight as a result of exposure to these levels of PFHxS exposure, and an investigation of liver-resident lymphocyte populations showed no differences from controls. This suggests that for the doses examined, there was no acute liver damage. This lack of changes in immune cell numbers match our findings from previous studies of PFOS (28). The concentrations we used are physiologically relevant, designed to be around concentrations similar to those occurring in humans from environmental exposures (4, 10). CTX exposure also did not cause changes in liver weight; however, it did alter the relative percentages of certain liver-resident lymphocyte populations. We observed similar findings in lymph nodes in that although CTX exposure reduced cells in this organ, we did not observe any effects from PFHxS exposure in the lymph nodes.
Studies of the effect of PFHxS on immune parameters have led to mixed conclusions. Ab response to vaccines in humans have relied on statistical correlations of Ab concentrations with serum PFHxS levels, and many of the reported associations were not found to be statistically significant (21–25). Regarding clinical data, one study showed higher reported incidents of the common cold with higher PFHxS serum concentrations in children between 3 and 11 y old; however, it was not the case for those between 12 and 19 y old (35). In another study, higher serum levels of PFHxS correlated with asthma attacks in boys 12–19 y old, but not girls, and no significant changes were seen in any WBC counts of these subjects (34). It is also worth noting that correlations of PFHxS levels in human sera with reported clinical symptoms, measured cytokines, or Ab levels are confounded by parallel exposures to other toxicologic agents, including other PFAS as well as unrelated or unknown environmental exposures, emphasizing the need for evaluation and validation in animal models. The work reported in this study using solely PFHxS exposures across 4 wk in mice allows direct evaluation of any potential effects to immune cell populations.
In summary, we found no apparent signs of immune cell population disruption in adult mice dosed with PFHxS at concentrations up to 12,000 ng/kg for 28 d. Perhaps investigation of newborn pup exposures through PFHxS-containing breastmilk would be an important study of potential changes in immune homeostasis during its establishment earlier in life. Additionally, functional studies will be necessary to determine what, if any, effect PFHxS may have on immune system function.
Disclosures
A.A. receives research support from 3M Company. S.C. is an employee of the 3M Company. The other authors have no financial conflicts of interest.
Acknowledgments
We thank members of the August lab for helpful discussions.
References
Footnotes
This work was supported by the 3M Company (A.A.).
The online version of this article contains supplemental material.
T.M.P., J.E., A.R., O.A., B.I., K.O’H., A.V., S.A., N.B., and J.S. conducted experiments; T.M.P., J.E., O.A., B.I., S.C., J.S., and A.A. designed research; T.M.P., J.E., O.A., B.I., S.C., J.S., and A.A. analyzed data; and T.M.P., J.S., and A.A. wrote the manuscript.
