


Abstract
PD-1 blockade has been approved for head and neck squamous cell carcinoma (HNSCC) patients. However, many HNSCC patients do not respond to this treatment, and other tumor microenvironmental factors may promote resistance to PD-1 blockade. We previously identified increased expression of the inhibitory receptor NKG2A on CD8+ T cells in HNSCC tumors compared with T cells in matching PBMC samples. Mechanisms that promote NKG2A expression and the role of NKG2A on human T cells in the tumor microenvironment, however, are uncertain. In this study, we show that tumor-conditioned media (TCM) of HNSCC cancer cell lines or ascites fluid from colorectal carcinoma patients is sufficient to induce the expression of NKG2A and other inhibitory receptors on activated CD8+ T cells isolated from PBMCs of healthy donors. Boiling or small molecular mass cutoff filtering did not eliminate the effect of TCM, suggesting that a small molecule promotes NKG2A. T cell activation in TCM decreased the basal and maximal mitochondrial respiration to metabolically restrain CD8+ T cells. Functionally, T cell activation in TCM reduced CD8+ T cell cytotoxicity as shown by lower production of cytokines, granzyme B, and perforin. Furthermore, TCM prevented CD8+ T cells from killing cancer cells in response to an anti-CD19/anti-CD3 bispecific T cell engager. Thus, a small secreted molecule from HNSCC cells can induce NKG2A expression and promote T cell dysfunction. Our findings may lead to targets for novel cancer therapies or biomarkers for NKG2A blockade response and provide a model to study T cell dysfunction and impaired metabolism.
Introduction
Head and neck squamous cell carcinoma (HNSCC) is the sixth most common cancer in the United States (1–4). Recurrent/metastatic HNSCC accounts for most head and neck cancer-related deaths, with a mean survival between 6 and 15 mo (1, 5). Immune checkpoint inhibitors (ICIs) blocking Abs against PD-1/PD-L1 are the first-line therapy for patients with recurrent/metastatic HNSCC (5, 6). However, the response rate remains limited, highlighting the need to identify new molecular targets to treat these patients (3, 4, 6, 7). Targeting ICIs such as CTLA-4, Tim-3, Lag3, and TIGIT has shown limited efficacy in HNSCC patients (8) and led NKG2A to emerge as a potential ICI candidate. NKG2A forms a heterodimeric receptor with CD94 that can be expressed by NK cells and CD8+ T cells (9). NKG2A contains ITIMs that block the activating signals of NK cells and CD8+ T cells, preventing their cytokine secretion and degranulation (9–14). This inhibitory receptor recognizes the nonclassical MHC class I molecule HLA-E (Qa-1b in mice) (9). In contrast to classical MHC class I molecules, HLA-E shows low polymorphism and is highly conserved (15–17). HLA-E presents peptides derived from the leader sequence of other MHC class I molecules (10, 16, 18, 19) and is present in most human tissues, although it is typically expressed at 25-fold lower levels than classical MHC class I molecules (18, 20). High expression of HLA-E and NKG2A have been correlated with poor prognosis in different cancers, including HNSCC (10, 15, 21–25).
Previous studies have shown that NKG2A blockade can increase immune antitumor cytotoxicity in vitro and in different preclinical cancer models, including models refractory to PD-1 blockade (10, 14, 21). Furthermore, preliminary results of phase II clinical trial NCT02643550 suggest that combinatorial therapy of mAbs monalizumab (anti-NKG2A) and cetuximab (anti-EGFR) increased the objective response rate in HNSCC patients with no significant adverse effect (14, 26). Results of phase II clinical trial NCT05221840 also suggest that the combination of monalizumab and durvalumab (anti–PD-L1) increased both the objective response rate and the progression-free survival of patients with unresectable stage III non–small cell lung cancer (27).
Cancer cells secrete a variety of cytokines and alter the microenvironment by consuming nutrients and secreting metabolic waste products that may promote NKG2A expression. Studies on murine T cells have shown that cytokines IL-6, IL-10, and IL-21 can induce NKG2A in murine CD8+ T cells (28). Conversely, CD28 costimulation, as well as cytokines IL-4, IL-23, and TGF-β, can prevent the expression of NKG2A in murine CD8+ T cells (28). It was also shown that TGF-β enhances NKG2A expression on murine CD8+ T cells after repeated TCR stimulation in vitro (29). TGF-β signals are not required, however, for NKG2A induction in vivo (29). TGF-β has also been shown to induce NKG2A expression on human CD8+ T cells in vitro (30, 31). Coculture of cervical cancer cells with autologous T cells from PBMCs can induce NKG2A expression, and this requires IL-15 and TGF-β (11, 30). IL-12 has also been reported to induce NKG2A (32). The role of the tumor metabolic secretome, however, has not been established.
In this study, we aimed to understand how the tumor microenvironment (TME) induces the expression of NKG2A and how it promotes dysfunction in human CD8+ T cells. We show that NKG2A can be induced in vitro on human CD8+ T cells isolated from PBMCs and cultured in tumor-conditioned media (TCM) from cancer cell lines. Similar to what has been observed in tumor-infiltrating lymphocytes (TILs), CD8+ T cells cultured in TCM also expressed tissue-resident and exhaustion markers. These effects were maintained even after TCM were boiled or filtered, to point to a small molecule rather than a cytokine or extracellular vesicle as a mediator of NKG2A induction. CD8+ T cells cultured in TCM exhibited impaired mitochondrial metabolism, decreased production of cytokines and cytotoxic molecules, and impaired killing capacity of cancer cells in response to a bispecific T cell engager (BiTE). Understanding how cancer cells modify the TME to induce inhibitory receptors on T cells may lead to new targets in immunotherapy and to overcome ICI resistance.
Materials and Methods
HNSCC patient cohort
Samples were obtained from HNSCC patients undergoing surgery. Each patient completed an informed written consent. Collection and use of human tissues were approved by the Medical Ethical Review Board of Vanderbilt University Medical Center Institutional Review Board no. 030062, NCT00898638.
Flow cytometry HNSCC patient cohort (Nashville)
Fresh tumor samples were processed using the Miltenyi Biotec human tumor dissociation kit and the Miltenyi Biotec gentleMACS Octo dissociator following the manufacturer’s instructions. Single-cell suspensions were stained and analyzed by flow cytometry using a BD FACSCelesta.
Ascites sample collection and processing
Malignant ascites were collected from patients diagnosed with metastatic colorectal cancer during surgical interventions. Each patient completed an informed written consent. Collection and use of malignant ascites were approved by the Medical Ethical Review Board of Vanderbilt University Medical Center Institutional Review Board no. 010680.
The ascitic fluid was aspirated directly from the abdominal cavity. To remove coarse particulate matter, the aspirated fluid was immediately passed through a sterile 100-µm mesh. After initial filtration, the ascites samples were subjected to centrifugation at 3500 rpm for 15 min at room temperature. The resultant supernatant was then filtered through a 2-µm pore size sterile filter to achieve a cell-free filtrate. The clarified, cell-free ascites filtrate was aliquoted into sterile cryovials and promptly stored at −20°C for future analytical assessments.
Flow cytometry
Cells were first incubated with live/dead fixable dye (BioLegend, 423101) in PBS for 15 min at 4°C. Subsequently, cells were incubated with mAbs for 15 min at 4°C. For intracellular staining single-cell suspensions were incubated with PMA/ionomycin (cell stimulation mixture, Invitrogen, 00-4970-93), monensin (BioLegend, 420701), and brefeldin A (BioLegend, 420601) for 4 h at 37°C. Following activation, the cells were surface stained and then fixed for 15 min with intracellular fixation buffer (eBioscience, 00-8222-49). Following fixation, cells were permeabilized with permeabilization buffer (eBioscience, 00-8333-56) for 30–60 min. For transcription factor staining, the cells were surface stained and then fixed/permeabilized with Foxp3/Transcription Factor Fix/Perm (Cytek, TNB-1022-L160) for 1 h, and cells were then stained for the corresponding transcription factor. Samples were acquired on a BD FACSCelesta flow cytometer or MACSQuant Analyzer 16 flow cytometer, and results were analyzed using FlowJo software. Zombie Aqua fixable viability dye (1:500, BioLegend, 423101) was used identically for surface Abs. The Abs used are shown in Table I.
Abs used in this study
| Ab | Dilution | Source | Identifier |
|---|---|---|---|
| NKG2A-PE (S19004C) | 1:100 | BioLegend | 375104 |
| CD8-allophycocyanin (HIT8a) | 1:200 | BioLegend | 300912 |
| PD-1–BV421 (EH12.2H7) | 1:100 | BioLegend | 329920 |
| Tim-3–BB515 (7D3) | 1:100 | BD Biosciences | 565568 |
| CD39-allophycocyanin/Cy7 (A1) | 1:200 | BioLegend | 328226 |
| CD69–PE/Dazzle 594 (FN50) | 1:200 | BioLegend | 310942 |
| CD103-BV785 (Ber-ACT8) | 1:200 | BioLegend | 350230 |
| TCF1–Alexa Fluor 647 (C63D9) | 1:50 | Cell Signaling | 6709S |
| Tim-3–BV786 (7D3) | 1:100 | BD Biosciences | 742857 |
| IFN-γ–PE/Dazzle 594 (4S.B3) | 1:100 | BioLegend | 502546 |
| TNF-α–Alexa Fluor 488 (MAb11) | 1:100 | BioLegend | 502915 |
| Granzyme B–Alexa Fluor 700 (QA16A02) | 1:200 | BioLegend | 372222 |
| Perforin-PerCP/Cy5.5 (B-D48) | 1:200 | BioLegend | 353314 |
| CCR7–Pacific Blue (G043H7) | 1:100 | BioLegend | 353210 |
| CD45RO-BV785 (UCHL1) | 1:200 | BioLegend | 304234 |
| CD127–Alexa Fluor 488 (A019D5) | 1:100 | BioLegend | 351314 |
| KLRG1–PE/Dazzle 594 (14C2A07) | 1:100 | BioLegend | 368608 |
| CD45RA-PerCP/Cy5.5 (CD28.2) | 1:800 | BioLegend | 304122 |
| CD8-BV785 (RPA-T8) | 1:200 | BioLegend | 301046 |
| CD16-BV605 (3G8) | 1:1000 | BioLegend | 302040 |
| KIR3DL1-BV421 (DX9) | 1:100 | BioLegend | 312714 |
| NKG2A–PE/Dazzle 594 (S19004C) | 1:100 | BioLegend | 375122 |
| NKG2D-FITC (1D11) | 1:100 | BioLegend | 320820 |
| CD56-PE (5.1H11) | 1:100 | BioLegend | 362508 |
| DNAM-1–PerCP/Cy5.5 (11A8) | 1:200 | BioLegend | 338314 |
| NKp46-allophycocyanin (9E2) | 1:200 | BioLegend | 331918 |
| CD8–Pacific Blue (HIT8a) | 1:100 | BioLegend | 300928 |
| CD49a-FITC (TS2/7) | 1:100 | BioLegend | 328308 |
| NKp30-PE (P30-15) | 1:200 | BioLegend | 325208 |
| CD94-PerCP/Cy5.5 (DX22) | 1:200 | BioLegend | 305514 |
| NKG2C-allophycocyanin (134591) | 1:100 | R&D Systems | FAB138A-100 |
| CD8-BB515 (RPA-T8) | 1:200 | BD Biosciences | 564526 |
| Lag3-BV421 (11C3C65) | 1:100 | BioLegend | 369314 |
| PD-1–BV785 (EH12.2H7) | 1:100 | BioLegend | 329930 |
| TIGIT–PE/Dazzle 594 (A15153G) | 1:100 | BioLegend | 372716 |
| CTLA-4–PerCP/Cy5.5 (BNI3) | 1:100 | BioLegend | 369608 |
| CD107a-allophycocyanin (H4A3) | 1:100 | BioLegend | 328620 |
Quantitative PCR
RNA of CD8+ T cells was isolated using the RNeasy mini kit (Qiagen, 74104), and cDNA was synthesized using the SuperScript VILO cDNA synthesis kit (Invitrogen, 11754050) according to the manufacturer’s instructions. Quantitative PCR was performed using TaqMan fast advanced master mix (Applied Biosystems, 4444557) and TaqMan real-time probes (Applied Biosystems). The relative gene expression was calculated using the ΔΔCt method. Expression of the target gene was normalized to the reference gene (HPRT) and the mean expression level of the control group.
Cancer cell line culture and collection of TCM
Cal27, Detroit 562, SCC25, and SCC90 cells were purchased from the American Type Culture Collection. HCT116, SW480, SNU2404, and 2621B cells were provided by Kamran Idrees (Vanderbilt University Medical Center). 786-0, A498, and HeLa cells were provided by W. Kimryn Rathmell (Vanderbilt University Medical Center). MCF-7 and T47D cells were provided by Ben Ho Park (Vanderbilt University Medical Center). Cancer cell lines were cultured in complete RPMI 1640 (cRPMI) in T25, T75, or T150 flasks for 3–6 d. Once the cells were confluent and the media turned acidic, the supernatant was collected and centrifuged at 400 × g for 4 min to remove dead cells and cell debris to generate the TCM for the corresponding cell line. Batches of TCM were frozen and stored at −80°C. To generate boiled TCM, TCM aliquots were thawed at room temperature and then boiled at 100°C for 30 min. After boiling, the boiled TCM were supplemented with 10% FBS. To generate filtered TCM, TCM aliquots were thawed at room temperature and filtered using an Amicon ultra-15 centrifugal filter unit (3 kDa molecular mass cutoff, UFC900324) at 4000 rpm for 1–1.5 h. The flowthrough was collected and supplemented with 10% FBS to generate filtered TCM. Additionally, a small volume of the TCM containing molecules >3 kDa was concentrated in the top part of the Amicon ultra-15 centrifugal filter and this was diluted in cRPMI up to the original volume of TCM to generate the top TCM. To neutralize the pH of the TCM, 1–5 µl of KOH was added to 1 ml of TCM of the cancer cell lines (shown as KOH + TCM).
CD8+ T cell isolation, culture, and activation
CD8+ T lymphocytes were isolated from the peripheral blood of healthy human donors. PBMCs were isolated using Ficoll-Paque Plus, following the manufacturer’s instructions. CD8+ T cells were isolated from PBMCs using magnetic bead sort with the Miltenyi Biotec human CD8+ T cell isolation kit (130-096-495) or MojoSort human CD8 T cell isolation kit (BioLegend, 480022) according to the manufacturers’ instructions. All human CD8+ T cells were cultured at 37°C with 5% CO2 in RPMI 1640 supplemented with 10% FBS, 1% penicillin/streptomycin, 1% GlutaMAX, 1% HEPES, and 0.1% 2-ME. A total of 100,000 CD8+ T cells were plated on 96-well plates in 200 µl of cRPMI, or the corresponding treatment, with 1:1 CD3/CD28 activation beads (Life Technologies, 11131D) and cultured at 37°C for 3–7 d.
For CD8+ T cell coculture with Cal27 cells, a total of 50,000, 25,000, or 12,500 Cal27 cells were plated in cRPMI in 96-well plates. After Cal27 cells were attached to the plate, 50,000 unactivated CD8+ T cells with 1:1 CD3/CD28 activation beads were added to the Cal27 cells and cocultured at 37°C for 3 d. Activation beads were present throughout the duration of the experiment. CD8+ T cells were then collected, washed, and stained for flow cytometry as described above.
For CD8+ T cells cultured with cytokines, 100,000 nonactivated CD8+ T cells were cultured in 96-well plates with 1:1 CD3/CD28 activation beads in cRPMI, or cRPMI supplemented with IL-2 (50 U/ml), IL-10 (100 ng/ml), IL-15 (20 ng/ml), IL-21 (100 ng/ml), or TGF-β (20 ng/ml). Media (cRPMI or cRPMI supplemented with the corresponding cytokine) were renewed every day starting on day 3 and activation beads were present throughout the duration of the experiment. At day 7, CD8+ T cells were collected, washed, and stained for flow cytometry as described above.
For CD8+ T cells treated with the TCM, 100,000 unactivated CD8+ T cells were cultured in 96-well plates with 1:1 CD3/CD28 activation beads in cRPMI or 1:1 TCM/cRPMI unless otherwise stated. TCM were present since day 0 and throughout the duration of the experiment unless otherwise stated. Media (cRPMI or TCM/cRPMI at the corresponding ratio) were renewed every day starting on day 3 and activation beads were present throughout the duration of the experiment. At day 5 or day 7, CD8+ T cells were collected, washed, and stained for flow cytometry as described above.
Extracellular flux assay
CD8+ T cells were obtained as described above. CD8+ T cells were plated at 150,000 live cells/well in technical triplicates on a Cell-Tak-coated plate (Corning, 354240) in Agilent Seahorse RPMI 1640 supplemented with 10 mM glucose, 1 mM sodium pyruvate, and 2 mM glutamine. Cells were analyzed on a Seahorse XFe96 bioanalyzer using the Mito Stress assay (Agilent, 103015-100) with 1 μM oligomycin, 2 μM FCCP, and 0.5 μM rotenone/antimycin A. Data were analyzed with Agilent Wave software version 2.6.
Cytotoxicity assay
CD8+ T cells were cultured with 1:1 CD3/CD28 activation beads for 5 d in cRPMI or 1:1 TCM/cRPMI flat-bottom 96-well plates at a 100,000 cells/well concentration. Once target cells were plated, CD3/CD28 activation beads were removed magnetically and CD8+ T cells were counted for the cytotoxicity assay. The cytotoxicity assay was performed at a 1:1 E:T ratio by coculturing 100,000 CD8+ T cells with Raji or Jurkat cells with or without an anti-CD19/anti-CD3 BiTE at 5, 10, or 20 ng/ml to redirect CD8+ T cells to target CD19+ cells. After 4 h, cells were collected, washed, and stained for flow cytometry as described above.
Quantification and statistical analysis
Graphs and statistical tests were generated using GraphPad Prism 9 unless otherwise noted. Statistical methods are stated in the figure legends. In all cases, a significant p value is noted as follows: *p < 0.05, **p < 0.01, ****p < 0.001, ****p < 0.0001.
Results
NKG2A+CD8+ TILs of HNSCC patients coexpress exhaustion and tissue-resident markers
Previous reports have shown that NKG2A expression correlates with exhaustion markers on CD8+ TILs (21, 29, 33). Despite these findings, it is not clear where NKG2A expression lies within the T cell exhaustion spectrum. To address this question, we analyzed the expression of NKG2A and multiple exhaustion markers on CD8+ T cells from HNSCC tumor biopsies and matching non–tumor-associated uvula. Tumor specimens had a trend for a higher frequency of NKG2A+CD8+ T cells than did the CD8+ T cells present in matching non–tumor-associated uvula tissue (Fig. 1A, gating in Supplemental Fig. 1). Also, a higher frequency of CD8+ TILs from HNSCC expressed exhausted T cell markers PD-1+Tim-3+ (Fig. 1B) and PD-1+CD39+ (Fig. 1C) than did CD8+ T cells in non–tumor-associated uvula from the same donors. Similar frequency of tissue-resident memory T cell (Trm) markers CD69+CD103+ (Fig. 1D) were observed in CD8+ T cells from HNSCC tumors and non–tumor-associated uvula. Comparing the NKG2A+CD8+ TIL population with NKG2A−CD8+ TILs from HNSCC tumors showed a significant correlation between NKG2A and the expression of exhausted T cell markers PD-1+Tim-3+ (Fig. 1E) and PD-1+CD39+ (Fig. 1F), and these correlations were not observed in the non–tumor-associated uvula samples. Similarly, a significant correlation between NKG2A and Trm markers CD69+CD103+ (Fig. 1G) was observed in HNSCC tumors, and a similar trend was observed for non–tumor-associated uvula samples. Most NKG2A+ cells in HNSCC tumors were Trms (Fig. 1H), and a similar trend was observed for non–tumor-associated uvula. The frequencies of the NKG2A+CD8+ T cell subset within different T cell activation states were also evaluated. About 25% of the terminally exhausted cells (PD-1+Tim-3+TCF-1−) expressed NKG2A (Fig. 1I). Although to a lower frequency, both the progenitor exhausted group (PD-1+Tim-3−TCF-1+) and the activated group (PD-1+Tim-3−TCF-1−) also included NKG2A+CD8+ TILs. Comparing the NKG2A+CD8+ TIL population with NKG2A−CD8+ TILs showed a negative trend between NKG2A and markers for progenitor exhausted T cells (Fig. 1J). Altogether, these data show that many TILs express NKG2A and that NKG2A+CD8+ T cells have a tissue-resident phenotype, with many exhibiting a terminally exhausted phenotype and a smaller subset with a more progenitor exhausted phenotype.
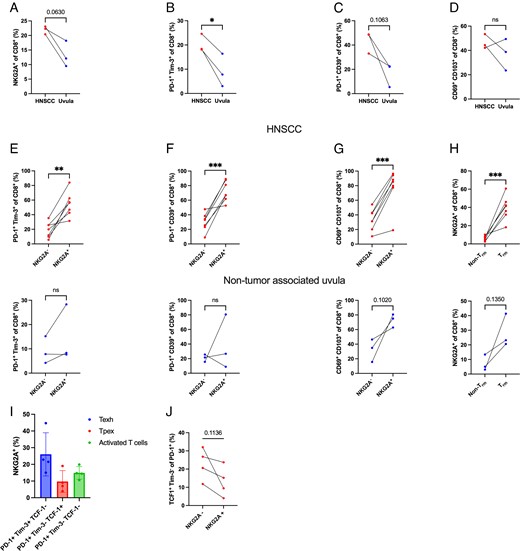
NKG2A+CD8+ TILs of HNSCC tumors coexpress tissue residency and exhaustion markers.
(A–D) Frequencies of (A) NKG2A+, exhaustion markers (B) PD-1+Tim-3+ and (C) PD-1+CD39+, and tissue-resident memory markers (D) CD69+CD103+ on CD8+ T cells from HNSCC and matching non–tumor-associated uvula specimens measured by flow cytometry. (E–G) Coexpression analysis of NKG2A+ with (E) PD-1+Tim-3+, (F) PD-1+CD39+, (G) CD69+CD103+ on CD8+ T cells from HNSCC and matching non–tumor-associated uvula specimens quantified by flow cytometry. (H) Coexpression analysis of Trm markers (CD69+CD103+) with NKG2A+ on CD8+ T cells from HNSCC and matching non–tumor-associated uvula specimens quantified by flow cytometry. (I) Frequencies of NKG2A+ in HNSCC CD8+ TIL subsets from terminally exhausted CD8+ T cells (Texh; PD-1+Tim-3+TCF-1−), progenitor exhausted CD8+ T cells (Tpex; PD-1+Tim-3−TCF-1+), and activated CD8+ T cells (PD-1+Tim-3−TCF-1−). (J) Coexpression analysis of NKG2A+ with progenitor exhausted markers (PD-1+Tim-3−TCF-1+) on CD8+ T cells from HNSCC specimens quantified by flow cytometry. Results are shown as mean ± SD. In (A)–(D), data were analyzed using a paired Student t test (n = 3). In (E)–(I), data were analyzed using a paired Student t test for HNSCC specimens (n = 7) and for non–tumor-associated uvula specimens (n = 3). *p < 0.05, **p < 0.01, ****p < 0.001.
TCM from head and neck cancer cell lines induce the expression of the inhibitory receptor NKG2A on human CD8+ T cells
Pathways that regulate the induction of NKG2A in human CD8+ T cells remain poorly understood. We hypothesized that a cancer cell product drove NKG2A expression on CD8+ T cells. To evaluate whether tumor cells can induce NKG2A expression, human CD8+ T cells were cocultured with head and neck cancer cell lines. The frequency of NKG2A+CD8+ T cells and NKG2A geometric mean fluorescence intensity (gMFI) were significantly increased compared with CD8+ T cells alone (Fig. 2A). Evaluation of cytokines previously reported to regulate NKG2A on mouse or human CD8+ T cells showed that IL-2 and IL-21 increased the frequency of NKG2A+ and NKG2A gMFI on activated human CD8+ T cells (Fig. 2B). Despite being reported to induce NKG2A (29–31), TGF-β did not affect the expression of NKG2A under our experimental conditions. TCM of head and neck cancer cell lines Cal27 and Detroit 562 were next collected to determine whether the NKG2A induction by head and neck cancer cells could be contact-independent and mediated by the effects of cancer cells to the TME. Human CD8+ T cells were activated in control media (cRPMI) or different ratios of cRPMI to TCM for 5 d. Culturing activated CD8+ T cells in TCM from either Cal27 or Detroit 562 HNSCC cells led to a significant induction of NKG2A on CD8+ T cells that was dependent on TCM concentration (Fig. 2C). Similarly, TCM from colorectal cancer cell lines HCT116, SNU-2404B, 2621B, and SW480, kidney cancer cell lines 786-0 and A498, and cervical cancer cell line HeLa induced the expression of NKG2A on CD8+ T cells (Fig. 2D). In contrast, TCM from breast cancer cell lines MCF-7 and T47D did not induce NKG2A in CD8+ T cells. To determine whether this effect was specific to conditioned media, we tested whether malignant ascites from colorectal cancer patients could promote NKG2A induction. Consistent with a cancer cell secreted factor, we observed that malignant ascites fluid was sufficient to induce the expression of NKG2A on CD8+ T cells (Fig. 2E).
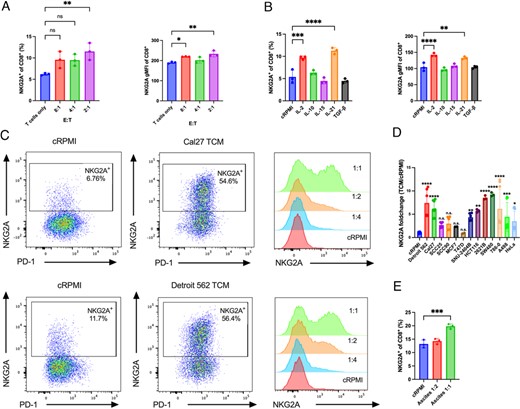
HNSCC cell lines Cal27 and Detroit 562 induce NKG2A expression on CD8+ T cells.
(A) CD8+ T cells derived from PBMCs of healthy donors and stimulated with CD3/CD28 were cocultured for 3 d with Cal27 cells at the corresponding E:T ratio, and the frequency levels of NKG2A+ and the NKG2A gMFI were determined by flow cytometry. (B) CD8+ T cells derived from PBMCs of healthy donors and stimulated with CD3/CD28 were cultured in the presence of the corresponding cytokine for 7 d, and the frequency levels of NKG2A+ and the NKG2A gMFI were determined by flow cytometry. (C) Flow cytometry plots display the frequency and expression level of NKG2A on CD8+ T cells derived from PBMCs and stimulated with CD3/CD28 and cultured for 5 d in cRPMI or tumor-conditioned media (TCM). (D) Fold change of the percentage of NKG2A+ T cells cultured in the corresponding TCM normalized to the percentage of NKG2A+CD8+ cultured in cRPMI. (E) Percentage of NKG2A+ of CD8+ cultured in cRPMI or malignant ascites of colorectal cancer patients. Data were quantified by FACS. In (A), (B), (D), and (E), results are shown as mean ± SD. Data were analyzed using one-way ANOVA with a Dunnett multiple comparisons test. Statistical analyses were performed on technical replicates for each independent experiment, and each experiment was performed three independent times. *p < 0.05, **p < 0.01, ****p < 0.001, ****p < 0.0001.
We next tested whether TCM affected the phenotype of CD8+ T cells. TCM did not change the differentiation stage of CD8+ T cells, as most T cells cultured in both cRPMI and Detroit 562 TCM presented an effector phenotype (Supplemental Fig. 2). TCM from both Cal27 or Detroit 562 cells increased both the frequency of NKG2A+CD8+ T cells and NKG2A gMFI (Fig. 3A, 3B). TCM was also sufficient to induce other markers expressed by NKG2A+CD8+ TILs from HNSCC patients, including a significant induction in the expression of exhaustion markers PD-1 (Fig. 3C, 3D) and CD39 (Fig. 3E, 3F), and the tissue-resident marker CD103 (Fig. 3G, 3H) after 5 d in culture. Detroit 562 TCM did not significantly change the frequency of CTLA+ or Lag3+ CD8+ T cells but significantly decreased the frequency of TIGIT+CD8+ T cells (Supplemental Fig. 3A–C). Conversely, Detroit TCM significantly increased the frequency of NKG2D+CD8+ T cells (Supplemental Fig. 3D). Detroit 562 TCM did not significantly change the frequency of T cells expressing NK cell markers NKG2C, CD16, CD56, NKp30, NKp46, or KIR3DL1 (Supplemental Fig. 3E–I). TCM from Detroit 562 TCM also did not change the frequency of Trm marker CD49a (Supplemental Fig. 3J). Lastly, increased NKG2A coincided with the induction of the NKG2A coreceptor CD94 (Supplemental Fig. 3K).

Cancer cell secretome induces expression of NKG2A, exhaustion markers, and tissue-resident memory markers on CD8+ T cells.
(A and B) Frequency of NKG2A+ and the NKG2A expression level. (C–H) Frequencies of exhaustion markers (C and D) PD-1+ and (E and F) CD39+, and the frequency of tissue-resident memory marker (G and H) CD103+ of CD3/CD28-stimulated CD8+ T cells derived from PBMCs and cultured for 5 d at different ratios of cRPMI to TCM. Data were quantified by FACS. Results are shown as mean ± SD. Data were analyzed using one-way ANOVA with a Dunnett multiple comparison test. Statistical analyses were performed on technical replicates for each independent experiment, and each experiment was performed three independent times. **p < 0.01, ****p < 0.001, ****p < 0.0001.
TCM-induced NKG2A expression is pH-independent and is mediated by a small and heat-stable factor
We next aimed to test whether TCM-induced expression of NKG2A on human CD8+ T cells was mediated by a cytokine or other small molecule. TCM was boiled to denature cytokines and proteins secreted by the cancer cells. Surprisingly, boiled TCM did not alter the induction of NKG2A when compared with control TCM (Fig. 4A). Boiling the TCM did, however, significantly reduce the induction CD103 (Fig. 4B), which is known to be regulated by TGF-β (35). TCM were next subject to centrifugal filtration to remove molecules >3 kDa. Similar to the boiled TCM, filtered TCM maintained a significant induction of NKG2A (Fig. 4C). Also similar to the boiled TCM, the filtered TCM had significantly reduced ability to induce the expression of CD103 (Fig. 4D). The pH for Detroit 562 TCM and Cal27 TCM was 6, whereas the pH for cRPMI was 7. We evaluated whether this change in pH contributed to the induction of NKG2A by adding the base KOH to neutralize the Cal27 TCM and Detroit 562 TCM. The neutralized TCM retained the ability to induce NKG2A on CD8+ T cells (Fig. 4E), while also retaining induction of CD103 (Fig. 4F). These effects to induce NKG2A appeared through transcriptional regulation. CD8+ T cells cultured in TCM, filtered TCM, or boiled TCM from Detroit 562 cells had higher expression of KLRC1 (gene for NKG2A) and ITGAE (gene for CD103) mRNA levels than did CD8+ T cells cultured in cRPMI. These results suggest that transcriptional induction of NKG2A can be regulated independently of cytokines by small molecules secreted by tumor cells.

Induction of NKG2A by TCM is mediated by a small and heat-stable factor and is pH-independent.
(A and B) Percentage of (A) NKG2A+ and (B) CD103+ of CD8+ T cells derived from PBMCs and stimulated with CD3/CD28 cultured for 5 d in cRPMI, TCM, or boiled TCM from Detroit 562 or Cal27 cells. (C and D) Percentage of (C) NKG2A+ and (D) CD103+ of CD8+ T cells derived from PBMCs and stimulated with CD3/CD28 cultured for 5 d in cRPMI, TCM, or filtered TCM from Detroit 562 or Cal27 cells. (E and F) Percentage of (E) NKG2A+ and (F) CD103+ of CD8+ T cells derived from PBMCs and stimulated with CD3/CD28 cultured for 5 d in cRPMI, TCM, or pH-neutralized TCM (TCM + KOH) from Detroit 562 or Cal27 cells. Data were quantified by FACS. Results are shown as mean ± SD. In (A)–(F), data were analyzed using one-way ANOVA with a Tukey multiple comparison test. In (G) and (H), the ratio is shown of the relative mRNA expression of (G) KLRC1 (gene for NKG2A) and (H) ITGAE (gene for CD103) normalized to T cells cultured in cRPMI. Data were quantified by quantitative PCR. Results are shown as mean ± SD. Statistical analyses were performed on technical replicates for each independent experiment, and each experiment was performed three independent times. *p < 0.05, **p < 0.01, ****p < 0.001, ****p < 0.0001.
TCM decrease mitochondrial respiration of CD8+ T cells
TILs often have impaired mitochondrial respiration that retrains effector function (35, 36). To test whether HNSCC cell TCM impaired T cell metabolism, CD8+ T cells were cultured for 7 d in cRPMI, Detroit 562 TCM + KOH, or Cal27 TCM + KOH. On day 7, extracellular flux analyses for mitochondrial function were performed. Activated CD8+ T cells cultured in either Detroit 562 TCM + KOH or Cal27 TCM + KOH had reduced basal mitochondrial respiration, maximal mitochondrial respiration, and spare respiratory capacity when compared with the T cells cultured in cRPMI (Fig. 5). These data show that TCM impair the mitochondrial respiration of human CD8+ T cells.
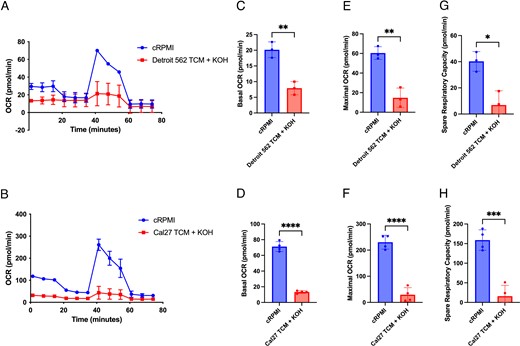
TCM decrease CD8+ T cell mitochondrial respiration.
CD8+ T cells derived from PBMCs were CD3/CD28 stimulated and cultured for 7 d in cRPMI or TCM. (A and B) Extracellular flux analyses were performed on CD8+ T cells cultured in (A) cRPMI or Detroit 562 TCM + KOH and (B) cRPMI or Cal27 TCM + KOH, showing the representative oxygen consumption rate (OCR) during a Mito Stress Test. (C and D) Basal respiration, (E and F) maximal respiration, and (G and H) spare respiratory capacity were quantified from the Mito Stress Test. Results are shown as mean ± SD. In (C)–(H), data were analyzed using a Student t test. Statistical analyses were performed on technical replicates for each independent experiment, and each experiment was performed three independent times. *p < 0.05, **p < 0.01, ****p < 0.001, ****p < 0.0001.
TCM reduce CD8+ T cell cytotoxicity
Because the expression of exhaustion markers increased on CD8+ T cells cultured in TCM, we next aimed to evaluate whether the presence of Detroit 562 TCM affected T cell effector function. Activated human CD8+ T cells were cultured for 7 d in cRPMI, TCM, filtered TCM, or the top TCM (containing molecules that did not pass the 3-kDa filter) and assessed for effector molecules. CD8+ T cells cultured in the presence of Detroit 562 TCM and filtered TCM had lower frequencies of IFN-γ+, TNF-α+, and IFN-γ+TNF-α+CD8+ cells (Fig. 6A–C). The top TCM did not reduce the frequency of IFN-γ+CD8+ cells but partially reduced the frequency of TNF-α+CD8+ cells. TCM, filtered TCM, and top TCM all reduced the frequency of perforin+CD8+ T cells (Fig. 6D). None of the TCM groups had a major reduction in the frequencies of granzyme B+CD8+ T cells, but the mean fluorescence of granzyme B was significantly reduced by TCM and filtered TCM, and by top TCM by a lower degree (Fig. 6E–G). The expression of CD107a was measured as a marker for CD8+ T cell degranulation. The frequency of CD107a+CD8+ T cells and the gMFI of CD107a was significantly decreased in the cells cultured in the Detroit 562 TCM when compared with the cells cultured in cRPMI (Fig. 6H, 6I). These data show that human CD8+ T cells cultured in TCM not only express exhaustion markers but also appear to have reduced T cell cytotoxicity.
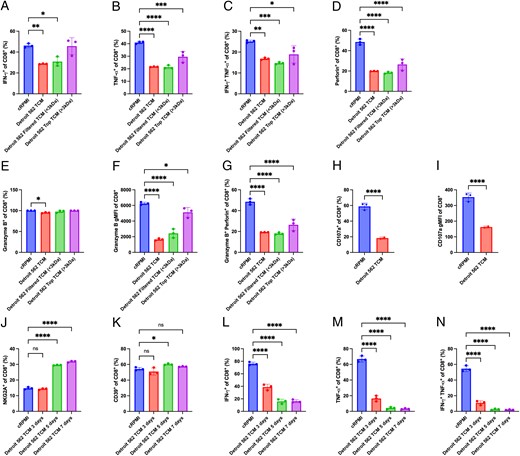
TCM reduce CD8+ T cell cytokines and degranulation.
CD8+ T cells derived from PBMCs were CD3/CD28 stimulated and cultured for 7 d in cRPMI, TCM, filtered TCM (<3 kDa), or top TCM (>3 kDa) from Detroit 562 cells. (A–G) At day 7, CD8+ T cells were stimulated with PMA/ionomycin for 4 h, and the percentage of (A) IFN-γ+, (B) TNF-α+, (C) IFN-γ+TNF-α+, (D) perforin+, (E) granzyme B+, and (G) granzyme B+perforin+ and the gMFI of (F) granzyme B were measured by flow cytometry. (H and I) CD8+ T cells derived from PBMCs were CD3/CD28 stimulated and cultured for 7 d in cRPMI or TCM, and the percentage (H) CD107a+ and the gMFI of (I) CD107a were determined by flow cytometry. (J–N) CD8+ T cells derived from PBMCs were CD3/CD28 stimulated and cultured for 7 d in cRPMI, 3, 5, or 7 d in TCM. At day 7, CD8+ T cells were stimulated with PMA/ionomycin for 4 h, and the percentages of (J) NKG2A+, (K) CD39+, (L) IFN-γ+, (M) TNF-α+, and (N) IFN-γ+TNF-α+ were measured by flow cytometry. Results are shown as mean ± SD. In (A)–(N), data were analyzed using one-way ANOVA with a Dunnett multiple comparison test. Statistical analyses were performed on technical replicates for each independent experiment, and each experiment was performed three independent times. *p < 0.05, **p < 0.01, ****p < 0.001, ****p < 0.0001.
Because T cell cytotoxicity was reduced when cultured in TCM for 7 d, we tested whether this could be rescued when T cells were exposed to TCM for a shorter time followed by culture in cRPMI. Removing the CD8+ T cells from the Detroit 562 TCM at day 3 prevented the induction of NKG2A, but exposure to TCM for 5 or 7 d led to a significant increase in NKG2A+CD8+ T cells (Fig. 6J). No significant differences were observed in the CD39 levels (Fig. 6K). Interestingly, 3- and 5-d exposure to Detroit 562 TCM followed by culture in cRPMI significantly reduced IFN-γ and TNF-α production, as shown by lower frequencies of IFN-γ+, TNF-α+, and IFN-γ+TNF-α+ CD8+ cells (Fig. 6L, 6M). These data show that CD8+ T cells exposed to TCM enter and maintain a dysfunctional state after only a 3 d exposure to TCM that cannot be readily rescued by removing the T cells from the TCM.
To directly evaluate whether CD8+ T cells cultured in TCM can kill cancer cells, we performed an in vitro killing assay. Human CD8+ T cells were CD3/CD28 activated and cultured for 5 d in cRPMI or TCM. At day 5, CD8+ T cells cultured in cRPMI or TCM were coculture with CD19+ Raji cells or Jurkat cells with or without an anti-CD19/anti-CD3 BiTE to redirect CD8+ T cells to target CD19+ cells. Significant decreases in both the number and percentage of Raji cells were observed when the Raji cells were cultured with cRPMI CD8+ T cells + anti-CD19/anti-CD3 BiTE (Fig. 7B, 7C). However, no significant differences in either the number or percentage of Raji cells were observed when these were cocultured with the TCM CD8+ T cells + anti-CD19/anti-CD3 BiTE (Fig. 7B, 7C). Similarly, no significant differences were observed in the number or percentage of Jurkat cells (CD19−) even in the presence of the anti-CD19/anti-CD3 BiTE (Fig. 7D). Altogether, these results show that a small molecule component of the cancer cell secretome promotes CD8+ T cell expression of NKG2A and reduces their ability to kill cancer cells.
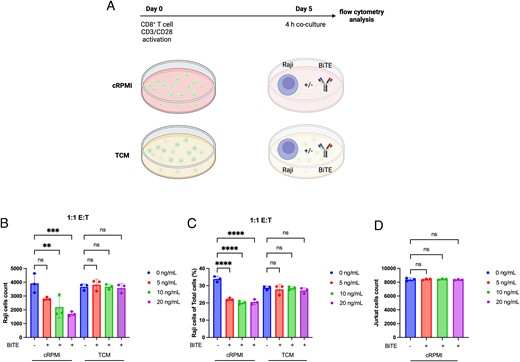
TCM prevent anti-CD3/anti-CD19 BiTE redirected tumor cell killing.
(A) Schematic of experimental design in which CD8+ T cells derived from PBMCs were CD3/CD28 stimulated and cultured for 5 d in cRPMI or TCM of Detroit 562 cells and cocultured with Raji or Jurkat cells with or without an anti-CD3/anti-CD19 BiTE for 4 h. (B–D) Number of Raji cells (B), percentage of Raji cells (C), or number of Jurkat cells (D) were quantified by flow cytometry. Statistical analyses were performed on technical replicates for each independent experiment, and each experiment was performed three independent times. Data were analyzed using one-way ANOVA with a Tukey multiple comparisons test. **p < 0.01, ***p < 0.001, ****p < 0.0001.
Discussion
Recent studies highlight the potential to target the inhibitory receptor NKG2A/CD94 as a novel immune checkpoint therapy for cancer patients (14, 26, 27). NKG2A+ TILs from HNSCC patients and non–small cell lung carcinoma coexpress other inhibitory receptors including PD-1, CTLA-4, and Lag3 (21, 29, 33). In this study, we examined NKG2A in HNSCC and show that a small molecule from the cancer cell secretome can induce NKG2A and dysfunction in human CD8+ T cells (Supplemental Fig. 4). Similar to other studies (29), HNSCC NKG2A+ TILs also express exhaustion markers Tim-3 and CD39 that are associated with a terminally exhausted phenotype. In addition, previous studies have observed that NKG2A+ TILs coexpress the tissue-resident marker CD103 (21, 33, 37) and Hobit, a transcription factor that promotes tissue residency, in a single-cell RNA sequencing analysis of NKG2A+ clusters (29). HNSCC NKG2A+ TILs coexpress tissue-resident markers CD69 and CD103. These data suggest that HNSCC NKG2A+ TILs are CD39+CD103+, a population that has been shown to be enriched for tumor-reactive cells and correlate with better overall survival in HNSCC (38). Interestingly, a small subset of NKG2A+CD8+ TILs are also PD-1+TCF1+, which are common markers of stem-like cells with some exhaustion features. This NKG2A+TCF1+ population may play a role maintaining the NKG2A+CD8+ T cell population in tumors. The TCF1+PD-1+ T cell population has been shown to be important for the response to PD-1 blockade therapies in preclinical models and has been correlated with a better response in cancer patients (39). Collectively, these findings suggest that immunotherapies targeting NKG2A could result in significant antitumor activity from these potentially tumor-specific T cells.
Several studies have shown that TILs have increased NKG2A expression across multiple cancer types (21, 25, 30, 33, 40), but mechanisms of NKG2A induction have been uncertain. Previous studies on human CD8+ T cells have shown that cytokines IL-12, IL-15, and TGF-β may contribute to the expression of NKG2A in vitro (11, 30, 32), and coculture of T cells with cancer-associated fibroblasts can increase the frequency of NKG2A+CD103+CD8+ T cells (41). In addition to cytokines, however, small molecules or altered metabolites in the TME may contribute to NKG2A induction. In this study, we evaluated the contributions of cancer cells to the regulation of NKG2A and showed that the secretome of cancer cell lines contains small molecule factors that lead to a significant upregulation of NKG2A at the transcriptional level. The TCM induction of NKG2A on CD8+ T cells appeared to be mediated by a heat-stable molecule, <3 kDa, and is pH-independent. TCM of freeze-thaw killed cancer cells were unable to induce NKG2A (data not shown). These data suggest that live cancer cells are required, but further studies are needed to confirm whether a particular type of cancer cell death may contribute to NKG2A induction. These findings suggest a novel mechanism by which the cancer cell secretome can promote the expression of inhibitory receptors on CD8+ T cells and contribute to the process of tumor immune evasion. Further studies are required to identify what specific molecule or molecules in the TCM are regulating the expression of NKG2A and whether this molecule also regulates other inhibitory receptors and exhaustion markers commonly observed in TILs of cancer patients. Identifying what is regulating NKG2A, and potentially other inhibitory receptors, may suggest novel targets for cancer therapies or biomarkers for patients who may benefit from checkpoint blockade therapies targeting the NKG2A/CD94:HLA-E axis.
CD8+ T cells cultured in TCM from cancer cell lines have impaired mitochondrial respiration as observed by a reduction in the basal and maximal oxygen consumption rate. This is consistent with previous studies that have demonstrated how TILs have impaired mitochondrial respiration (35, 36). We also show that CD8+ T cells cultured in TCM also expressed exhaustion markers such as PD-1, Tim-3, CD39, and NKG2A. Furthermore, CD8+ T cells cultured in TCM also produced less IFN-γ and TNF-α, had lower expression of perforin, and had lower expression of the degranulation marker CD107a. Interestingly, the TCM did not reduce the frequency of granzyme B+CD8+ T cells but significantly reduced the granzyme B expression level. This was consistent with previous reports that TILs can retain some cytotoxic capacity, including the production of granzyme B, despite having exhaustion markers such as Tim-3 and CD39 (29, 42). A similar reduction in cytotoxicity was observed on T cells cultured in the filtered TCM, suggesting that this is being mediated by a small molecule rather than inhibitory cytokines secreted by cancer cells. On top of replicating the exhausted phenotype of TILs, TCM also led to a significant increase of the tissue-resident marker CD103. The induction of CD103 was significantly decreased with the filtering and boiling of the TCM presumably by eliminating the effects of cytokines, such as TGF-β, that are known to regulate CD103 expression (34). To evaluate the antitumor cytotoxicity of CD8+ T cells cultured in TCM, we use an anti-CD3/anti-CD19 BiTE to redirect T cells to target CD19+ tumor cells. CD8+ T cells cultured in cRPMI killed CD19+ Raji cells in the presence of the anti-CD3/anti-CD19 BiTE, whereas no killing was observed by the CD8+ T cells cultured with TCM. Along with the expression of inhibitory receptors and the decrease in the production of cytokines and cytotoxic granules, the inability of CD8+ T cells to kill cancer cells in the presence of a BiTE supports a mechanism in which tumor cells induce T cell dysfunction and prevent their ability to respond to BiTE therapies through the secretion of small molecules.
Altogether, these data support a mechanism that generates NKG2A+CD8+ T cells in vitro that shares phenotypic characteristics of NKG2A+CD8+ TILs from HNSCC patients. Using TCM to generate human NKG2A+CD8+ T cells from PBMCs provides a way to further characterize this T cell subset, as well as a way to evaluate current and novel molecules targeting this inhibitory receptor. In addition, these data provide a novel method to generate exhausted-like T cells in vitro that can be used to perform time course experiments to evaluate how T cells transition into a dysfunctional state. It would be interesting to evaluate whether human T cells share the epigenetic regulations observed in mouse T cells, in which TILs enter a plastic and initially reprogrammable dysfunctional stage, and eventually transition into a fixed dysfunctional stage (43). Future studies can evaluate the effects of culturing other types of immune cells such as Th cells, regulatory T cells, NK cells, NKT cells, macrophages, and dendritic cells in the presence of TCM to see whether they also present similar phenotypes to each respective cell type in cancer patients.
Disclosures
J.C.R. is a founder and scientific advisory board member of Sitryx Therapeutics. Y.J.K. is an employee of Regeneron. The other authors have no financial conflicts of interest.
Acknowledgments
We thank members of the Jeffrey C. Rathmell, W. Kimryn Rathmell, and Young J. Kim laboratories for constructive input.
References
Footnotes
This work was supported by National Institutes of Health Grants R01CA217987 and R01HL136664 (to J.C.R.), R01DE027749 (to Y.J.K.), and T32AI138932 (to G.J.R.).
The online version of this article contains supplemental material.
Abbreviations used in this article:
