


Abstract
Cardiac rejection and infection are the leading causes of morbidity and mortality after transplant representing with similar non-specific symptoms. Early discrimination is crucial yet challenging. We proposed that aberrant serum cytokine portraits exist in pulmonary infection and allograft rejection, and such profiles might aid in timely differential diagnosis.
Lewis rat received Wistar rat heart allografts. Allograft rejection (n = 5) and pulmonary infection (n = 7) were induced via cessation of cyclosporine injection and intratracheal inoculation of Pseudomonas aeruginosa, respectively, and pathologically confirmed. A non-rejection and non-infection group (n = 5) was served as healthy controls. The circulating cytokine profiles of the study objects were then simultaneously measured using a multiplex quantitative cytokine array.
Thirteen cytokines [B7-2, β-nerve growth factor (NGF), chemokine (C-X3-C motif) ligand 1 (Fractalkine), granulocyte-macrophage colony-stimulating factor (GM-CSF), interferon gamma (IFN-γ), interleukin beta (IL-β), IL-2, IL-4, IL-10, chemokine (C-X-C motif) ligand 5 (LIX), L-selectin, chemokine (C–C motif) ligand 2 (MCP-1), brain creatine kinase (TCK-1) and tumour necrosis factor alpha (TNF-α)] were up-regulated in allograft rejecting animals. Among them, B7-2, β-NGF, Fractalkine, GM-CSF, IFN-γ, IL-β, IL-2, IL-4, LIX, MCP-1 and TCK-1 were significantly increased compared with infection rats (all P-values <0.05). B7-2, CNIC-1 and CNIC-2 were increased in infection animals when compared with healthy controls (900.85 ± 259.30 vs 175.04 ± 161.07 pg/ml, 319.68 ± 264.91 vs 13.50 ± 0.00 pg/ml and 51.424 ± 29.51 vs 5.24 ± 1.30 pg/ml, respectively, all P-values <0.05).
The present study demonstrated fluctuations in circulating cytokine portraits in cardiac allograft rejection and bacterial pulmonary infection after transplant. Such disease-specific cytokine patterns might facilitate early discrimination between rejection and infection.
INTRODUCTION
Cardiac allograft rejection and infection remain significant sources of morbidity and mortality after heart transplantation, accounting for nearly 40% of reported deaths during the first post-transplant year [1–3]. Both entities are inflammatory processes representing with similar, non-specific symptoms such as fatigue, dyspnoea and low-grade fever at early stage, and their clinical management is closely intertwined. An immunosuppressive agent used to prevent or treat allograft rejection can result in progression of an existing infection and/or an increased risk of a new infection. On the other hand, the tapering of immunosuppressant as part of the treatment of infection may exacerbate allograft rejection.
To improve the prevention and treatment of infection complicating cardiac allograft rejection, the pathogenesis, progression and interaction of rejection and infection need to be extensively explored. Recently, we developed a rat model of pulmonary infection after heterotopic cardiac transplantation [4]. On the basis of this animal model, the present study utilized a multiplex detection system to illustrate circulating cytokine portraits liberated during the course of cardiac allograft rejection and lung infection, so that might help in the understanding of the complex interaction between pulmonary infection and immune rejection in the context of cardiac transplantation.
MATERIALS AND METHODS
Animal model and study design
Inbred male rats, weighing 200–250 g, were purchased from SLAC Laboratory (Shanghai, China), maintained under standard conditions and allowed to drink water and eat rodent chow ad libitum. Twenty-one Wistar rats served as donors and 21 Lewis rats served as recipients. The protocol described in the current study was approved by the Animal Care and Use Committee of Zhongshan hospital, Fudan University. Throughout the study, every effort was taken to minimize any suffering of the animals.
Cardiac transplant and pulmonary bacterial infection induction were performed as reported [4]. Animals were anaesthetized with 40 mg/kg of intraperitoneal pentobarbital. After heparinization with 1000 units of unfractionated heparin, donor heart was procured and placed in an iced lactated Ringer's solution. The coronary circulation was immediately flushed with 10 ml of cold lactated Ringer's solution. After preparation of the donor heart for transplantation which entails ligation of the main pulmonary artery, superior vena cava and inferior vena cava (IVC), creation of a right atriotomy and an atrial septal defect, disruption of the tricuspid valve leaflets and en bloc ligation of the pulmonary vessels, the donor ascending aorta was anastomosed to the recipient abdominal aorta with a running 8-0 prolene suture. Similarly, the donor right atrium was anastomosed to the recipient IVC. Upon re-establishment of blood flow, transplanted heart resumed spontaneous contractions in sinus rhythm, and was free of gross surgical injury at the time of closure.
Via a tracheostomy, 0.2 ml of Pseudomonas aeruginosa ATCC 27853 (1 × 10⁹ CFUs/ml, American Type Culture Collection, Manassas, VA, USA) was injected into the stem bronchus of recipient animals assigned to the infection group under direct vision to induce bacterial pneumonia, whereas 0.2 ml of normal saline was injected into the stem bronchus of recipient animals assigned to the control group under direct vision.
All recipient animals were started on daily cyclosporine A (CSA) injection (10 mg/kg/day subcutaneously) to suppress rejection on postoperative day (POD) 0, and were then randomized to three groups (each group contains seven rats) as follows: On POD 6, all recipient animals were randomized to either have their CSA continued (non-rejection animals) or have their CSA discontinued, and began on a normal saline placebo injection (10 mg/kg/day subcutaneously, rejection group). On POD 13, non-rejection animals were further randomized to receiving intratracheal inoculation of either P. aeruginosa (infection group) or normal saline (control group). Rejection rats received intratracheal inoculation of normal saline on POD 13 as well.
Graft viability was assessed daily by palpation of the donor heart. Rejection was defined as cessation of a palpable heartbeat and was confirmed by direct inspection at laparotomy upon organ harvest. Animals were sacrificed on POD 14; lungs and transplanted hearts were procured after blood withdrawals. Cross-sections of the heart and lung preserved in 10% buffered formalin for haematoxylin and eosin stain were blindly assessed by a pathologist as previously described [4].
Measurement of cytokines
Peripheral blood samples were obtained from all animals upon harvest on POD 14. After being allowed to clot at room temperature for 1 h, peripheral blood samples were centrifuged at 1500 × g for 10 min. All sera were stored at −80°C until use.
Serum levels of 27 cytokines, including T-lymphocyte activation antigen CD86 (B7-2), β nerve growth factor (β-NGF), cytokine-induced neutrophil chemoattractant 1 (CINC-1), CINC-2, CINC-3, ciliary neurotrophic factor (CNTF), chemokine (C-X3-C motif) ligand 1 (Fractalkine), granulocyte-macrophage colony-stimulating factor (GM-CSF), intercellular adhesion molecule 1 (ICAM-1), interferon gamma (IFN-γ), interleukin 1 alpha (IL-1α), IL-β, IL-2, IL-4, IL-6, IL-10, IL-13, chemokine (C-X-C motif) ligand 5 (LIX), L-selectin, chemokine (C–C motif) ligand 2 (MCP-1), platelet-derived growth factor alpha polypeptide (PDGF-AA), prolactin receptor (Prolactin R), MOK protein kinase (RAGE), brain creatine kinase (TCK-1), TIMP metallopeptidase inhibitor 1 (TIMP-1), tumour necrosis factor alpha (TNF-α) and vascular endothelial growth factor (VEGF) were measured by Quantibody Rat Cytokine Array 3 (RayBiotech, Norcross, GA, USA) per the manufacturer's protocol. Briefly, after 30-min incubation with sample diluent, the glass chips were washed, and each well, arrayed with cytokine antibodies, was overlaid with 100 µl standard cytokines or sera. After overnight incubation at 4°C and extensive washing, the detector antibody was added for 1 h, washed away and Cy3 equivalent dye-conjugated streptavidin was added for 1 h at room temperature. The signals were scanned with an LuxScan-10K/A microarray scanner (CapitalBio, Beijing, China). The actual cytokine concentration was quantified with Q-Analyzer Software (RayBiotech) according to the standard curve set for each cytokine. For precaution of interassay variations, cytokine levels were measured using the Quantibody array kit from the same shipment under the same laboratory conditions.
Statistical analysis
A minimum sample size of five per group was determined based on our pilot proteomic experiment and prior publication [5], in which a minimum of three specimens per group demonstrated adequate statistical power. This number is also well within the estimated sample size for proteomic profiling experiments [6]. Study animals were randomized using a random allocation software (http://mahmoodsaghaei.tripod.com/Softwares/randalloc.html). For statistical analysis, samples with cytokine levels below the detection limits were arbitrarily assigned to the values with half the detection limit. Data were analysed using IBM SPSS Statistics (Armonk, NY, USA) for Mac V22.0 and GraphPad Prism (La Jolla, CA, USA) for Mac V6.0, and tested for normality using the Kolmogorov–Smirnov normality test. Statistical significance of differences among the group was determined by the one-way ANOVA (for normal distribution data) or Kruskal–Wallis (for non-normal distribution data) test as appropriate. Bonferroni-corrected post hoc test was conducted to adjust the observed significant level for multiple comparisons if the null hypothesis was rejected. Data are expressed as mean ± standard deviation (SD). Two-sided P-values less than 0.05 were considered to be significant.
RESULTS
All the seven animals from the infection group survived the experiment. Two deaths occurred in each of the rejection group and control group before procurement. Thus, the specimens procured consisted of seven infection animals, five rejection animals and five controls.
Development of allograft rejection and pulmonary infection
Daily pulsatility check found that the transplanted heartbeat of the non-rejection animals remained energetic throughout the study period, whereas in the rejection group the transplanted heart gradually lost its contractions over time after CSA cessation.
Histology of cardiac grafts showed normal staining patterns, with no evidence of interstitial oedema or inflammation [International Society of Heart and Lung Transplantation (ISHLT) system for rejection grade 0 R] in non-rejection animals, whereas all allografts of the rejection group were confirmed of rejection with diffuse inflammatory process and necrosis (ISHLT grade 3 R).
Animals assigned to the infection group had severe pneumonia with alveolar septal congestion, oedema, focal alveolar haemorrhage and infiltration of neutrophils and macrophages, whereas minimal histological changes were found in the non-infection animals.
Cytokine profile in cardiac rejection animals
Serum levels of 27 cytokines were analysed simultaneously. Levels of IL-13, RAGE and VEGF were below the detection limits; there were no differences found among the three groups. The statistical significant differences were reached in 18 cytokines (B7-2, β-NGF, CINC-1, CINC-2, CINC-3, Fractalkine, GM-CSF, IFN-γ, IL-β, IL-2, IL-4, IL-10, LIX, L-selectin, MCP-1, Prolactin R, TCK-1 and TNF-α) among the groups (all P < 0.05; Table 1). Of them, post hoc comparison revealed 13 cytokines (B7-2, β-NGF, Fractalkine, GM-CSF, IFN-γ, IL-β, IL-2, IL-4, IL-10, LIX, MCP-1, TCK-1 and TNFα) significantly up-regulated in the rejection group when compared with the control (Figs 1 and 2). Eleven out of these 13 cytokines (B7-2, β-NGF, Fractalkine, GM-CSF, IFN-γ, IL-β, IL-2, IL-4, LIX, MCP-1 and TCK-1) were up-regulated in the rejection group, when compared with the infection group (Fig. 1).
Serum cytokine levels in study animals
| Cytokine | Rejection group (n = 5) | Infection group (n = 7) | Control group (n = 5) | P-valuea |
|---|---|---|---|---|
| B7-2 | 1874.16 ± 761.73 | 900.85 ± 259.30 | 175.04 ± 161.07 | 0.002 |
| β-NGF | 201.35 ± 75.11 | 91.56 ± 45.69 | 56.52 ± 18.48 | 0.009 |
| CINC-1 | 139.73 ± 68.05 | 319.68 ± 264.91 | 13.50 ± 0.00 | 0.004 |
| CINC-2 | 44.83 ± 13.54 | 51.424 ± 29.51 | 5.24 ± 1.30 | 0.006 |
| CINC-3 | 9.54 ± 2.72 | 12.36 ± 9.68 | 6.36 ± 0.06 | 0.031 |
| CNTF | 60.14 ± 88.38 | 36.84 ± 30.58 | 13.5 ± 0.00 | 0.172 |
| Fractalkine | 621.94 ± 385.20 | 146.25 ± 144.47 | 24.78 ± 9.92 | 0.017 |
| GM-CSF | 165.13 ± 113.06 | 35.42 ± 32.13 | 11.35 ± 4.41 | 0.012 |
| ICAM-1 | 1326.56 ± 555.16 | 921.47 ± 507.30 | 739.14 ± 416.59 | 0.199 |
| IFN-γ | 73.42 ± 44.49 | 8.76 ± 7.56 | 3.68 ± 1.73 | 0.013 |
| IL-1α | 26.79 ± 30.19 | 9.97 ± 6.33 | 7.00 ± 0.00 | 0.613 |
| IL-1β | 846.48 ± 489.77 | 295.31 ± 166.85 | 170.39 ± 161.54 | 0.029 |
| IL-2 | 613.16 ± 258.87 | 342.11 ± 124.17 | 210.4 ± 88.88 | 0.031 |
| IL-4 | 21.04 ± 10.80 | 9.13 ± 2.83 | 4.27 ± 1.83 | 0.002 |
| IL-6 | 352.38 ± 235.80 | 167.69 ± 259.23 | 297.21 ± 220.74 | 0.176 |
| IL-10 | 1322.36 ± 747.08 | 805.53 ± 351.26 | 115.04 ± 132.06 | 0.005 |
| IL-13b | 3.50 ± 0.00 | 3.50 ± 0.00 | 3.50 ± 0.00 | 1.000 |
| LIX | 984.00 ± 444.59 | 538.24 ± 88.57 | 172.00 ± 30.77 | 0.005 |
| L-selectin | 100.49 ± 37.17 | 80.22 ± 47.46 | 44.63 ± 5.78 | 0.015 |
| MCP-1 | 1300.60 ± 317.54 | 729.47 ± 82.50 | 604.92 ± 14.78 | 0.001 |
| PDGF-AA | 208.00 ± 23.13 | 202.56 ± 21.31 | 183.50 ± 8.54 | 0.076 |
| ProlactinR | 621.20 ± 1337.61 | 23.00 ± 0.00 | 178.18 ± 129.53 | 0.026 |
| RAGEb | 6.75 ± 0.00 | 6.75 ± 0.00 | 6.75 ± 0.00 | 1.000 |
| TCK-1 | 1073.92 ± 449.55 | 477.15 ± 56.02 | 352.43 ± 5.62 | 0.003 |
| TIMP-1 | 5371.10 ± 3086.37 | 2178.96 ± 649.25 | 1750.58 ± 1425.59 | 0.064 |
| TNF-α | 51.54 ± 34.15 | 21.80 ± 18.00 | 1.24 ± 0.95 | 0.004 |
| VEGFb | 0.25 ± 0.00 | 0.25 ± 0.00 | 0.25 ± 0.00 | 1.000 |
Data are presented as mean ± SD in pg/ml.
β-NGF: β-nerve growth factor; CINC-1: cytokine-induced neutrophil chemoattractant 1; CNTF: ciliary neurotrophic factor; Fractalkine: chemokine (C-X3-C motif) ligand 1; GM-CSF: granulocyte-macrophage colony-stimulating factor; IFN-γ: interferon gamma; PDGF-AA: platelet-derived growth factor alpha polypeptide; IL-β: interleukin beta; RAGE: MOK protein kinase; IL: interleukin; Prolactin R: prolactin receptor; LIX: chemokine (C-X-C motif) ligand 5; TCK-1: brain creatine kinase; MCP-1: L-selectin, chemokine (C–C motif) ligand 2: TNF-α: tumour necrosis factor alpha; VEGF: vascular endothelial growth factor; TIMP-1: TIMP metallopeptidase inhibitor 1.
aKruskal–Wallis test.
bCytokine levels below the detection limits were arbitrarily assigned to the values with half the detection limit.
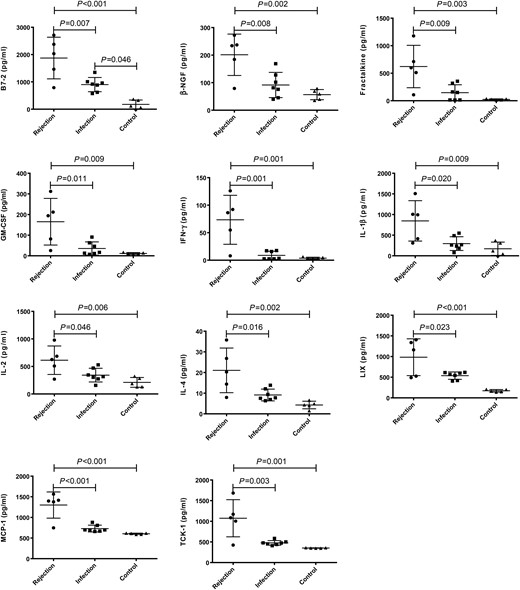
Comparison of serum levels of B7-2, β-NGF, Fractalkine, GM-CSF, IFN-γ, IL-β, IL-2, IL-4, LIX, MCP-1 and TCK-1 in the groups of rejection (n = 5), infection (n = 7) and control (n = 5). The P-values less than 0.05 were labelled in the figure. P-values less than 0.001 were labelled as P < 0.001. The horizontal bars denote means, and the error bars denote standard deviation. β-NGF: β-nerve growth factor; Fractalkine: chemokine (C-X3-C motif) ligand 1; GM-CSF: granulocyte-macrophage colony-stimulating factor; IFN-γ: interferon gamma; IL-β: interleukin beta; IL: interleukin; LIX: chemokine (C-X-C motif) ligand 5; MCP-1: L-selectin, chemokine (C–C motif) ligand 2; TCK-1: brain creatine kinase.
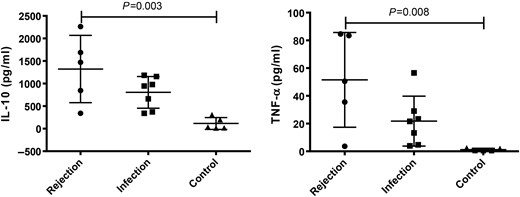
Comparison of serum levels of IL-10 and TNF-α in the groups of rejection (n = 5), infection (n = 7) and control (n = 5). The P-values less than 0.05 were labelled in the figure. The horizontal bars denote means, and the error bars denote standard deviation. IL: interleukin; TNF-α: tumour necrosis factor alpha.
Cytokine profile in pulmonary infection animals
Of the 18 significantly changed cytokines, post hoc test found no statistical difference except for the levels of three cytokines (B7-2, CINC-1 and CINC-2) that were remarkably increased in the infection group, when compared with the control (P = 0.046, 0.032 and 0.027, respectively, Fig. 3). While the rejection group had the highest B7-2 concentrations in all the three groups (P < 0.001 compared with control animals, and P = 0.007 compared with infection animals), the levels of CINC-1 and CINC-2 were not statistically different between the groups of rejection and control although numerically higher in the rejection group.
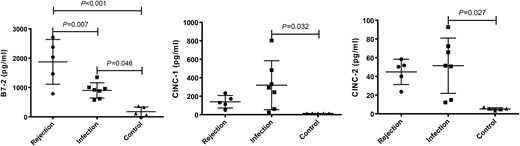
Comparison of serum levels of B7-2, CINC-1 and CINC-2 in the groups of rejection (n = 5), infection (n = 7) and control (n = 5). The P-values less than 0.05 were labelled in the figure. P-values less than 0.001 were labelled as P < 0.001. The horizontal bars denote means, and the error bars denote standard deviation. CINC-1: cytokine-induced neutrophil chemoattractant 1.
DISCUSSION
Currently, cardiac transplantation is the only established treatment for selected patients with end-stage heart disease. Immune rejection and infection are parallel immunological processes that lead to frequent, serious complications after heart transplantation causing significant morbidities and mortalities. Although regimens have been continuously developed, the clinical outcomes are still far from satisfactory. The pathophysiology and the underlying mechanisms of infection and rejection after heart transplant need to be elucidated. As both entities are inflammatory processes representing with similar, non-specific symptoms during early stage, differentiating rejection and infection upon disease onset is often challenging from the clinical prospective. Endomyocardial biopsy, while remaining the current gold standard for cardiac cellular rejection, is however invasive and biased [7, 8]. Although the expression profile assay of peripheral blood has recently been instituted for acute cardiac rejection surveillance [9], little has been done for the circulatory cytokine profiling of infection complicating cardiac allograft rejection especially at early stage of disease onset.
The present study utilized an original coexisting lung infection and heart transplantation animal model, in which ISHLT 3R grade cardiac rejection and severe bacterial pneumonia were reliably induced. Intrabronchial P. aeruginosa inoculation was selected in the present study, for lung is the most common site of infections after heart transplant [10, 11], and P. aeruginosa is one of the most common pathogens causing pulmonary infection during the early postoperative period in heart-transplanted patients who receive immunosuppression agents [12]. Furthermore, the pulmonary infection could always be modulated as desired by adjusting the pathogen type, inoculating dosage and timing, so that we believe this animal modelling could offer an effective methodological platform for lung infection–cardiac rejection research.
The assessment of 27 cytokines in the serum of cardiac allograft rejection animals revealed 13 cytokines (B7-2, β-NGF, Fractalkine, GM-CSF, IFN-γ, IL-β, IL-2, IL-4, IL-10, LIX, MCP-1, TCK-1 and TNFα) that were significantly up-regulated in comparison with the health control. Of them, levels of B7-2, β-NGF, Fractalkine, GM-CSF, IFN-γ, IL-β, IL-2, IL-4, LIX, MCP-1 and TCK-1 were also remarkably increased when compared with the bacterial pulmonary infection animals, yet these 11 cytokines did not differentiate the infection animals from health controls. On the other hand, cytokines of B7-2, CNIC-1 and CNIC-2 differentiated infection animals from health controls, and in particular, B7-2 was found differently expressed in all the three groups. These findings mirror recent reports that aberrant serum gene and cytokine portraits exist in cardiac allograft rejection, and support our hypothesis that circulating cytokine profiling not only could help monitoring acute allograft rejection, but also might have the potential to differentiate infection from allograft rejection at the early stage of disease onset.
In the panel of cytokines that could help to discriminate between infection and rejection, B7-2 protein is expressed by antigen-presenting cells, and it is the ligand for two proteins at the cell surface of T cells, CD28 antigen and cytotoxic T-lymphocyte-associated protein 4 (CTLA4). Binding of this protein with CD28 antigen is a co-stimulatory signal for activation of the T cell. Binding of this protein with CTLA4 negatively regulates T-cell activation and diminishes the immune response. Thus, B7-2 plays a critical role in T-cell activation and proliferation. B7-2 is strongly expressed on endothelial cells and infiltrating mononuclear cells of the cardiac allograft within 24 h post-transplant [13], and blockade of the B7/CD28 co-stimulation pathway has been shown to prolong cardiac allograft survival in numerous rodent models [14, 15]. In a lung transplant mice model [16], P. aeruginosa airway infection induced sharply up-regulation of B7 molecules of CD80 and CD86. The B7/CD28 pathway then enhanced CD4(+) T-cell activation and intragraft IL-2(+), IFN-gamma(+) and IL-17(+) T-lymphocyte accumulation and triggered allograft rejection. B7 blockade prevented lung rejection without affecting clearance of this pathogen. Taken together, these data suggest that B7/CD28 co-stimulation pathway is functionally important in both acquired and innate immunological responses in the context of cardiac allograft transplantation.
In addition to B7-2, levels of β-NGF, Fractalkine, GM-CSF, IFN-γ, IL-β, IL-2, IL-4, LIX, MCP-1 and TCK-1 were also increased in rejection animals than in infection animals. Among them, β-NGF has nerve growth stimulating activity that might promote and direct regrowth and axonal sprouting of cardiac nerves to restore innervation in the transplanted heart in which the autonomous nervous system was impaired due to the surgical interruption [17]; Fractalkine belongs to the chemokine family whose expression was found negligible in non-rejecting cardiac isografts, but was significantly enhanced in rejecting allografts, and its blockage significantly prolonged allograft survival, suggesting a critical role for Fractalkine in the pathogenesis of acute rejection [18, 19]. IL-1β is produced by macrophages as an important mediator of the inflammatory response, and is involved in a variety of cellular activities, including cell proliferation, differentiation and apoptosis. IL-2 is produced by T-cells in response to antigen or mitogen stimulation, which is important for the proliferation of T- and B-lymphocytes. IL-4 is a Th2-type cytokine involved in the inflammatory response in eosinophils. IL-1β and IL-2 are increased in heart transplant patients [20]. After in vitro challenge with donor antigens, levels of IL-2 and IL-4 mRNA and protein were increased [21], whereas IL-2 is specifically involved in cardiac rejection, IL-4 may play a role in immune responses leading to graft rejection or graft tolerance [22]. LIX is a member of the chemokine subfamilies that recruit and activate leucocytes and to have homeostatic and inflammatory functions. In mouse, deficiency of this gene is associated with increased lung inflammation. MCP-1 is a monocyte chemoattractant protein involved in inflammatory processes of cardiac allografts undergoing chronic rejection [23]. Serum levels of CNIC-1 and CNIC-2 were significantly increased in the pulmonary infection group. This result is reasonable as both cytokines are neutrophil chemoattractant that play key roles in the acute phase of inflammatory response, and particularly, CNIC-2 chemokine is involved in the pulmonary inflammatory response [24, 25].
The present study should be viewed in the light of its limitations. The descriptive nature of the study withheld affirmative causal conclusion, as such future functional studies are warranted to clarify the detailed mechanism of specific cytokine signalling related to the lung infection and allograft rejection. In addition, cytokines examined in the study represent a small fraction of hundreds or thousands molecules involved in the related immunological responses. More importantly, the reported findings describe only one time-point results statically. As the immunological responses involved in rejection and infection are complex even when simplified to a particular animal model and to a specific pathogen, the findings should be further evaluated dynamically.
In summary, using a quantitative rat cytokine array, the present study illustrated the turbulence of circulating cytokine portraits in bacterial pulmonary infection and cardiac allograft rejection after transplant, which might help to improve the understanding of the aetiology, evolution and therapeutics of these entities. A panel of serum cytokines that might aid the differential diagnosis between pulmonary infection and allograft rejection was also detected. Future studies are warranted to investigate the cytokines associated signalling pathways that could shed light on the associated molecular mechanisms.
Funding
This work was supported by research grants (10PJ1403600, SKW1311) from the Science and Technology Commission of Shanghai Municipality and the National Natural Science Foundation of China (81470282 and 81170473).
Conflict of interest: none declared.
ACKNOWLEDGEMENTS
The authors thank Xueping Fan for her invaluable technical support. This study was undertaken at the Biomedical Research Center of Shanghai Zhongshan Hospital Fudan University, Shanghai, China.
REFERENCES
Author notes
The first two authors contributed equally to this work.
