


Abstract
We retrospectively compared the haemodynamic performance of the BioValsalva (BV) and BioIntegral (BI) biological aortic-valved conduits in the aortic root position.
Between July 2008 and June 2014, a total of 55 patients underwent aortic root replacement using the BV conduit (n = 27) or the BI conduit (n = 28). The primary study endpoints were haemodynamic performance during follow-up, including mean pressure gradients (MPGs) and effective orifice areas (EOAs). Secondary study endpoints were early postoperative outcomes within 30 days and survival.
Both groups did not differ in regard to demographics (BV: median age 71 years, 70.4% female; BI: median age 66 years, 85.7% female, P = 0.15 and P = 0.17) and risk profile (median EuroSCORE-II BV: 3.8 vs 5.3% for BI, P = 0.38). A total of 20% of the total patients (BV 5/27, 18.5% vs BI 6/28, 21.4%) presented with acute type-A aortic dissection. During follow-up, both groups showed no difference in MPGs for all valve sizes [BV, 11.0 mmHg (8.3–14.8 mmHg) vs BI, 11.5 mmHg (9.0–13.0), P = 0.82]. Similar results were achieved for EOAs for all valve sizes [BV, 1.85 cm2 (1.55–2.21) vs BI, 1.80 cm2 (1.64–1.83), P = 0.24]. Moreover, there was no statistically significant difference in aortic regurgitation (AR) with none/trace AR in (21/23) 91.3% in BV patients versus (16/21) 76.2% in BI patients (P = 0.23) at follow-up. Both groups showed a high rate of concomitant procedures (BV: 59.3% vs BI: 71.4%, P = 0.40) and emergency indication (BV: 18.5% vs BI: 21.4%, P = 0.79), resulting in an overall 30-day mortality rate of 7.3% (4/55 patients).
The present small single-centre study is one of the first to evaluate and compare the BioValsalva and BioIntegral biological aortic-valved conduit in the aortic root position. Both conduits showed optimal haemodynamic results with a low incidence of aortic regurgitation.
INTRODUCTION
Until now, the Bentall procedure represents the golden standard in treating patients with aneurysm of the ascending aorta/aortic root combined with aortic valve disease, in whom the David or the Yacoub procedure cannot be performed [1–3]. The originally described procedure was performed with a mechanical valved conduit [4]. Nowadays, various biological valved conduits are available and have been evaluated so far. One of these models, the Shelhigh conduit, was withdrawn from the market and just recently was reintroduced in a modified version made of a porcine aortic valve and bovine pericardium (BioIntegral™). Meanwhile, several other biological conduits have been introduced such as the BioValsalva™ graft, which combines a trilaminate graft with a porcine aortic valve. Of note, most of these biological conduits have been evaluated only in regard to technical, clinical and outcome data.
We therefore aimed to compare the haemodynamic performance of the BioValsalva (BV) and BioIntegral (BI) aortic valve conduits in the aortic root position.
MATERIALS AND METHODS
The present study was a single-centre, two-armed, retrospective observational study including 55 consecutive patients who underwent aortic root replacement with the use of the BV (n = 27) or BI (n = 28) prosthesis at the West-German Heart and Vascular Center Essen between July 2008 and May 2014. Patients received either the BV or the BI bioprosthesis depending on surgeons' preference, and depending on the later availability of the BI prosthesis. Patients were enrolled in the study when aortic valve leaflet pathology was present making a valve-sparing aortic root operation impossible. Patients requiring reoperation or additional surgical procedures like concomitant coronary artery bypass grafting (CABG) or valve surgery were also included in the study. Operations were performed on an elective or urgent basis, with emergency operations being included in the present analysis. Institutional Review Board approval was obtained according to the Declaration of Helsinki.
The primary study endpoints were haemodynamic data during follow-up. Secondary study endpoints were early postoperative outcomes within 30 days and survival. Survival was obtained by active follow-up by contacting the corresponding registration office. All surviving patients were contacted to undergo the transthoracic echocardiographic evaluation on this basis. Demographics and operative parameters were recorded in a prospective institutional database and retrospectively extracted and evaluated. Echocardiographic data were stored in an institutional parallel workflow platform (Horizon Cardiology™, Medcon/McKESSON, San Francisco, CA, USA).
Valve characteristics
Biovalsalva™
The BV biological valved conduit consists of a biological porcine aortic valve (Elan™ stentless valve, Vascutek, Terumo, Inchinnanm, Scotland, UK) presewn into a particular triple-layer self-sealing graft material that proximally recreates the sinuses of Valsalva. The main body length ranges between 11.9 and 12.4 cm, and the conduit is available in 21, 23, 25 and 27 mm sizes [5].
Biointegral™
The stentless and all-biological BI composed conduit (BioIntegral Surgical, Inc., Mississauga, Canada, formerly manufactured by Shelhigh) is made from a porcine valve and a single layer of bovine pericardium. The usable main body length is 15 cm and the conduit is available in 21, 23, 25, 27 and 29 mm sizes [6].
Operative technique
All operations were carried out through a standard median sternotomy using cardiopulmonary bypass (CPB) and cannulation of the ascending aorta, aortic arch or right axillary artery. CPB was established with either a single atrial or bicaval cannula depending on the concomitant procedure. Mild (28–32°C) or moderate hypothermia (25–28°C) were obtained depending on the planned concomitant procedures. Myocardial protection was achieved by antegrade and optional retrograde crystalloid cardioplegic arrest (Custodiol®, Dr F. Köhler Chemie, Bensheim, Germany) and additional topical cooling. After clamping of the aorta, the diseased ascending aorta and aortic valve were completely resected and subsequent debridement of the native annulus and aortic root was performed. Both coronary buttons were mobilized. After sizing of the annulus with an industry-labelled sizer, the prosthesis was carefully selected. Multiple single, interrupted, non-everting, pledget-reinforced U-stitches (Ethibond 2–0, v5 needle, Ethicon, Norderstedt, Germany) were used to implant the composite graft. If the BI conduit was used, the suture line of the prefabricated pericardial tube was placed in the middle of the non-coronary cusp. Holes for both coronary ostia were made by an N° 11 blade in the BV group or with the use of a 5.2 mm aortic punch (PP Medic, Düsseldorf, Germany) in the BI group. Both coronary ostia were reimplanted by a running suture (Prolene 5–0, cc needle, Ethicon, Norderstedt, Germany). According to our institutional protocol, all patients who were treated with any kind of bioprosthesis were treated with phenprocoumon for the first 6 weeks postoperatively.
Echocardiography
Postoperative and follow-up echocardiographic assessment. Transthoracic echocardiography: transthoracic 2D echocardiographic (TTE) standard views were obtained using a standard ultrasound system with a 1–5 MHz (S5–1) probe (iE33, Philips Medical Systems, Andover, MA, USA). Left ventricular dimensions were measured according to the recommendations of the American Society of Echocardiography. Standard grey-scale images were obtained in the standard parasternal and apical views. Doppler flow data were acquired from the left ventricular outflow tract region in the pulsed wave mode, and from the aortic valve in the continuous wave mode in the apical five-chamber view. An experienced echocardiographer (Mareike Eißmann), who was blinded to the type of aortic valve replacement procedure, performed all transthoracic follow-up evaluations. During follow-up TTE, colour Doppler echocardiography was performed after optimizing the Nyquist limit in order to evaluate the presence of regurgitant valve disease. Aortic regurgitation (AR) was evaluated according to the current recommendations and the degree of AR (none/trace, mild, moderate and severe) was classified by the experienced echocardiographer.
Statistics
Continuous data were reported as mean ± standard deviation or median (25th–75th percentiles) depending on the normality of distribution. Continuous variables were tested for normality of distribution using the Shapiro–Wilk test and were compared using independent-samples t-test if normally distributed or the Mann–Whitney U-test if not normally distributed. Categoral variables were summarized as counts (percentages) and compared using Fisher's exact test. A P-value less than 0.05 was considered to indicate statistical significance. Survival curves were generated with the Kaplan–Meier method. All statistical analyses were performed using the SPSS® software package, version 23.0 (IBM Corp., Armonk, NY, USA) [7].
RESULTS
Patient population
A total of 55 patients were enrolled in the study. Preoperative characteristics of both groups are summarized in Table 1. The two groups were similar for all listed characteristics. The indication for surgery was aneurysm of the aortic root in 42 patients (76.3%), acute type A aortic dissection in 11 patients (20%) and aortic valve endocarditis with abscess in 2 patients (3.6%). No patient presented with Marfan syndrome. Intraoperative variables are listed in Table 2 indicating no statistically significant differences between both groups except implanted prosthesis size; 10 patients of the BI group received a 29 mm valve, but no patient in the BV group, as the BV is not available in size 29 mm. Overall, both groups showed a high incidence of concomitant procedures (59.3 vs 71.4%, P = 0.70). Concomitant procedures included CABG, mitral valve replacement/repair and combinations of these procedures. Other concomitant procedures included Maze procedure, closure of a patent foramen ovale and tricuspid valve repair. Endovascular stent grafting was performed in 1 patient with aortic dissection spreading into the abdominal aorta. Another patient received percutaneous stenting of the right iliac and left renal arteries. Replacement of the ascending aorta was extended to the hemiarch in 5 patients in the BV group versus 2 patients in the BI group, and to the total arch only in 1 patient in the BV group. The frozen elephant trunk procedure was performed in 1 patient in the BV group versus 5 patients in the BI group.
Baseline patient characteristics
| Variable | BV (n = 27) | BI (n = 28) | P-value |
|---|---|---|---|
| Demographics | |||
| Age (years) | 71 (66.0–75.0) | 66.0 (62.9–73.3) | 0.15 |
| Gender, male | 19 (70.4) | 24 (85.7) | 0.17 |
| BMI (kg/m2) | 27.6 ± 3.1 | 28.5 ± 4.9 | 0.41 |
| BMI >30 kg/m2 | 6 (23.1) | 10 (35.7) | 0.31 |
| BSA (m2) | 2.0 (1.9–2.2) | 2.1 (1.9–2.2) | 0.32 |
| Risk factors and comorbidities | |||
| Systemic hypertension | 24 (92.3) | 23 (82.1) | 0.27 |
| Diabetes mellitus | 3 (11.5) | 4 (14.3) | 0.76 |
| Coronary artery disease | 9 (34.6) | 12 (42.9) | 0.54 |
| PVD | 2 (7.4) | 1 (3.6) | 0.61 |
| Atrial fibrillation | 5 (18.5) | 10 (35.7) | 0.23 |
| COPD | 4 (15.4) | 1 (3.6) | 0.14 |
| Renal disease (serum creatinine >200 µmol/l) | 1 (3.8) | 3 (10.7) | 0.34 |
| Dyslipidaemia | 14 (53.8) | 10 (35.7) | 0.19 |
| Smoking | 4 (15.4) | 7 (25.0) | 0.38 |
| Emergency | 5 (18.5) | 6 (21.4) | 0.79 |
| Cardiac | |||
| Aneurysm ≥45 mm | 25 (92.6) | 26 (92.9) | 0.97 |
| Aneurysm diameter (mm) | 51.5 (48.3–60.0) | 54.5 (50.0–60.0) | 0.41 |
| Aortic dissection | 4 (14.8) | 7 (25.0) | 0.35 |
| Aortic endocarditis | 2 (7.4) | 0 (0) | 0.14 |
| Aortic stenosis | 8 (29.6) | 7 (25.0) | 0.70 |
| Aortic regurgitation | 22 (81.5) | 25 (89.3) | 0.41 |
| Bicuspid aortic valve | 10 (37.0) | 5 (17.9) | 0.11 |
| Previous cardiac surgery | 3 (11.5) | 3 (10.7) | 0.92 |
| Risk scores | |||
| EuroSCORE-II (%) | 3.8 (2.5–7.8) | 5.3 (2.6–10.8) | 0.38 |
Data are presented as mean ± SD, median (25th–75th percentiles) or number (%).
BMI: body mass index; BSA: body surface area; PVD: peripheral vascular disease; COPD: chronic obstructive pulmonary disease; EuroSCORE: European System for Cardiac Operative Risk Evaluation; BV: BioValsalva; BI: BioIntegral; SD: standard deviation.
Operative characteristics
| Variable | BV (n = 27) | BI (n = 28) | P-value |
|---|---|---|---|
| Arterial cannulation site | |||
| Ascending aorta | 23 (85.2) | 24 (85.7) | 1.00 |
| Axillary artery | 3 (11.1) | 4 (14.3) | 1.00 |
| Femoral and axillary artery | 1 (3.7) | 0 (0) | 0.49 |
| DHCA (<25°C) | 0 | 0 | 1.00 |
| MHCA (25–28°C) | 8 (29.6) | 7 (25.0) | 0.77 |
| ASCP | 5 (18.5) | 6 (21.4) | 0.79 |
| IABP | 1 (3.7) | 0 (0) | 0.49 |
| CPB (min) | 154.5 (118.0–203.3) | 146.5 (108.0–227.0) | 0.63 |
| Cross-clamp time (min) | 105.0 (74.0–140.5) | 102.5 (80.0–135.0) | 0.82 |
| Reperfusion time (min) | 33.5 (24.0–65.8) | 50.0 (25.0–71.8) | 0.55 |
| ASCP time (min) | 47.3 ± 38 | 46 ± 24 | 0.94 |
| Visceral ischaemia time (min) | 39.5 ± 30.4 | 39.2 ± 21.4 | 0.99 |
| Extent of aortic replacement | |||
| Ascending aorta | 20 (74.1) | 21 (75) | 1.00 |
| Ascending aorta and partial arch | 5 (18.5) | 2 (7.1) | 0.25 |
| Ascending aorta and total arch | 1 (3.7) | 0 (0) | 0.49 |
| Ascending aorta, total arch and ET | 1 (3.7) | 5 (17.9) | 0.19 |
| Concomitant operation | 16 (59.3) | 20 (71.4) | 0.40 |
| CABG | 7 (25.9) | 8 (28.6) | 1.00 |
| MVR | 1 (3.7) | 4 (14.3) | 0.35 |
| Combined CABG and MVR | 2 (7.4) | 2 (7.1) | 1.00 |
| Other | 6 (22.2) | 6 (21.4) | 1.00 |
| Prosthesis size (mm) | |||
| 23 | 1 (3.7) | 1 (3.6) | 1.00 |
| 25 | 13 (48.1) | 8 (28.6) | 0.17 |
| 27 | 13 (48.1) | 9 (32.1) | 0.28 |
| 29 | 0 (0) | 10 (35.7) | 0.001 |
Data are presented as mean ± SD, median (25th–75th percentiles) or number (%).
CABG: coronary artery bypass grafting; MVR: mitral valve replacement or repair; DHCA: deep hypothermic circulatory arrest; MHCA: moderate hypothermic circulatory arrest; CPB: cardiopulmonary bypass; ASCP: antegrade selective cerebral perfusion; IABP: intra-aortic balloon pump; ET: elephant frozen trunk; BV: BioValsalva; BI: BioIntegral; SD: standard deviation.
Outcomes at 30 days
Outcomes at 30 days are listed in Table 3. The 30-day mortality rate was 11.1% in the BV group versus 3.6% in the BI group (P = 0.35). Postoperative stroke occurred in 1 patient in each group. Postoperative ventilation time greater than 48 h was needed in 7 patients in the BV group and 8 patients in the BI group. Dialysis was needed in 5 vs 8 patients (BV versus BI group). Postoperative new onset of atrial fibrillation was present in 5 patients in the BV group and 7 patients in the BI group. Patients who died within 30 days had a median EuroSCORE-II of 16.3% in the BV group and 26.0% in the BI group.
30-day outcomes
| Variable | BV (n = 27) | BI (n = 28) | P-value |
|---|---|---|---|
| Reoperation for bleeding | 2 (7.7) | 2 (7.1) | 0.94 |
| Sepsis | 0 (0) | 3 (10.7) | 0.09 |
| Stroke | 1 (3.8) | 1 (3.6) | 0.96 |
| Ventilation >48 h | 7 (26.9) | 8 (28.6) | 0.89 |
| Pulmonary embolism | 0 (0) | 0 (0) | 1.00 |
| Pneumonia | 4 (15.4) | 5 (17.9) | 0.81 |
| Dialysis-dependent renal failure | 5 (19.2) | 8 (28.6) | 0.42 |
| Tracheotomy | 4 (15.4) | 2 (7.1) | 0.34 |
| Implantation of pacemaker | 1 (3.8) | 2 (7.1) | 0.60 |
| Recurrent laryngeal nerve injury | 0 (0) | 0 (0) | 1.00 |
| New onset atrial fibrillation | 5 (18.5) | 7 (25) | 0.38 |
| ICU LOS (days) | 2.0 (1.0–6.3) | 2.5 (1.0–6.0) | 0.73 |
| 30-day mortality | 3 (11.1) | 1 (3.6) | 0.35 |
| Intraoperative | 1 (3.7) | 0 (0) | 0.49 |
| Postoperative | 2 (7.4) | 1 (3.6) | 0.61 |
| Cause of 30-day mortality | |||
| Cardiogenic shock | 1 (3.7) | 0 (0) | 0.49 |
| Multiple organ failure | 1 (3.7) | 1 (3.6) | 1.00 |
| Renal failure | 0 (0) | 0 (0) | 1.00 |
| EuroSCORE-II for 30-day mortalities (%) | Median 16.3 (n = 3) | 26.0 (n = 1) | 0.99 |
Data are presented as mean ± SD, median (25th–75th percentiles) or number (%).
ICU: intensive care unit; LOS: length of stay; BV: BioValsalva; BI: BioIntegral; SD: standard deviation.
Follow-up outcomes and survival
Follow-up outcomes are listed in Table 4. The rate of freedom from all-cause death in the BV group was 82, 82 and 77% at 1, 2 and 5 years, respectively. In the BI group, the survival rate was 89% at 1 year. During follow-up, 3 patients in the BV group died (unknown cause of death of 2 patients at 1 and 4 months, and of another patient who required reoperation 24 months postoperatively due to severe mitral valve regurgitation). In the BI group, 2 patients died during follow-up, at 2 and 4 months postoperatively due to unknown cause. The Kaplan–Meier survival curve is given in Fig. 1.
Follow-up outcomes
| Variable | BV (n = 24) | BI (n = 27) | P-value |
|---|---|---|---|
| Follow-up months | 41.7 ± 19.6 | 14.8 ± 5.5 | <0.001 |
| Mortality during follow-up | 3 (12.5) | 2 (7.4) | 0.54 |
| Cause of death | |||
| Mediastinitis | 0 (0) | 0 (0) | 1.00 |
| Ischaemic cardiac failure | 1 (3.7) | 0 (0) | 0.49 |
| Arrhythmia | 0 (0) | 1 (3.6) | 1.00 |
| Other | 1 (3.7) | 0 (0) | 0.49 |
| Unknown | 1 (3.7) | 1 (3.6) | 1.00 |
Data are presented as mean ± SD, median (25th–75th percentiles) or number (%).
BV: BioValsalva; BI: BioIntegral; SD: standard deviation.
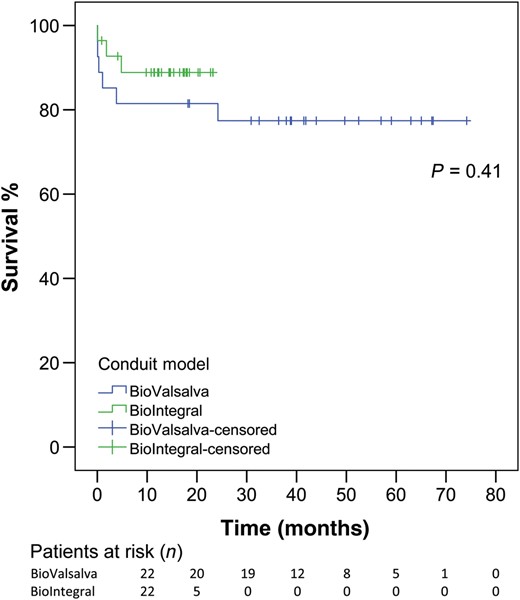
Kaplan–Meier curve for both groups (BV: blue; BI: green). BV: BioValsalva; BI: BioIntegral.
Echocardiographic outcomes
Detailed echocardiographic outcomes are presented in Table 5. Mean pressure gradients (MPGs) were comparable between both groups at follow-up (11.0 mmHg in the BV versus 11.5 mmHg in the BI group, P = 0.82) for all implanted sizes and also effective orifice areas (EOAs) were comparable between both groups (1.85 cm2 in the BV group versus 1.80 cm2 in the BI group, P = 0.24). The same was true for the ejection fraction (55.0% in the BV versus 50.0% in the BI group, P = 0.12). The majority of patients showed no or trace AR (91.3 vs 76.2%, P = 0.23) or mild AR (8.7 vs 23.8%, P = 0.23). Moderate or severe AR was not observed. An example of MPGs for both groups for all valve sizes is given in Fig. 2, and, moreover, in detail for the valve sizes most often used (25 and 27 mm).
Echocardiographic follow-up
| Variable | BV (n = 23) | BI (n = 21) | P-value |
|---|---|---|---|
| Follow-up months | 43.0 ± 15.8 | 8.4 ± 4.2 | <0.001 |
| EF (%) | 55.0 (50.3–55.0) | 50.0 (44.0–55.0) | 0.12 |
| Aortic regurgitation | |||
| None/trace | 21 (91.3) | 16 (76.2) | 0.23 |
| Mild | 2 (8.7) | 5 (23.8) | 0.23 |
| Moderate | 0 (0) | 0 (0) | 1.00 |
| Severe | 0 (0) | 0 (0) | 1.00 |
| Pmax (mmHg) | 18.0 (16.0–23.3) | 19.0 (14.0–24.0) | 0.87 |
| 25 mm valve | 19.5 (11.0–29.8) | 15.5 (13.5–20.5) | 0.76 |
| 27 mm valve | 16.0 (16.0–22.0) | 22.0 (19.6–24.0) | 0.10 |
| Vmax (m/s) | 2.10 (1.99–2.60) | 2.20 (1.80–2.40) | 0.82 |
| 25 mm valve | 2.20 (1.63–3.13) | 1.96 (1.83–2.31) | 0.76 |
| 27 mm valve | 2.00 (1.99–2.27) | 2.35 (2.20–2.40) | 0.07 |
| MPG (mmHg) | 11.0 (8.3–14.8) | 11.5 (9.0–13.0) | 0.82 |
| 25 mm valve | 12.0 (9.5–18.0) | 9.5 (8.3–12.3) | 0.41 |
| 27 mm valve | 10.0 (8.0–14.75) | 12.0 (12.0–13.0) | 0.42 |
| EOA (cm2) | 1.85 (1.55–2.21) | 1.80 (1.64–1.83) | 0.24 |
| 25 mm valve | 1.80 (1.25–2.50) | 1.85 (1.69–1.98) | 0.78 |
| 27 mm valve | 2.00 (1.60–2.20) | 1.70 (1.63–1.80) | 0.20 |
Data are presented as mean ± SD, median (25th–75th percentiles) or number (%).
EF: ejection fraction; Pmax: peak pressure gradient; Vmax: peak aortic jet velocity; MPG: mean pressure gradient; EOA: effective orifice area; BV: BioValsalva; BI: BioIntegral; SD: standard deviation.
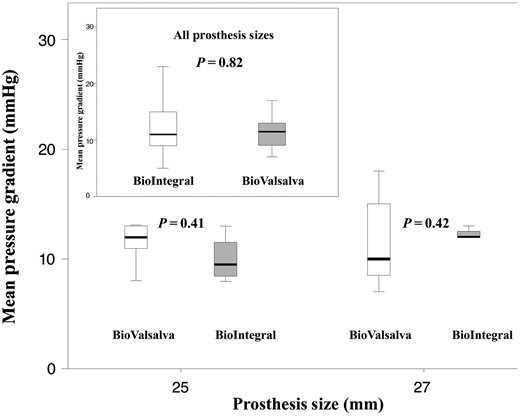
Box-plot shows the mean pressure gradient for the BV and BI conduit of 25 and 27 mm sizes (box upper left corner: all valve sizes). Box-plots indicate medians, 25th and 75th percentiles (boxes) and minimum and maximum values (whiskers). BV: BioValsalva; BI: BioIntegral.
DISCUSSION
The present study clearly provided the following interesting findings: (i) both conduits showed excellent haemodynamic performance with MPGs of ∼11 mmHg during follow-up; (ii) a rather low rate of AR at follow-up (iii) no significant difference in survival between both groups.
With these data, we report for the first time the haemodynamic performance of the BV and BI aortic valve conduits in a highly comprehensive and detailed manner. Currently, there is limited haemodynamic data available on both conduits in detail, and moreover, to our knowledge, both conduits have not been compared in their current version.
Hugh Bentall and Antony De Bono described the Bentall procedure in 1968 for the first time [4]. The technique offers a simultaneous treatment of the aortic valve and the diseased ascending aorta and, even today, the modified Bentall procedure still represents the gold standard in such entities [8]. Whereas the original Bentall procedure entailed a mechanical valve conduit, gradually, various biological valved conduits have been designed, such as the Shelhigh (‘Shelhigh BioConduit stentless valve’) biological aortic-valved conduit (Shelhigh, Inc., Union, NJ, USA). However, due to sterility and safety issues, this conduit was withdrawn from the market by the U.S. Food and Drug Administration in 2007 [9]. Despite this drawback, in 2013 the Berlin group published excellent 11-year results using the original Shelhigh bioprosthesis [10]. Most recently, the company moved to Canada and a modified version has been reintroduced into the market (BioIntegral Surgical, Inc.). Meanwhile, several other biological conduits have been introduced and evaluated. However, driven by the excellent results of Musci et al. [10], we started using the new BI conduit in our centre in 2013. In between, the BV aortic-valved conduit, which combines a trilaminate graft with a porcine aortic valve, was mainly implanted in our centre. Of note, until now, most of these aortic-valved conduits have mainly been evaluated in regard to clinical and outcome data or proposed as a valuable alternative in patients with infective endocarditis or root abscesses, but there is a paucity of reported echocardiographic or haemodynamic data. We therefore sought to retrospectively evaluate our clinical results and perform a prospective and comprehensive follow-up echocardiography by an independent cardiologist. All manufacturers have pointed out various determinants of valve performance including aortic valve, pressure gradients and durability. Regardless of the type of prosthesis, haemodynamic data should be obtained at least 6 months postoperatively in order to limit the bias of haemodynamic instability in the immediate postoperative course. Therefore, we decided to analyse valve performance for at least 6 months postoperatively.
First of all, it must be mentioned that due to the availability and different time periods of implantation, the follow-up of the BV group was significantly longer than that of the BI group (40.2 vs 14.7 months, P < 0.001), which is also reflected by different numbers of patients at risk by the Kaplan–Meier calculation. There might also be some form of selection bias or an improvement in the standard of care in these different time periods. On the other hand, however, despite a potential selection bias, we observed no difference in pressure gradients between both groups with MPGs for all valve sizes of 11.0 mmHg (8.3–14.8 mmHg) for the BV and 11.5 mmHg (9.0–13.0 mmHg) for the BI conduit (P = 0.82). Similar results were achieved for EOAs for all valve sizes [BV, 1.85 cm2 (1.55–2.21) vs BI, 1.80 cm2 (1.64–1.83), P = 0.24], despite the fact that 10 patients of the BI group received a 29 mm valve. As illustrated in Table 5, there was no significant difference in haemodynamics of those patients who received a 25 or 27 mm conduit. Moreover, there was no statistically significant difference in AR [none/trace AR in (21/23) 91.3% in the BV group versus (16/21) 76.2% in the BI group, P = 0.23]. Our findings are supported by Baraki et al. [11] who reported good haemodynamic results for the BV aortic conduit in 25 follow-up patients showing no AR and MPGs of 13 ± 5 mmHg 6 months postoperatively. Moreover, Carrel et al. [12] provided haemodynamic data for the original Shelhigh conduit with echocardiographic data available for 30 patients at 6 months, indicating mean gradients of 8.5 ± 5.1 mmHg (range: 6–14 mmHg), which is in accordance with our data.
In the present study, the overall 30-day mortality was relatively high (7.3%). However, the high rate of additional and complex procedures, including emergency indication and acute type-A aortic dissections should be considered. Similarly, in-hospital mortality (>10%) has been reported by others in high-risk patients undergoing aortic root replacement for infective endocarditis or acute type-A aortic dissection [13–15]. Furthermore, the mean age of the patient population was about 70 years, representing the increasing number of elderly patients undergoing cardiac surgery at the present time.
From a mechanistic standpoint, both valved conduits are similar by incorporating stentless biological valves. However, they differ in two main characteristics: first, the graft of the BV conduit is made of polyester, whereas the graft of the BI conduit is made of bovine pericardium. This makes the BI conduit a complete biological conduit, which may better resist infection and be an alternative to homografts [10, 12, 16]. Second, the BI conduit is a straight pericardial graft with an incorporated stentless valve with no extra sewing ring, whereas the BV conduit comes with an extra sewing ring that adds 4 mm to the diameter of the valve, which might decrease the effective orifice area. On the other hand, the design of the BV conduit has two advantages: first, as the BV conduit is made of polyester, it is presumably resistant to calcification in the long term. Second, the design of BV recreates the sinuses of Valsalva: This reduces the distance between the coronary ostia and the graft itself and minimizes tension on the coronary anastomoses [17], and moreover, preserves aortic root dynamics, due to the flexibility and distensibility of the incorporated sinuses. From a surgical perspective, however, the BI conduit comes with an ease of implantation due to the pliability of the pericardium itself in contrast to the rigid sewing ring of the BV graft. On the other hand, as the BI conduit does not come with a preformed sewing ring, distortion during implantation must be avoided, which may lead to incorrect valve closure and AR.
Limitations
Our study was performed at a single tertiary care medical centre with a relatively small sample size; however, it represents one of the first comprehensive and detailed studies to evaluate and compare the haemodynamic performance of the BV and BI conduits. Moreover, the study was retrospective in design and, most notably, was not randomized. Owing to the retrospective design and the reintroduction of the BI conduit in 2013, it must be noted that both conduits have been used during different time periods. Although we did not observe any significant demographical differences between both groups, there are by nature differences not captured by this analysis, especially in such a small series. Therefore, the possibility of any selection bias cannot be ruled out. Also, due to the high percentage of concomitant procedures within both groups, survival must be seen in a different light.
CONCLUSION
This study compares the BV and BI conduits in regard to their haemodynamic performance. Currently, all companies extensively promote their products and emphasize their unique features. We observed excellent MPGs and EOAs and low rates of AR for all implanted prostheses during follow-up, with no difference between both groups. However, there might be a selection bias (different time periods), which was not captured by our analysis. It should be emphasized, however, that the BI conduit represents a modified product, which can now legitimately compete with other well-established aortic-valved biological conduits. On the other hand, the BV conduit comes with the advantage of proven long-term follow-up, which has to be proven for the BI conduit. Before advocating a specific aortic-valved biological conduit, further randomized studies evaluating the long-term durability, performance and valve-related morbidity of these innovative aortic-valved biological conduits are warranted, including detailed echocardiographic data.
Conflict of interest: none declared.
REFERENCES
Author notes
Presented at the 29th Annual Meeting of European Association for Cardio-Thoracic Surgery, October 3–7, 2015, Amsterdam, The Netherlands.
Both authors contributed equally.
