


Abstract
In a future ocean, dissolved organic carbon (DOC) release by seaweed has been considered a pathway for organic carbon that is not incorporated into growth under carbon dioxide (CO2) enrichment/ocean acidification (OA). To understand the influence of OA on seaweed DOC release, a 21-day experiment compared the physiological responses of three seaweed species, two which operate CO2 concentrating mechanisms (CCMs), Ecklonia radiata (C. Agardh) J. Agardh and Lenormandia marginata (Hooker F. and Harvey) and one that only uses CO2 (non-CCM), Plocamium cirrhosum (Turner) M.J. Wynne. These two groups (CCM and non-CCM) are predicted to respond differently to OA dependent on their affinities for Ci (defined as CO2 + bicarbonate, HCO3−). Future ocean CO2 treatment did not drive changes to seaweed physiology—growth, Ci uptake, DOC production, photosynthesis, respiration, pigments, % tissue carbon, nitrogen, and C:N ratios—for any species, regardless of Ci uptake method. Our results further showed that Ci uptake method did not influence DOC release rates under OA. Our results show no benefit of elevated CO2 concentrations on the physiologies of the three species under OA and suggest that in a future ocean, photosynthetic CO2 fixation rates of these seaweeds will not increase with Ci concentration.
Abbreviations
- CCM
carbon dioxide concentrating mechanism
- CO2
carbon dioxide
- Ci
dissolved inorganic carbon
- DOC
dissolved organic carbon
- HCO3-
bicarbonate
- OA
ocean acidification
Introduction
Over the past 250 years, CO2 concentrations in the atmosphere, driven by anthropogenic emissions, have increased from ~280 to 400 ppmv, of which ∼30% has been absorbed by the surface ocean (Doney et al., 2009; Mcleod et al., 2011; Hurd et al., 2018; IPCC, 2022). The ongoing absorption of atmospheric CO2 by the surface ocean has caused seawater pH to decrease by 0.1 unit since the industrial revolution and altered the relative abundance of the different species of Ci in seawater (termed OA). By the end of this century, it is projected that the pH of the ocean will drop by a further 0.4 units and simultaneously HCO3−, the most abundant species of Ci in seawater (concentrations of ∼2000 μM), will increase by 20% and CO2 by 260% (Koch et al., 2013; Stockdale et al., 2016; Young and Gobler, 2016). The changes in concentrations of dissolved HCO3− and CO2, can independently and synergistically influence the physiology of seaweeds (Hurd et al., 2019).
Seaweeds (marine macroalgae) are dominant marine autotrophs in coastal oceans around the world from three distinct evolutionary lineages—the Rhodophyta, Chlorophyta, and Ochrophyta. They provide essential services within the marine environment such as habitat creation, food provision, and nutrient cycling (e.g. CO2, oxygen, and nitrogen) (Steneck et al., 2002; Graham, 2004; Christie et al., 2009; Egan et al., 2013; Roleda and Hurd, 2019). All seaweeds take up CO2 from seawater by passive diffusion, however, the majority of species also operate CO2 concentrating mechanisms (CCMs) to facilitate the use of HCO3−, which is abundant in seawater compared to CO2 (Andria et al., 1999; Raven et al., 2008; Fernández et al., 2014). HCO3− is converted to CO2, which is fixed in the chloroplast by RUBISCO and incorporated into amino acids, polysaccharides, and cell walls (Giordano et al., 2005; Raven et al., 2008; Fernández et al., 2014; Hurd et al., 2014). Around 35% of studied seaweeds (mostly phylum Rhodophyta) take up only CO2 and are termed CO2-only users or non-CCMs (Raven et al., 2002; Cornwall et al., 2015; Kubler and Dudgeon, 2015). CCMs have higher energetic requirements than diffusive CO2 uptake and for some species, under CO2 enrichment or low light, CCM activity can be reduced in favour of diffusive CO2, termed “down-regulation” of HCO3− use (Cornwall et al., 2015, 2017; Britton et al., 2019).
Seaweeds are predicted to respond differently to ocean acidification (OA) based on their Ci uptake method and affinity for Ci including: low and high affinity non-CCMs, low and high affinity CCMs with either down regulation or no down regulation of the CCM, and HCO3− only use (Hepburn et al., 2011; Cornwall and Hurd, 2019; Hurd et al., 2019; van der Loos et al., 2019). Various physiological responses of seaweeds to OA have been recorded, ranging from beneficial to negative and neutral (Cornwall et al., 2017; Britton et al., 2019; van der Loos et al., 2019). It is predicted that non-CCM seaweeds with a high affinity for CO2 will not be affected by future ocean CO2 concentrations while non-CCM seaweeds with a low affinity for CO2 may benefit due to the increase in seawater CO2 available for photosynthesis (Hurd et al., 2019; van der Loos et al., 2019). Seaweed CCMs are pH sensitive and observed responses are likely due to differences in CCM effectiveness under pH changes (Ober and Thornber, 2017; van der Loos et al., 2019). When enriched with CO2, some seaweed species show elevated photosynthetic rates but no increase in growth, suggesting an additional pathway for the photosynthetically fixed CO2, which is not used for growth (Olischlager and Wiencke, 2013; Gordillo et al., 2016; Kang and Kim, 2016; Bender-Champ et al., 2017; Reidenbach et al., 2017; Kang and Chung, 2018).
A carbon overflow mechanism (called the carbon overflow hypothesis in older literature), where dissolved organic carbon (DOC) is released into the surrounding seawater to maintain intracellular carbon and nitrogen stoichiometry is one such pathway for fixed CO2 not used in seaweed growth (Gordillo et al., 2001; Iñiguez et al., 2016b; Weigel and Pfister, 2021). Discrepancies between photosynthesis and growth rates of seaweeds under future ocean CO2 concentrations are considered a response of species-specific re-organization of the cellular carbon budget, whereby seaweeds either store the excess carbon or release it into the surrounding seawater as DOC (Iñiguez et al., 2016a). Elevated DOC release rates under OA have been observed for seaweeds on the Great Barrier Reef (Diaz-Pulido and Barron, 2020), in Spain (Gordillo et al., 2001), in the Artic, and Antarctica (Iñiguez et al., 2016a, 2017). This overflow of DOC may be enhanced if seaweeds are limited for growth by other essential nutrients, particularly nitrogen (Gordillo et al., 2001; Riebesell, 2004; Thornton, 2014; Iñiguez et al., 2016a; Diaz-Pulido and Barron, 2020).
The goal of this study was to examine the DOC overflow hypothesis of seaweeds with differing Ci uptake strategies. We tested three seaweed species with known Ci uptake strategies for their physiological responses—growth, Ci uptake, DOC production, photosynthesis, respiration, pigments, % tissue carbon, nitrogen, and C:N ratios—to future ocean CO2 concentrations under a 21-day OA experiment. This is the first study to report DOC release values for a non-CCM seaweed, and only the second to study the effect of OA on the DOC release of temperate seaweeds (Gordillo et al., 2001). The study species were, Ecklonia radiata (Ochrophyta, CCM), Lenormandia marginata (Rhodophyta, CCM), and Plocamium cirrhosum (Rhodophyta, non-CCM)—note the Ci uptake method of each species has been previously confirmed using a pH drift experiment and isotope δ13C analysis by Cornwall et al. (2015). We hypothesized that if the non-CCM seaweed, P. cirrhosum, was limited by CO2 under current ocean concentrations we would observe an increase in CO2 uptake, photosynthesis, and growth in the OA treatment. For the CCM seaweeds, E. radiata and L. marginata, it was hypothesized that there would be no increase in photosynthetic rates or growth but instead an increase in the Ci uptake, in particular CO2 taken up from the seawater under OA—as found by Britton et al. (2016) for E. radiata. We predicted an increase in the DOC release rate for all three seaweed species under OA due to the hypothesized change in Ci uptake and re-organization of the cellular carbon budget. The effect of OA on pigment content, % dry tissue carbon, nitrogen, and C:N ratios for all three species was unknown but considered linked with growth, DOC release, and Ci uptake.
Methods
Seaweed collection
Seaweeds (n = 16 individuals each for E. radiata, P. cirrhosum, and L. marginata) were collected using SCUBA at a depth of 8–10 m from Coal Point, Bruny Island, Tasmania, Australia (43.33 S, 147.32 E) on 12 July 2021. Specimens of each species were pressed using a seaweed press, confirmed using field guide books (Scott, 2013), and lodged at the Tasmanian State Herbarium. Juveniles of E. radiata were used because preliminary studies revealed no difference in the DOC release rates (μmol C gDW−1 h−1) by whole mature blades (blade and stipe) and whole juvenile E. radiata (see Supplementary Figure S1). Mature individuals of P. cirrhosum and L. marginata were collected which were an appropriate size (∼ 50 cm2) for the experimental chambers (650 ml). Seaweeds were placed in an insulated container with seawater for transport to the laboratory 2 h away.
Pre-experimental treatment of seaweeds and equipment cleaning procedure
Once in the laboratory, seaweeds were left in the insulated container overnight with freshly filtered seawater and aeration under 80 μmol photons m−2 s−1 on a 12:12 light/dark cycle in a cool room set to 11°C (similar to conditions at the collection site). Prior to the experiment, seaweeds were cleaned of epiphytes using KimtechTM wipes and tweezers. For L. marginata, calcifying invertebrates could not be removed due to potential tissue damage and covered ∼1% of the seaweed blade on each individual. All glassware, tubes, and syringes used in the experiment were cleaned using Decon-90 (2% v/v) and HCL (10% v/v). Glass DOC vials (Shimadzu TOC certified) and glass filter paper (Whatman GF/F, 0.7 μm) were combusted in a muffler overnight (8 h at 400°C) to remove any residual organic carbon (Yoro et al., 1999). Bottles for total alkalinity samples (HDPE, Nalgene, 60 ml, Thermo ScientificTM) were rinsed five times each in distilled water and left to dry before use.
Experimental culture conditions
On day 1 of the 21-day experiment, 16 individual seaweeds from each species were randomly assigned to one of two pH treatments (“current” and “future,” n = 8 for each species |$\times$| treatment combination ∴ 48 seaweeds total). Mean target pHT was 8.0 for the current treatment and 7.6 for the future treatment. The pHT of both treatments fluctuated on a diurnal cycle to reflect the natural daily pH fluctuation within a seaweed bed, increasing 0.2 units every 4 h during the day and decreasing 0.2 units every 4 h at night (see Supplementary Figure S2; Britton et al., 2019). This gave the treatments a range of 7.85–8.15 pH units (CO2 at 400 ppm) and 7.50–7.80 pH units (CO2 at 850 ppm) for current and future treatments, respectively. The experimental set-up was situated in a cool room set to 11°C (ambient seawater at the time of seaweed collection) and was measured in the chambers throughout the experiment as 13°C ± 0.5 SD. The experiment was conducted in an automated culture system described in Britton et al. (2019). Perspex culture chambers (650 ml, total number of chambers = 48) were placed on stirrer plates underneath full spectrum LED lights (Zeus-70 LED ZEAL) on a diurnal cycle set to a daily maximum of 80 μmol photons m−2 s−1 (12:12, light/dark). This irradiance was typical of the site depth (Britton et al., 2020). Target pHT was achieved using mass flow controllers (FMA5418A and FMA5402A, Omega Engineering, USA) that controlled the ratio of air and CO2 in a gas mix introduced to seawater through mini module membrane contactors (3MTM Liqui-CelTM MM-15.5 Series) from a single header tank using peristaltic pumps. The pH of the incoming seawater was maintained within 0.03 units of the pHT using an automated spectrophotometric feedback system (McGraw et al., 2010). Chambers were filled with seawater corresponding to their designated pH treatment (current or future), which was replaced every 4 h with fresh seawater. The pH of the seawater in each culture chamber was monitored every 2 h using a separate spectrophotometric system to assess how the seaweeds altered the pH of the seawater between seawater changes (for the carbonate chemistry parameters of each treatment see Supplementary Table S1). All pHT measurements were measured between 12.55 and 16.28°C.
Growth rates
To determine growth rates of seaweeds, all individuals were blotted dry using KimWipesTM and weighed for wet weight at the start (day 1), and end (day 21) of the experiment. Growth rates according to wet weight were calculated using equations from Kain (1982).
Immediately after growth measurements were taken, seaweed tissue was preserved for subsequent assays. For pigment content, tissue (0.1 g) was frozen at −80°C and, for % carbon, nitrogen, and C:N ratios, tissue (0.1 g) was oven dried at 60°C for three nights.
Ci uptake
Seawater samples for determination of total alkalinity (AT) were taken from each incubation chamber (48 chambers total) on day 19 of the experiment. Upon refreshment of seawater in each incubation chambers, all chambers were sealed, and an initial sample of seawater (60 ml) was collected in a pre-rinsed alkalinity bottle. Final seawater samples were taken after 4 h, prior to the next seawater refreshment. AT was measured using the open-cell titration method using a Metrohm 862 Compact Titrosampler coupled with an Aquatrode Plus with PT1000 240 temperature sensor following methods outlined in Ferderer et al. (2022) and Dickson et al. (2007). The change in AT measured on day 19 and pH over 4 h on day 17 during the experiment was used to calculate Ci uptake by seaweeds using the CRAN package “seacarb” in the software program R version 4.1.3 (R Core Team, 2022). An issue with the spectrophotometric system prevented use of pH measurements taken at the same time as AT. Ci uptake was standardized with seaweed wet weight (gWW−1) and time (h).
DOC seawater sample analysis
To estimate the rate of DOC release from each replicate seaweed (n = 8 for each species |$\times$| treatment combination ∴ 48 seaweeds total) over a 24 h period, seawater samples were taken at 8 a.m. (day 20) immediately after each chamber flush and final samples were taken at 8 a.m. on day 21—chambers were not flushed over this incubation time (note that pH would have fluctuated in each chamber over this period with metabolic activity. The measured pH fluctuation was ± 0.01–0.08 over 2 h). DOC samples were analysed at the Queensland Chemistry Centre using an automated total organic carbon analyser (Analytica Jena Multi N/C 3100) via combustion at 720°C over a platinum catalyst in accordance with method 5310 D (Standard Methods Committee of the American Public Health Association 2017). DOC release rates were determined as the difference between initial and final samples and were standardized to incubation time (h), culture volume (L), and seaweed biomass (grams of dry weight, gDW). The rate of DOC production was expressed as μmol C gDW−1 h−1.
Photosynthetic and respiration rates
On the final day of the experiment (day 21), the change in oxygen concentration was measured in each culture chamber (48 total); initial and final dissolved oxygen concentrations (mmol O2 g−1 h−1) were measured under experimental irradiance over 3 h for net photosynthesis. The lights were turned off and algae incubated for a further 3 h for dark respiration. Dissolved oxygen concentration was measured using a portable oxygen meter (HachVR, HQ40D Portable Multi Meter) and net photosynthesis/respiration were standardized to fresh weight (gWW) and expressed as μmol O2 g−1 h−1.
Seawater nutrient analysis
To assess nutrient concentrations, seawater samples were taken from both the header tank and a random subset of chambers on the last day of the experiment (day 21). Seawater samples (12 ml) were taken using pre-cleaned syringes, filtered (Whatman GF/F 0.7 μM) and stored in 12 ml polyethylene nutrient tubes at −20°C for later analysis. A QuickChem® 8000 Automated Ion Analyser (LaChat Instruments) was used to determine concentrations of nitrate (NO3−, measured as NO3− + nitrite [NO2−]) and ammonium (NH4+) following methods outlined in Diamond (2008) and Liao (2008).
Percent dry tissue carbon, nitrogen, C:N ratios, and δ13C isotopes
Oven dry seaweed tissue (n = 8 for each species |$\times$| treatment combination ∴ 48 seaweeds total) was analysed for % tissue nitrogen, % tissue carbon, and C:N ratios (calculated as mol:mol). To confirm and study changes in the Ci uptake method of each seaweed species, stable carbon isotopes (δ13C) were determined using a NA1500 elemental analyser coupled to a Thermo Scientific Delta V Plus via a Conflo IV. Tissue was combusted at 1020°C and reduced at 650°C. Carbon stable isotope ratios were normalized using NBS-22, NBS-19, and LSVEC.
Pigment content
For the red seaweeds, L. marginata and P. cirrhosum, phycobilin and total chlorophyll contents were determined using preserved algal material (0.1 ± 0.01 g) following methods outlined in Pritchard et al. (2013). Under dim light, seaweed tissue was ground in a mortar and pestle using liquid nitrogen, transferred to polyethylene centrifuge tubes (15 ml) with 5 ml of ice-cold 0.1 M phosphate buffer (pH 6.8), and left in a fridge at 4°C for overnight extraction of phycobiliproteins. The following day, the solution was centrifuged and the supernatant decantated off and absorbance measured at 564, 592, 455, 618, and 645 nm using a scanning spectrophotometer (Halo RB-10, Dynamica). Phycobilin content were calculated using equations from Beer and Eshel (1985). Chlorophyll content was extracted from the remaining pellets with 5 ml of 100% ethanol. Solution was vortexed and left overnight at 4°C. Solution was again centrifuged and the supernatant absorbance was measured at 629, 649, and 665 nm. Chlorophyll content were calculated using equations from Ritchie (2006).
For the brown seaweed E. radiata, fucoxanthin and chlorophyll contents were extracted from preserved tissue (0.1 ± 0.01 g) using methods outlined in Seely et al. (1972). Frozen tissue was placed in centrifuge tubes (15 ml) with 4 ml of dimethyl-sulfoxide (DMSO) and left to extract for 10 min. Decanted DMSO extract was measured for absorbance using a scanning spectrophotometer (Halo RB-10, Dynamica) at wavelengths of 665, 631, 582, and 480 nm. After removal of DMSO, 6 ml of ice-cold acetone (90% v/v) was added to the tubes with seaweed tissue and left to extract for 30 min. Tubes were agitated sporadically throughout this extraction time and visual observation ensured no remaining pigments in the seaweed tissue prior to decanting off acetone solution. Acetone solution was then measured for absorbance at wavelengths 664, 631, 581, and 470 nm. Fucoxanthin and chlorophyll content were calculated using equations described in Seely et al. (1972).
Statistical analysis
Statistical analyses were performed in the software program R version 4.1.3 (R Core Team, 2022) and graphs were created using SigmaPlot (Systat Software Inc). One-way ANOVAs were used to determine the effect of CO2 treatment on E. radiata blade elongation and erosion, as well as pigment content for each species individually (due to different pigments). To compare the parameters for growth, Ci uptake, DOC production, photosynthesis, respiration, % tissue carbon, nitrogen, and C:N ratios, two-way ANOVAs were conducted with the fixed factors Treatment (2 levels, current, and future), Species (3 levels, E. radiata,L. marginata, andP. cirrhosum) and the Treatment|$\times $|Species interaction. ANOVA assumptions of normality of residuals and homoscedasticity were assessed using diagnostic plots of model residuals and data were transformed where necessary using the package, bestNormalize (Peterson, 2021); see Supplementary Table S2 for data transformations. Where Species was statistically significant and/or an interaction was observed between Treatment|$\times $|Species (p < 0.05), a Tukey’s HSD multiple comparison test was run to distinguish which means were statistically significant from others and are discussed in the results section.
Results
Growth rates
There was no difference between CO2 treatments for growth rates (ANOVA: F(1,39) = 0.07, p = 0.793; Figure 1a) of all three species studied and no interaction between Treatment|$\times $|Species. Species influenced growth with E. radiata growth rates being higher than L. marginata and P. cirrhosum (ANOVA: F(2,39) = 94.967, p < 0.001) but were highly variable under both current (0.022–0.054 gWW−1 d−1) and future CO2 concentrations (0.018–0.053 gWW−1 d−1). L. marginata showed negligible and negative growth rates for both CO2 concentrations, and P. cirrhosum exhibited no to little growth (-0.001–0.019 gWW−1 d−1) under both CO2 concentrations (Figure 1a). Similarly, no difference was observed between current and future treatments for E. radiata blade elongation and distal erosion (elongation ANOVA: F(1,13) = 0.461, p = 0.509 and erosion ANOVA: F(1,13) = 1.145, p = 0.304; Figure 1b).
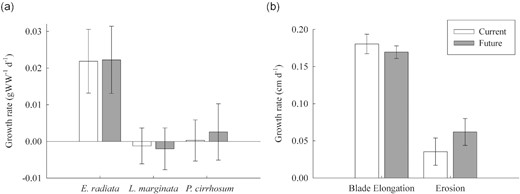
(a) Growth rates (gWW−1 d−1) for E. radiata, L. marginata, and P. cirrhosum under current (400 ppm, pH 7.85–8.15, dark grey bars) and future (850 ppm, pH 7.50–7.80, white bars) CO2 concentrations, and (b) blade elongation and erosion (cm d−1) of E. radiata, measured using the hold punch method, under current and future fluctuating CO2 concentrations. Bars are mean ± SE (n = 8). For two-way and one-way ANOVAs and post hoc test results see Supplementary Tables S2 and S3.
Ci uptake and carbon stable isotopes
CO2 treatment had no effect on Ci uptake (CO2 + HCO3− combined) (ANOVA: F(1, 33) = 0.216, p = 0.645; Figure 2a). Note that air bubbles were inevitably created in each sealed chamber due to the initial sampling of the seawater and could have slightly reduced the Ci in the future treatment due to outgassing however this was considered minimal given the short incubation period and small headspace to volume ratio. Species did influence Ci uptake, with P. cirrhosum taking up more Ci than L. marginata (ANOVA: F(2, 33) = 3.698, p = 0.036; Figure 2a).
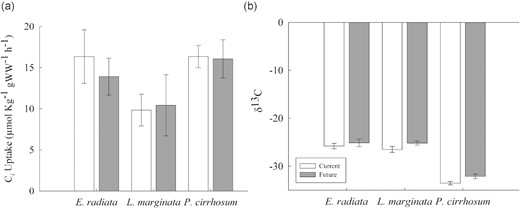
(a) Ci uptake (CO2 + HCO3−) and (b) δ13C isotope values for E. radiata, L. marginata, and P. cirrhosum under current (400 ppm, pH 7.85–8.15, white bars) and future (850 ppm, pH 7.50–7.80, grey bars) fluctuating CO2 concentrations. Bars are mean ± SE (n = 8). For two-way ANOVA and post hoc test results see Supplementary Tables S2 and S3.
To determine the Ci uptake method, carbon stable isotopes were analysed with CO2 treatment having no effect on carbon stable isotopes (δ13C) (ANOVA: F(1, 39) = 0.460, p = 0.502; Figure 2b). There was however an effect of species with P. cirrhosum having more negative ‰ values than E. radiata and L. marginata (ANOVA: F(2, 39) = 461.579, p < 0.001; Figure 2b).
DOC production
There was no difference between future and current ocean CO2 concentrations for DOC release rates (ANOVA: F(1, 37) = 3.664, p > 0.0633; Figure 3). DOC release was highly variable for both treatments for all three species studied with no influence of species on DOC production (ANOVA: F(2, 37) = 0.894, p = 0.418; Figure 3) or the interaction between Treatment|$\times $|Species.
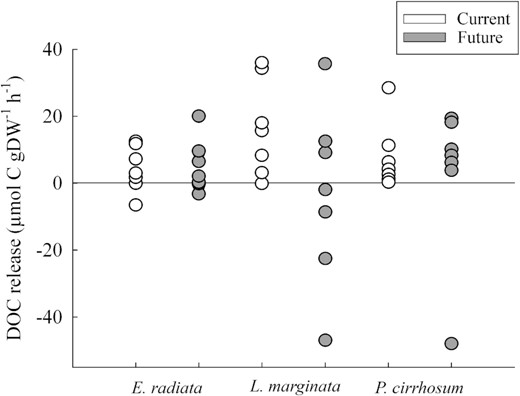
Net DOC production (μmol C gDW−1 h−1) for E. radiata, L. marginata, and P. cirrhosum under current (400 ppm, pH 7.85–8.15, white circles) and future (850 ppm, pH 7.50–7.80, grey circles) fluctuating CO2 concentrations. Circles are replicate seaweeds (n = 8). For two-way ANOVA and post hoc test results see Supplementary Tables S2 and S3.
Photosynthesis and respiration
CO2 treatment had no effect on photosynthetic rates (ANOVA: F(1, 39) = 0.011, p = 0.916; Figure 4a) but species did (ANOVA: F(2, 39) = 7.503, p = 0.001; Figure 4a) with L. marginata exhibiting the highest rates of oxygen production (μmol O2 gWW−1 h−1) of the three species studied. Respiration rates were not influenced by CO2 treatment (ANOVA: F(1, 39) = 0.249, p = 0.668; Figure 4b), species (ANOVA: F(2, 39) = 0.710, p = 0.585; Figure 4b), or the interaction between Treatment|$\times $|Species.
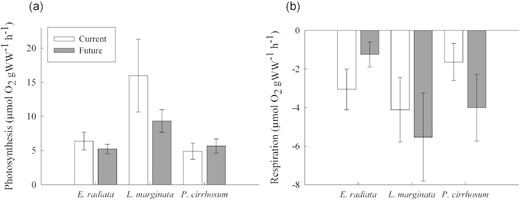
(a) Net photosynthetic rates (μmol O2 gWW−1 h−1) for E. radiata, L. marginata, and P. cirrhosum under current (400 ppm, pH 7.85–8.15, dark grey bars) and future (850 ppm, pH 7.50–7.80, white bars) CO2 concentrations, and (b) respiration rates (μmol O2 gWW−1 h−1) for E. radiata, L. marginata, and P. cirrhosum under current and future fluctuating CO2 concentrations. Bars are mean ± SE (n = 8). For two-way ANOVA and post hoc test results see Supplementary Tables S2 and S3.
Percent tissue carbon and nitrogen and pigment content
CO2 treatment had no effect on % dry tissue carbon (ANOVA: F(1, 39) = 0.299, p = 0.588; Figure 5a), % nitrogen content (ANOVA: F(1, 39) = 25.2, p = 0.0937; Figure 5b), or C:N (ANOVA: F(1, 39) = 0.921, p = 0.343; Figure 5c). For the brown seaweed E. radiata, there were higher pigment contents of both chlorophyll a and fucoxanthin under current compared to future CO2 treatment (chlorophyll ANOVA: F(1, 11) = 6.212, p = 0.029 and fucoxanthin ANOVA: F(1, 11) = 4.433, p = 0.059; Figure 5d). CO2 treatment had no influence on L. marginata chlorophyll and phycobilin content (chlorophyll ANOVA: F(1, 11) = 0.571, p = 0.466 and phycobilin ANOVA: F(1, 11) = 0.547, p = 0.475; Figure 5d) or P. cirrhosum chlorophyll and phycobilin content (chlorophyll ANOVA: F(1, 11) = 0.172, p = 0.686 and phycobilin ANOVA: F(1, 11) = 1.013, p = 0.336; Figure 5d).
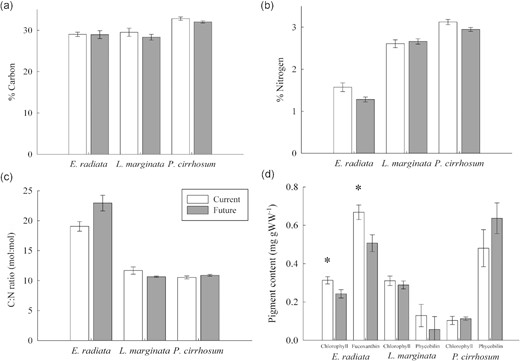
(a) Percent tissue carbon, (b) % tissue nitrogen, (c) C:N ratio, and (d) pigment content for E. radiata, L. marginata, and P. cirrhosum under current (400 ppm, pH 7.85–8.15, white bars) and future (850 ppm, pH 7.50–7.80, grey bars) fluctuating CO2 concentrations. Bars are mean ± SE (n = 8). Significant differences between current and future CO2 indicated by asterisks (*). For one way and two-way ANOVAs and post hoc test results see Supplementary Tables S2 and S3.
Discussion
The physiologies of E. radiata, L. marginata, and P. cirrhosum, did not respond to future compared to current ocean CO2 treatment, regardless of Ci uptake method (CCM vs. non-CCM). Although negligible growth rates were observed for both red seaweeds, photosynthetic rates were positive suggesting that photosynthate (organic carbon created via photosynthesis) was used for other cellular processes—or released as DOC—rather than invested in new tissue growth (Hurd et al., 2014). The isotope values indicated that L. marginata and E. radiata were both using CCMs to take up HCO3− during the experiment (δ13C between −10 and −30‰) and P. cirrhosum only used CO2 (δ13C more negative than −30‰). The only statistical significance for treatment was for E. radiata chlorophyll and fucoxanthin contents which were reduced under OA, likely due to re-arrangement of the light harvesting system at higher CO2 concentrations by which excess pigment molecules are metabolized, termed the “pigment economy” hypothesis (Gordillo et al., 1999, 2015).
Various physiological responses of seaweeds to OA have been recorded (see Table 2 in van der Loos et al. [2019]), and our results show that for E. radiata, L. marginata, and P. cirrhosum there was no benefit of OA on seaweed growth and photosynthesis, i.e., a neutral response (Cornwall et al., 2017; Britton et al., 2019). The neutral response to OA observed in this study may have been a physiological mechanism to counteract the increase of H+ caused by elevated pCO2, which could have driven homeostatic functions such as the synthesis of H+ transport-related proteins, rather than invest metabolic energy into growth (Roleda et al., 2012; Xu et al., 2017). Combined, these findings suggest E. radiata, L. marginata, and P. cirrhosum were not taking up, or metabolizing, more Ci in the future compared to the current ocean treatment.
Relationships between DOC release and OA
These results are just the second published measurements of the effect of OA on DOC release rates by temperate (cool water) seaweeds (the first being, Gordillo et al., 2001). All three species in our study released DOC at similar rates suggesting that Ci uptake strategy did not influence the rate of DOC release—a novel finding, which has not been previously reported in the literature. The rate of DOC release for E. radiata, L. marginata, and P. cirrhosum was not influenced by CO2 treatment, in contrast to the results of similar studies on the Great Barrier Reef, Australia (Diaz-Pulido and Barron, 2020), Spain (Gordillo et al., 2001), and in the Arctic and Antarctica (Iñiguez et al., 2016a, 2017), which all found elevated DOC release under future ocean CO2 concentrations. These previous studies suggest that DOC was released as an overflow under CO2 enrichment to prevent a build-up of photosynthetic products, which were not used for growth, thereby maintaining intracellular C:N balance when environmental conditions were unfavourable (such as nitrogen limitation, discussed below) (Gordillo et al., 2001; Iñiguez et al., 2016a, 2017; Diaz-Pulido and Barron, 2020). In our study, no increase in DOC release under OA was, therefore, likely a result of the non-response of growth, photosynthesis, and Ci uptake for all three seaweeds, causing the intracellular C:N balance to similarly remain unaffected by the OA treatment.
Interactions between OA and nitrogen
In a previous study, the combination of nitrogen enrichment and OA increased growth rates of Ulva rigida in Spain, suggesting that the physiological benefits of OA were dependent on the enhancement effect of CO2 on nitrogen assimilation (Gordillo et al., 2001). In relation to this, DOC released as a % of the primary production was highest under nitrogen limitation and CO2 enrichment suggesting release as a mechanism of overflow during unfavourable environmental conditions (Gordillo et al., 2001). Ambient NO3− concentrations in Tasmania (maintained throughout our experiment with chamber flushing) were 1000-fold lower than used by Gordillo et al., (2001) in Spain (0.00043 mM compared to 0.25–5 mM). The non-response to future ocean CO2 concentrations, therefore, may be explained by the closely linked metabolism of carbon and nitrogen (Turpin et al., 1990; Raven et al., 2004; Roleda and Hurd, 2019). Both red seaweeds were nitrogen sufficient C:N ∼10 mol:mol, however E. radiata, showed nitrogen limitation with C:N ratios ∼20 mol:mol, suggesting that DOC is not released under nitrogen limitation for this species. In contrast, in a parallel study we found that E. radiata, L. marginata, and P. cirrhosum released DOC when intracellular C:N values were lowest annually at ≤10 mol:mol for L. marginata and P. cirrhosum and ∼15 mol:mol for E. radiata, indicating nitrogen sufficiency (Paine et al., in Review). The overflow of DOC from these three seaweed species is, therefore, likely caused by nitrogen sufficiency preventing the “shutting off” of photosynthesis, causing DOC to be released as an overflow to prevent a detrimental build-up of photosynthetic products around RUBISCO (Thornton, 2014; Paine et al., 2021).
Influence of surface epibionts, and the microbiome on responses to OA
There was high variability in DOC release rates with both positive and negative production rates. Although not tested here, negative release rates were likely a result of DOC consumption by the associated seaweed macro- and micro-biome (Haas et al., 2011; Nelson et al., 2013). Lenormandia marginata is a seaweed, which is highly colonized by animal epibionts, usually a combination of spiroid worms (covering ∼1% of the seaweed blade) and bryozoans, which likely influenced the species response to current and future CO2 concentrations. Although seaweeds were cleaned using tissue, the calcifying invertebrates could not be removed because of the risk of tissue damage. Although not tested, the high variability in L. marginata growth, photosynthesis, and respiration results (in particular for the future compared to current CO2 treatment) may be attributed to respiration, or lysis, of the associated surface epibionts under OA. Additionally, there was a high standard deviation for DOC release by L. marginata (current SD ± 14.41 and future SD ± 24.82) with numerous replicates showing evidence of DOC uptake (as observed by negative DOC release rates) potentially occurring as a result of consumption by the macro- and micro-biome (Haas et al., 2011; Nelson et al., 2013). This relationship between seaweed and its associated biome is an area of particular research interest at the moment due to uncertainty in how this relationship is beneficial to the seaweed growth in the marine environment (Egan et al., 2013).
Conclusions
In conclusion, growth, photosynthetic rates, and Ci uptake were not increased in the future compared to current CO2 concentration treatment for either, E. radiata, L. marginata, or P. cirrhosum, regardless of Ci uptake strategy. This result may suggest all species had high affinities for Ci but further research is required to understand the putative responses of Ci uptake mechanisms to future ocean change. OA/CO2 enrichment had no effect on seaweed DOC release likely because overflow of photosynthate was not required as both photosynthesis and growth were similarly unaffected by OA. Our results show no benefit of elevated CO2 concentrations for any of the study seaweeds in a future ocean.
ACKNOWLEDGEMENTS
We thank Pam Quayle, Eloise Bennett, and Olivia Wynn for their help in the laboratory and field. We acknowledge and pay respects to the Palawa people of Lunawanna-allonah and Nipaluna, whose water and land upon which we work.
Funding
This study was funded by the Australian Research Council by Laureate Fellowship number FL160100131 (to PWB), discovery project number DP160103071 funding to GD-P and CLH, and DP200101467 to CLH. DB was funded by the Tasmanian Department of Natural Resources and Environment (AIRF: 2020–047).
Data availability
Available upon request.
Authors’ contributions
ERP: experimental design (lead), conducted experiments (lead), data analysis (lead), and drafting and editing of manuscript (lead); DB: experimental design and laboratory support (supporting), data analysis (supporting), and editing of manuscript (supporting); MS: editing of manuscript (supporting); EAB: laboratory analysis support and editing of manuscript; GD-P: original concept (supporting) and editing of manuscript (supporting); PWB: editing of manuscript (supporting); CLH: original concept, experimental design (supporting), and editing manuscript (supporting)
