


Abstract
The European sea bass (Dicentrarchus labrax) is a commercially and recreationally important fish widely, distributed across the Northeast Atlantic Ocean and Mediterranean Sea. Two distinct lineages that represent the Atlantic and Mediterranean regions have been previously identified, with a hybrid zone close to the Almeria–Oran front. The presence of fine-scale population structure within the Northeast Atlantic region is less clear. Here, we investigated population structure in adult samples obtained from the northern part of the Atlantic range surrounding the UK, Ireland, Belgium, Germany, France, the Netherlands, and Norway, along with outgroups from Portugal and the Mediterranean, using a panel of 41 K single nucleotide polymorphism markers. Population structure among Northeast Atlantic Ocean samples was weak in both spawning—(FST = 0.00022) and feeding—(FST = 0.00032) season data sets, with small pairwise FST values between sample pairs. However, average FST was larger between spawning samples than between feeding samples, with a pattern of isolation-by-distance among the spawning samples, but not the feeding samples, suggesting some biologically meaningful population structure. The largest pairwise FST values at both International Council for the Exploration of the Sea (ICES) rectangle and division scales involved a sample from the west of Ireland. We found no evidence of a gradient in “Mediterranean” ancestry among samples collected around the UK in our data set or in a reanalysis of a published data set where such a pattern had been previously identified. In summary, there was no evidence that sea bass in different ICES divisions within the Northeast Atlantic Ocean represents genetically separate populations. Further work is required to reconcile evidence from tagging and modelling studies that suggest the potential for demographic independence with the genetic data.
Introduction
Managing fish stocks in an environmentally, economically, and socially sustainable manner based on best-available scientific evidence is a legal requirement in both the UK (Fisheries Act 2020) and the EU (European Commission 2013). Achieving these targets is challenging for fisheries managers as they must deal with a legacy of overfishing (Thurstan et al. 2010) and actively plan for future environmental and climatic conditions (Cheung et al. 2012). Accurately delineating fisheries stocks, defined here as groups of individuals with similar demographic and genetic characteristics that respond independently to fishing, is essential for conservation and management as failure to do so can impact stock sustainability (Ovenden et al. 2015).
Genetic methods have been widely used as a tool for delineating populations and have now been used in fisheries management for over five decades (Ovenden et al. 2015). Such methods allow the quantification of gene flow, selection, and genetic drift (Vendrami et al. 2017), and provide insight into genetic connectivity among populations. Furthermore, genetic diversity can be managed in its own right as localized adaptative traits are important to the ongoing health of fish stocks (Limborg et al. 2012). More recently, genetic connectivity has been incorporated into the broader framework of Marine Functional Connectivity, which incorporates information on the “spatial exchange of biomass, individuals, genes, and energy via the collective movements of all marine organisms during their lifetimes” (Darnaude et al. 2024). A multitude of genetic techniques exists to survey genetic diversity; however, single nucleotide polymorphisms (SNPs) are now the most commonly used marker for studies of population structure in a wide range of taxa (Helyar et al. 2011). When genotyped in thousands or millions, they provide considerable statistical power and have accelerated the uptake of genetics into marine fisheries management. SNPs have been successfully employed in many species, such as Atlantic cod Gadus morhua (Johansen et al. 2020), Atlantic herring Clupea harengus (Bekkevold et al. 2023), and Atlantic bluefin tuna Thunnus thynnus (Rodriguez-Ezpeleta 2019). However, despite these successes, even relatively low levels of gene flow can dilute signals of population structure, even when utilising thousands of SNP markers (Limborg et al. 2012). To ameliorate this, the use of SNPs under positive selection have been used to resolve fine-scale population structure in species with large effective population sizes, large migration rates, lack of geographic barriers, and pelagic dispersal phases to their lifecycles (Nielsen et al. 2012, Andersson et al. 2024).
European seabass Dicentrarchus labrax (Linnaeus, 1758) (Moronidae, Teleostei), hereafter referred to as “sea bass,” is a euryhaline, eurythermal, marine fish whose range extends from the Mediterranean Sea to the Northeast Atlantic Ocean (Pickett and Pawson 1994). Sea bass exhibits several characteristics that have implications for population structure, or lack of it. Adults are highly migratory; tagged individuals have migrated distances greater than 1000 km in a 2-month period (Pawson et al. 2007), suggesting the potential for high dispersal and gene flow. Additionally, sea bass reproduce through mass release of pelagic eggs at spawning sites (Mayer et al. 1990), followed by pelagic larval development for 50–70 days (Jennings and Ellis 2015). At present, genetic evidence suggests two distinct genetic lineages: one in the Mediterranean Sea and another in the Northeast Atlantic Ocean (Tine et al. 2014). In the Northeast Atlantic Ocean, ICES manages sea bass based on four stocks: “West of Scotland and Ireland”; “Atlantic-Iberian”; “Bay of Biscay”, and “North Sea, English Channel, Celtic and Irish Sea.” The existence and extent of population structure within these ICES management units are less clear, with considerable effort having been put into elucidating stock structure.
In brief, using allozymes, Child (1992) found evidence for two stocks around the UK: one in the Irish Sea and another in the Thames Estuary and English Channel. Subsequent research using microsatellites (Fritsch et al. 2007), or mitochondrial DNA (mtDNA) found little evidence of genetic structuring within the Atlantic Ocean (Lemaire et al. 2005). However, Coscia and Mariani (2011), discovered low, but significant, FST variance (i.e. genetic differentiation) between Irish Sea and English Channel, as well as Celtic Sea and southern North Sea specimens. Recent research, predominantly using SNPs identified some genetic structure principally driven by Mediterranean introgression into southern (Portuguese) populations (Souche et al. 2015, Ratcliffe et al. 2022). Robinet et al. (2020) identified no strong structure, but detected subtle barriers to dispersal by analysing the introgression of Mediterranean alleles into the Atlantic population(s). Evidence from genetics, tagging, and larval/juvenile pelagic drift studies revealed strong connectivity between the northern (ICES divisions 4.b and c, 7.a, d–h) and southern (ICES divisions 8.a and b) Atlantic sea bass stock units (Robinet et al. 2020, de Pontual et al. 2023, ICES 2023). Potential boundaries were identified within the northern sea bass stock, particularly between the North Sea and the Celtic/Irish Sea suggesting a single meta-population structure representing a group of spatially separated populations interacting at some level through migration, reproduction, and/or feeding (Robinet et al. 2020, de Pontual et al. 2023, ICES 2023).
In this study, we investigated the fine-scale structure of sea bass in the northern Atlantic Ocean stocks—principally the “North Sea, English Channel, Celtic and Irish Sea” and “West of Scotland and Ireland” stocks using an SNP genotyping array (Allal et al. 2020). We utilized samples collected from around the UK, Ireland, Belgium, Germany, France, the Netherlands, and Norway, alongside reference samples from Portugal and the Mediterranean Sea to document spatial patterns of Mediterranean ancestry.
Methods
Sample collection and SNP genotyping
Scales or tissue samples from 1152 sea bass were sourced from around the UK, Ireland, Belgium, France, Germany, the Netherlands, Norway, Portugal, and the Mediterranean Sea from scale archives, market sampling, and bespoke capture, during both the spawning and the feeding seasons (Fig. 1a and b; Supplementary Table S1). All samples were adults with the exception of the Portuguese samples, which were juveniles. Scales were dried and stored at room temperature before cutting into approximate 2 × 2 mm pieces. Dissection equipment was sterilized between samples. One to eight dissected fragments (depending on the size of the original scales) were used for SNP genotyping. DNA extraction and SNP genotyping using the Axiom Dlab chip, a 57 K SNP array developed for sea bass aquaculture studies (Allal et al. 2020) were performed at the GENTYANE INRAE Clermont platform.
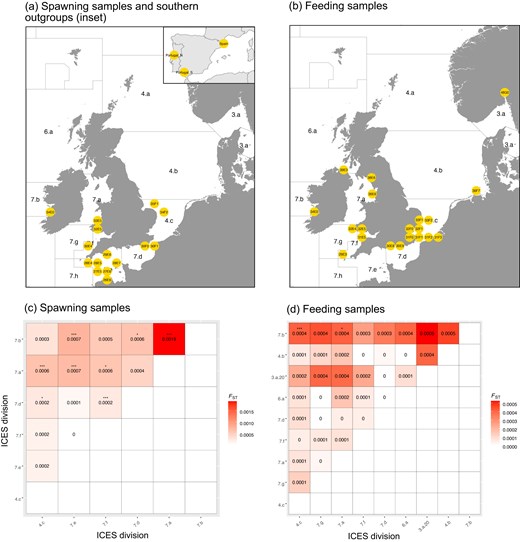
(a and b) Sampling locations for spawning and feeding seasons labelled with ICES rectangle in yellow circles. ICES divisions are also shown. Southern samples are shown as inset in spawning sample map. See Supplementary Table S1a and b for samples sizes and other information for each site. Figure 1c and d. Pairwise FST among ICES divisions for spawning and feeding samples. Cells are coloured by FST value (included as text) and the statistical significance after Bonferroni correction is indicated (*P < 0.05; **P < 0.01; ***P < 0.001).
SNP calling and filtering
Axiom Analysis Suite (5.1.1, Affymetrix 2011) was used to call genotypes across four 384 well genotyping arrays using “Best Practice Genotyping Analysis Workflow.” Array output files with Dish QC values below 0.82, QC call rates below 0.97, and a plate-wide average call rate below 98.5% were excluded from downstream analysis. Further quality filtering was undertaken in PLINK (1.9; Purcell et al. 2007) where SNPs with minor allele frequencies (MAFs) < 0.05 and Hardy Weinberg Expectation (HWE) were significant at <1 × 10⁻¹⁰ were pruned from the dataset. Pruning SNPs based on linkage disequilibrium was not performed as LD was accounted for during the SNP chip design. Individuals missing >5% of SNPs were removed, along with one of any pair of individuals with relatedness > 0.35.
Data set partitioning
To investigate population structure in Northeast Atlantic Ocean, individuals were divided into two data sets that reflected putative spawning and feeding seasons based on the sampling month (Data sets 1 and 2: Northeast Atlantic Ocean spawning and feeding samples). Individuals caught between February and May were assigned as “spawning,” individuals caught between June and November were assigned as “feeding.” Individuals caught in December and January were assigned as “spawning” in ICES divisions 7.d and 7.e and as “feeding” in the North Sea (ICES divisions 7.c and north) (Britton et al. 2023). The Mediterranean Sea and Portuguese samples were included as outgroup samples to detect signals of Mediterranean ancestry for both data sets.
Genetic diversity
Average HE, HO, and FIS (expected and observed heterozygosity and the deficit of heterozygotes in a sample relative to those expected under HWE) were estimated for each ICES rectangle across all SNPs along with % polymorphic loci using the gl.report.heterozygosity of dartR (Gruber et al. 2018, Supplementary Table S1).
Outlier identification
A search for SNPs potentially (a) affected by selection in samples surrounding the UK and (b) loci putatively affected by selection between the Northeast Atlantic Ocean and the Mediterranean Sea was conducted using three different methods: Bayescan version 2.0 (Foll and Gaggioti 2008), OutFLANK (Whitlock and Lotterhos 2015) and pcadapt (Luu et al. 2017). Bayescan parameters were: n = 5000, thinning = 10, pb = 20, pilot = 5000, burn = 50 000, and pr-odds = 100. A q-value threshold of 0.05 was used as a threshold for outlier detection. OutFLANK was run using the default parameters (LeftTrimFraction = 0.05, RightTrimFraction = 0.05, Hmin = 0.1, qthreshold = 0.05) using the gl.outflank wrapper script from dartR (Gruber et al. 2018). Pcaadapt was run using default parameters and a k = 2 and only for the (b) data set that included the Mediterranean and Portugal N sample.
Population structure
Population structure was investigated using several complementary methods. Global FST and associated standard error was estimated using Weir and Cockerham's (1984) theta implemented in the globalFST function of FinePop2 (Kitada et al. 2021) for the spawning and feeding datasets (excluding the Portuguese and Mediterranean Sea samples) at the scale of ICES rectangle and ICES divisions (https://www.ices.dk/data/maps/pages/default.aspx). Only sites with 10 or greater individuals were included in the analyses. Pairwise Weir and Cockerham's FST was calculated using the gl.fst.pop function in dartR (Gruber et al. 2018) for feeding and spawning samples independently and at two spatial scales: (a) among ICES rectangles and (b) among ICES divisions and also for feeding and spawning samples combined. P values were calculated using 1000 bootstraps for the for the independent spawning and feeding data sets and 10 000 permutations for the larger combined matrix. Sequential Bonferroni correction was applied to P values with the R function p.adjust in stats (R core team 2023) for the ICES area data sets and using Benjamini and Hochberg (1995) correction for the combined feeding/spawning matrix due to the large number of pairwise comparisons. Differences in the relative magnitude of pairwise theta between spawning and feeding data sets at the ICES rectangle scale were visualized using network graphs (forceplots) implemented in the qgraph R package after conversion to similarity matrices by dividing each value in both feeding and spawning Fst matrices by the maximum FST value across both data sets in order to standardize edge thickness across the two plots, followed by subtracting each standardized FST from 1 (Epskamp et al. 2012). A permutation test was performed on the magnitude of pairwise theta between the feeding and spawning data ICES rectangle sets using the lmp function of lmperm R package (Wheeler and Torchiano 2025).
Mantel tests were performed using the ade4 package in R (Dray and Dufour 2007) with p-values calculated using 1000 permutations on pairwise FST and pairwise sea distances (km) estimated using the Contour pairwise marine distances script (Assis et al. 2013) on feeding and spawning data sets independently. Portuguese and Mediterranean Sea samples were excluded from the analyses to ensure the results were not driven by these geographically and genetically outlying sites.
Population specific FSTs, which use both differences in allele frequencies and heterozygosity to determine differentiation from a putative ancestral population (Kitada et al. 2021) were calculated using the pop_specificFST function of FinePop2 package in R (Kitada et al. 2021). This data set included all samples (feeding and spawning) and included the Mediterranean Sea and Northern and Southern Portuguese samples. Principal components analysis was performed using the glPCA function of adegenet in R (Jombart 2008) on the spawning and feeding data sets independently, both with, and without, the Mediterranean Sea and Portuguese samples.
Clustering analysis was performed using sparse non-negative matrix factorization (sNMF) in LEA (3.8.0; Frichot and François 2015). Ten repetitions were run for each k. Cross entropy was used to select the best-supported number of clusters (k = 2–10). sNMF results use the best-fitting repetition for the best-supported number of clusters. Outputs were summarized and plotted using the R package pong (Behr et al. 2016). In addition, the relationship between geographic distance from the Mediterranean Sea and the % of the genome with Mediterranean ancestry was investigated by running LEA with K = 2 (Atlantic vs Mediterranean ancestry) for both the feeding and spawning data sets and taking the mean “Mediterranean” ancestry component for individuals in each ICES rectangle, which were plotted against sea distance from the Northern Portugal sample. The lm function in base R was used to fit linear models.
Results
Over one thousand (n = 1152) sea bass samples were genotyped for 57 K SNPs and ∼51 K SNPs passed initial Affymetrix quality controls. Subsequent filtering removed ∼10 K SNPs, with 3547 removed due to strong deviations from HWE, and 6965 due to MAF. After removing samples with < 10 individuals, 901 individual sea bass (representing 38 geographic localities) and 41 022 SNPs were included in downstream analysis. Observed and expected heterozygosities were similar across all Atlantic Ocean samples with HE and HO ∼ 0.35 for all samples (Supplementary Tables S2a and S2b).
Outlier identification
Bayescan identified no SNPs and OutFLANK identified one SNP locus potentially influenced by selection in the Atlantic + Northern Portugal dataset. Pcadapt was not run in the Atlantic only data set due to lack of structure in PCA plots. Bayescan identified 20 loci putatively under positive selection in the Atlantic Ocean vs Mediterranean Sea data set (Supplementary Fig. S1a), OutFLANK identified 1553 loci (Supplementary Fig. S1b) and pcadapt identified 1242 loci. Overall, there were 2037 loci across the three methods with 738 in common between outflank and pcaadapt and 12 loci in common across the three methods.
Population structure
Global FST among the Northeast Atlantic Ocean samples was small, with global FST = 0.000316 (standard error (se) = 0.000054) among the UK Atlantic Ocean spawning samples when partitioned at ICES rectangle level and FST = 0.0002235 (se = 0.0000414) when individuals were combined into ICES divisions. Global FST = 0.00022 (se = 0.000032) among the Atlantic feeding samples when partitioned into ICES rectangles and FST = 0.0001 (se = 0.000026) when individuals were combined into ICES divisions. When including the Mediterranean Sea and Portuguese samples, global, FST was larger, with FST = 0.0062 (se = 0.0000796) for the spawning sample data set.
Within the Atlantic samples surrounding the UK, pairwise FST was small among ICES rectangles, ranging between 0 and 0.0019 for spawning samples and between 0 and 0.0016 for feeding samples. P values for permutation tests revealed some pairwise FST values that were significantly different from zero after Benjamini and Hochberg (1995) correction (Fig. 2) with one feeding sample showing significant differences in almost all pairwise comparisons (32F1; North Sea, ICES division 4.c). Differentiation between ICES divisions was also very low with pairwise theta ranging from 0 to 0.0019 for spawning samples, with Northern Portugal significantly different from all other ICES divisions (Fig. 1c). The Irish Sea (ICES division 7.a) and West Coast of Ireland (ICES division 7.b) showed the greatest differentiation (FST = 0.0019). Pairwise FST between feeding samples was smaller, ranging from 0 to 0.0005 with a some statistically significant comparisons despite the small FST (Fig 1d). The West Coast of Ireland (ICES division 7.b) had somewhat larger (∼double) pairwise FST values than other comparisons.

Pairwise Weir and Cockerham's FST (theta) for feeding (fe) and spawning (sp) sea bass samples labelled by the ICES rectangle from which they were collected (see Fig 1 a, b). All samples comprise at least 10 individuals). Cells are coloured by FST value and the statistical significance after Benjamini and Hochberg (1995) correction is indicated by ***= P < 0.001, **P = 0.01, *P = 0.05. https://www.ices.dk/data/maps/Pages/ICES-statistical-rectangles.aspx.
Pairwise FST were significantly larger between ICES rectangle spawning than between feeding samples (Permutation test, P = 0.015; Supplementary Fig. S2). Differences between pairwise FST of the spawning and feeding assemblages is illustrated using network forceplots (Fig. 3) where similarity (1-FST) is plotted. Thicker bars between nodes (ICES rectangles) indicate greater genetic similarity.

Forceplots of feeding and spawning pairwise similarity (1–FST). The line colour saturation and the width of the edges show the absolute weight and scale relative to the strongest weight in the plot. Nodes represent ICES rectangles and are coloured by ICES division.
Mantel tests revealed a significant relationship between log geographic sea distance and genetic distance (FST) within the Northeast Atlantic Ocean spawning date set (P = 0.031) but not in the feeding data set (P > 0.05) when excluding the Portuguese and Mediterranean Sea samples (Supplementary Figs S2a and b). See Supplementary Table S1a, b for samples sizes and other information for each site and season.
Population (sample) specific FST
The Mediterranean Sea sample had the lowest sample specific FST. Feeding and spawning samples had similar sample specific FST, with one feeding site (32F1, North Sea, ICES division 4.c) and three spawning sites (26E6, English Channel, ICES division 7.e; 34E0, West Coast of Ireland, ICES division 7.b; and 30E4; Bristol Channel, ICES division 7.f) showing higher values (Fig. 4).

Population (sample) specific FST values for feeding and spawning sea bass samples by ICES rectangles, where the initial two-digit number indicates degrees latitude. See Supplementary Table S1a. b for samples sizes and other information for each site and season.
Principal components 1 and 2 accounted for 3.42% and 0.49% of the total variation in the data set, respectively including the Mediterranean Sea and Portuguese samples and the PCA identified clear differentiation between the Northeast Atlantic Ocean samples, the Portuguese samples, and the Mediterranean Sea (Fig. 5a). The two Portuguese samples form a cluster with North and South Portugal samples differentiated on PC2 (Fig. 5a) with two individuals from the Southern Portuguese site intermediate with the Mediterranean Sea cluster. The Northeast Atlantic Ocean samples form a single cluster with clear differentiation from the Mediterranean Sea and Portuguese samples. Principal component analysis on solely the Northeast Atlantic Ocean samples did not reveal any site-specific clusters and there was considerable overlap between individuals across both the ICES division (Fig. 5b) and rectangle scales for both feeding and spawning data sets. The first two PCs each explained 0.43% of the total variation.

Principal component analysis of spawning sea bass samples by ICES division, including (a) and excluding (b) samples from the Mediterranean Sea and Portugal.
Model-based clustering
Model-based clustering identified k = 2 as the largest log-likelihood, with the Mediterranean Sea sample with strong Mediterranean ancestry and the Atlantic samples with lower Mediterranean ancestry (Fig. 6). Larger Ks did not reveal additional population structure within the Northeast Atlantic Ocean (Supplementary Fig. S4). The Southern Portuguese individuals showed an average Mediterranean component of 29%, but with a wide range of Mediterranean ancestry (15%–90%). This suggested the presence of several Mediterranean migrants or admixed migrants in the sample and some individuals that had much lower Mediterranean admixture components typical of Atlantic sites. The Northern Portuguese sample showed an average of 7.8% Mediterranean ancestry, with the samples surrounding the UK showing an average of 1.2%–2.7% Mediterranean ancestry (Fig. 6).
![Output of model-based clustering for spawning (a) and feeding (b) sea bass samples arranged by ICES rectangle [for K = 2 (greatest log likelihood clustering)]. Portuguese and MED outgroups are included in both plots.](https://oup.silverchair-cdn.com/oup/backfile/Content_public/Journal/icesjms/82/5/10.1093_icesjms_fsaf064/2/m_fsaf064fig6.jpeg?Expires=1750675244&Signature=b4rEB8uFIbYp3zDU1h2qUpRe8dO7GczxOqUbHy0UAllWi7p~zCdS4snrhgq5GZe3ecQoYQdZ6gwRhqCO3FXcCwbEY2jMv1GERN52uHAkw1ZzLrdNOkGRwoy~UmXv4tS2-enq5XwNGxtxklGlGXM~xysNk9BOXPyi~GoRtj6YvGvlaT~Zh~mIYPV0VXJbSFUh3sAyNFcVWqZlOgZvw1YHlJy8i~C5VC6Wcg0wAF7ggNn4HYreONfa0VI6uoT08fqDNxEKP-OtzlGTvhf5PsPZxkR6bIpgR~h3Bo2TccKCukGcFN38PeZoX1AtY4PKkAKM8hniTexPhUC7tPWiLBCqNw__&Key-Pair-Id=APKAIE5G5CRDK6RD3PGA)
Output of model-based clustering for spawning (a) and feeding (b) sea bass samples arranged by ICES rectangle [for K = 2 (greatest log likelihood clustering)]. Portuguese and MED outgroups are included in both plots.
Mediterranean ancestry and geographic distance
There was no evidence of a relationship between the admixture proportion and distance from the Mediterranean Sea within the samples surrounding the UK and Ireland or any evidence of genetic breaks associated with ICES division when using solely the samples surrounding the UK and Ireland (Fig. 7). We also investigated the relationship between geographic distance and Mediterranean ancestry using the loci identified by Bayescan, OutFLANK, and pcadapt as putatively affected by selection. Similar patterns were identified as using the whole data set, but confidence intervals were larger (Fig. 8). No genetic breaks among ICES divisions in the English Channel were identified.
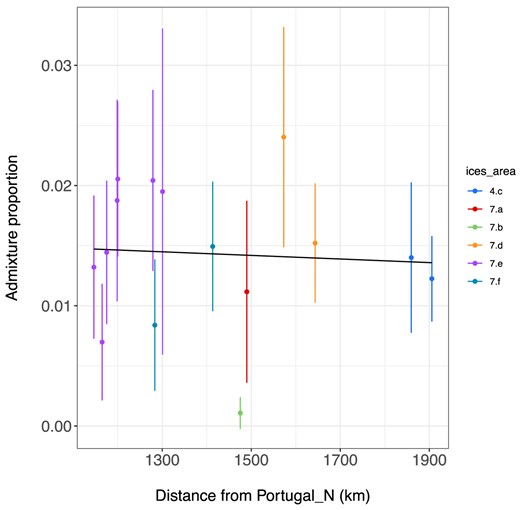
Proportion of Mediterranean ancestry in spawning (a) in relation to geographic sea distance from the Northern Portuguese sample. Error bars are 2x standard error. Populations are coloured by ICES division. Regression line is shown in black (y = 0.02 + 0 * distance + e). Adjusted R2 value = −0.0484, P = 0.5622.
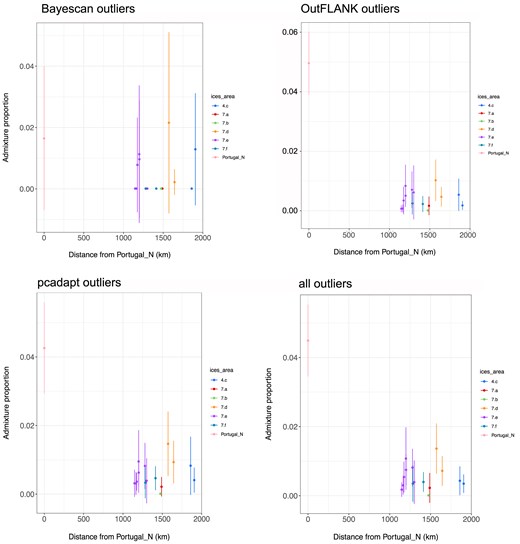
Proportion of Mediterranean ancestry in spawning samples in relation to geographic sea distance from the Portugal North sample using outlier loci. Error bars are 2x standard error. Populations are coloured by ICES division. (a) Bayescan outliers (20 loci), (b) OutFLANK outliers (1553 loci), (c) pcadapt outliers (1242 loci), and (d) all outliers (2037 loci).
Discussion
This study utilized dense sampling of European sea bass from across the Northeast Atlantic Ocean, in waters surrounding the UK, and more than 41 000 SNP markers suggests extremely low levels of population structure. Global and pairwise levels of FST are smaller than those previously identified in other commercially important marine fishes at similar geographic scales (see below). Measures of population differentiation, as measured by FST, were small across almost all sample pairs with statistically significant differences identified mainly in comparisons involving a few specific sites. The West of Ireland (ICES division 7.b) spawning sample was the most differentiated of the samples with a higher pairwise FST value and was statistically significantly differentiated from the Irish Sea (ICES division 7.a) with lower pairwise FST values compared to other divisions. While pairwise FSTs were small, spawning samples had significantly larger pairwise FST values than feeding samples, suggesting some biologically meaningful structure within the data set. There was evidence of isolation-by-distance among spawning samples surrounding the UK and Ireland, but not within the feeding data set. Principal component analysis and model-based clustering failed to identify any evidence of population structure within the Northeast Atlantic Ocean samples. We identified an expected steep decline in Mediterranean ancestry between the Mediterranean Sea and the Northeast Atlantic Ocean, but there was no evidence of a decrease in Mediterranean ancestry in relation to geographic distance within the Northeast Atlantic Ocean samples (when excluding Portugal).
Population structure
Overall, we identified low levels of population structure among sea bass in the Northeast Atlantic Ocean. Global FST was small in both spawning and feeding data sets. Global FST ranged between 0.0001 and 0.000316 depending on the scale (ICES rectangles vs divisions), and between spawning and feeding collection periods. This is comparable to the FST = 0.0002 estimated in the SNP-based sea bass study of Robinet et al. (2020), which included a wider sampling area, but fewer SNPs (n = 1012). However, it is smaller than the value of FST = 0.009 found by Coscia and Mariani (2011) using microsatellite markers. FST values in marine fish are typically considered to be small, with Ward et al. (1994) identifying an average FST of 0.062 across 57 marine species. This value was estimated using mainly allozyme based studies, but more recent analyses using SNP markers have found comparable values. For example, Wright et al. (2021) found a global FST of 0.045 in Atlantic cod (Gadus morhua) sampled from around the Scottish coastline, which is almost 2 orders of magnitude greater than found here in sea bass suggesting much lower levels of genetic structure in sea bass than typically found in cod.
Pairwise FST values were also small at both the ICES rectangle and ICES division scales. However statistically significant pairwise comparisons were identified within the data set at both ICES scales. The west of Ireland sample had the highest pairwise FST value of all comparisons which could indicate this area is more genetically isolated than other areas in the study, but as the result is based on a single sample, caution is needed in any inferences drawn. A single ICES rectangle in the North Sea off Clacton (32F1) during the feeding period was an outlier in both the population specific analyses and had 34 out of 34 pairwise comparisons, which were statistically significant (after Benjamini and Hochberg correction). The rectangle did not have a small sample size nor geographic isolation that could explain the higher levels of structure or higher population specific FST in this sample. However, the sampled scales were archived in 2007 and the age may have impacted the genotyping. Other outlying samples are the spawning samples from the west coast of Ireland (34E0) which are in a different ICES stock to the other samples in the data set (“West of Scotland and Ireland”). This sample has 18 of 34 statistically significant pairwise comparisons. This sample is a geographical outlier and the sample size is the smallest that we included in the analysis (n = 10). Other parameters (HE, HO, and FIS) do not appear unusual, but it is also an outlier on the population specific FST plot (Fig. 4). Spawning samples 26E6 and 30E4 (English Channel, ICES divisions 7e and 7d) were outliers on the population specific FST analysis and similar to the outlying feeding sample had high FIS indicating more heterozygotes than expected within the sample.
The low levels of population structure in sea bass identified here are predicted by particle tracking models, which follow the modelled trajectories of planktonic eggs and larvae and individual tagging experiments. Particle tracking models suggest that there is considerable connectivity between putative sea bass spawning areas around the UK (Beraud et al. 2018, Graham et al. 2023) with particles originating in the Western English Channel moving further east and north into the North Sea as well as into the Bristol channel. Interestingly, particles originating in the Bay of Biscay were also shown to settle in the western English Channel. Tagging studies have also demonstrated large-scale movements of adult sea bass in UK waters, showing some individuals moving between the Celtic Sea/Irish Sea and the North Sea (Wright et al. 2024) and some individuals moving between the Bay of Biscay and the Western English Channel (de Pontual et al. 2023).
The significantly higher level of population structure found in spawning samples compared to feeding samples suggests that there is increased population integrity during the spawning season (January–May) than in the feeding season, which is expected when investigating marine fish stocks based on genetic parameters (Carvalho and Hauser 1994). Sea bass are known to form spawning aggregations between February and June in waters surrounding the UK (Pickett and Pawson 1994, Pawson et al. 2007) and migrants can exhibit strong fidelity to summer feeding and winter spawning areas (de Pontual et al. 2023).
Outlier loci can be useful in identifying fine scale population structure in marine species where effective population sizes are large, reducing the rate at which drift can modify allele frequencies (Nielsen et al. 2012). Three methods were used in this study to identify outlying loci, which may have been influenced (directly or indirectly through linkage) by some type of selection. We identified a single locus that was likely affected by selection within the UK Atlantic samples using OutFLANK and none with Bayescan. However, including the Mediterranean Sea sample resulted in larger numbers of putatively selected loci;–20 markers with Bayescan and 1530 with OutFLANK and 1242 with pcadapt, reflecting the effect of numerous genetic barriers to gene flow that exist between Atlantic Ocean and Mediterranean sea bass lineages (Tine et al. 2014). We used SNPs under divergent selection between lineages (i.e. those with reduced introgression rates) to investigate within-Atlantic population structure by investigating the relationship between Mediterranean ancestry and geographic distance from the Mediterranean Sea. Using this strategy, Robinet et al. (2020) identified a break in Mediterranean ancestry between the eastern and western parts of the English Channel, suggesting a barrier to effective dispersal in this area. Robinet et al. (2020) also found a slight increase in Mediterranean ancestry northward to the English Channel, which was attributed to “allele surfing” of rare Mediterranean alleles in the northern part of the species range due to northern expansion, or more efficient selection against weakly deleterious Mediterranean alleles in the larger populations of the Bay of Biscay than in populations around the UK. We did not identify such a break in the English Channel in this study using either the full data set or solely outlier loci (Figs 7 and 8), or a trend of increasing MED ancestry as distance from the Mediterranean Sea increased among the northeastern Atlantic samples. To further investigate this discrepancy, we accessed genotype data and ancestry output files from the Robinet et al.'s (2020) paper (https://zenodo.org/records/3989825). We identified a number of cases where unexpectedly high-individual MED ancestry was associated with high levels of individual missing data. Thus, we refiltered the Robinet et al. (2020) data to exclude individuals with >5% missing data (Supplementary Fig. S5a and S5b) and replotted the Robinet et al. (2020) MED ancestry figure (Robinet et al. Fig. 4a and c), which no longer showed an increase in MED ancestry in the northeast Atlantic along with smaller error bars across the whole data set as a result of outlying individuals being removed (Supplementary Fig. S6a and S6b). The finding of increasing Mediterranean ancestry in the samples around the UK, appears to have been driven by a single sample from the North East UK (NEUK), which had a small sample size (n = 8) and large FIS. Two individuals had very high levels of missing data and large MED ancestry (Supplementary Fig. S5a). Thus, a combination of small sample size and missing data in some individuals appears to have led to an artefactual increase in MED ancestry in the northeastern Atlantic from the English Channel northwards in the Robinet et al. (2020) paper. After filtering the Robinet et al.'s (2020) data, the results for the northeastern Atlantic are similar to those found in our study.
Management implications
This study identified weak structure within the Northeast Atlantic Ocean sea bass stock, but identified some structure between the West of Ireland and Irish Sea/English Channel, indicating the potential for differentiation between the "West Coast of Ireland and Scotland" and “North Sea, English Channel, Celtic and Irish Sea” stocks. Some previous studies have indicated population structuring across similar geographic areas, (e.g. Fritsch et al. 2007), but the results were not consistent (e.g. Child 1992, Coscia and Mariani 2011). Large scale studies have not found distinct population structure within the northern stock (e.g. Souche et al. 2015, Robinet et al. 2020) making the identification of stocks based on genetic structure difficult (ICES 2023). However, high levels of fidelity to feeding and spawning areas as adults (de Pontual et al. 2023) would suggest that smaller management units are needed than are currently in place to effectively manage the stock and ensure sustainability. As a result, it is important to consider connectivity between areas in terms of pelagic drift of eggs and larvae, and adult movements to define subpopulations that could be included within a single metapopulation management unit that could be used to drive future ICES assessments (ICES 2023).
Bringing together all existing data on genetics, pelagic drift, and migration suggest that “Northern” and “Biscay” sea bass are not separate populations but exist as a metapopulation with potentially distinct subpopulation components with connectivity between current ICES advice units (ICES 2023). However, there was insufficient evidence to identify the subpopulations or zones of mixing as the evidence was contradictory (ICES 2023). In addition, it is likely that connectivity exists between all four of the existing stock units (i.e. Northern, Biscay, Atlantic-Iberian, and West of Scotland and Ireland), so further genomics, tagging, biophysical modelling, and otolith microchemistry studies, are needed to understand exactly how sea bass within the Northeast Atlantic Ocean are connected, the subpopulations that should be considered, in order to define the relevant management units. Utilizing additional analytical methods may also be informative, including novel population-specific genotype by phenotype associations to identify introgressed individuals and migrants (Leitwein et al. 2024), species essential habitat modelling to identify suitable spawning habitat and environmental barriers (Dambrine et al. 2021), and dynamic energy budget modelling to predict size and season specific distributions based on physiological parameters (Teal et al. 2012).
Acknowledgements
Thanks to Carole Confolent, Pauline Izorche, and Benjamin Tyssandier at GENTYANE INRAE who ran the SNP chip. P.K.K. and S.I.P. would like to thank the president (Mr Margaritis Mproumpis) and the members of the “Xanthi Spearfishing Club,” in Xanthi, Greece for their assistance in acquiring samples.
Author contributions
M.I.T., P.D.L., I.C., D.M., and K.H. conceived the study, developed the approach, completed the analysis, and drafted the manuscript. M.B., T.C.C., H.A.F., K.G., F.G., T.H., P.K.K., R.K., T.L., H.L., F.M., I.M., P.P., J.C.O.P., M.P.B., M.R., W.R., V.S., A.S., M.L.T., C.W., P.V., S.V., and M.S.W. provided samples for analysis. All authors gave critical comments on each draft of the manuscript, as well as guidance on interpretation of the results.
Conflict of interest
None declared.
Funding
This research was supported by the UK Department for Environment, Food, and Rural Affairs (Defra Grants FRD009 and FRD052) and UKRI [MR/V023578/1]. F. M. was supported by Fundação para a Ciência e Tecnologia, I.P. (FCT) in the scope of Decree-Law 57/2016, CFE-UC by project reference UIDB/04004/2020 and DOI identifier 10.54499/UIDB/04004/2020 (https://doi.org/10.54499/UIDB/04004/2020), and Associate Laboratory TERRA by project reference LA/P/0092/2020) and DOI identifier 10.54499/LA/P/0092/2020 (https://doi.org/10.54499/LA/P/0092/2020)
Data availability
Data files underpinning the analyses contained in this study have been archived on Zenodo (doi: 10.5281/zenodo.15025594). R Scripts for analyses and plots are available from Github (https://github.com/martiniantaylor/ICES_sea_bass).
