


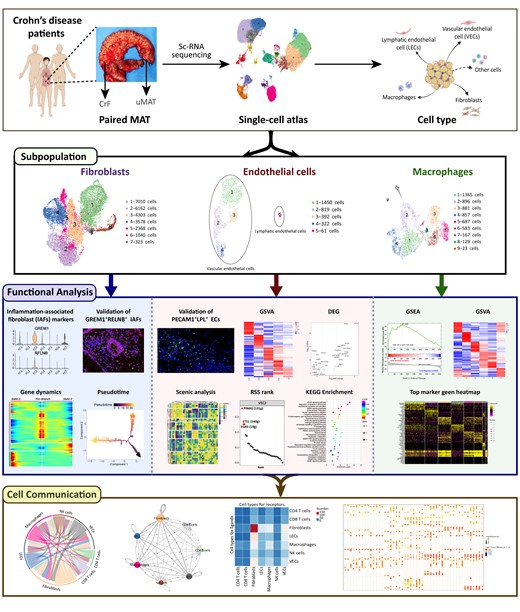
Abstract
Creeping fat (CrF) has been recognized to play a positive role in Crohn’s disease (CD) progression, yet the cellular compositions within mesenteric adipose tissue (MAT) and their potential mechanism in CrF formation are poorly understood.
Analysis of 10X single-cell RNA sequencing was performed on 67 064 cells from 3 pairs of surgically resected samples of CrF and their uninvolved MAT. The results were validated in another cohort with 6 paired MAT samples by immunofluorescence.
All samples manifested excellent consistency and repeatability in our study, and 10 cell types from the transcriptome atlas, including 20 clusters, were identified. In CrF, a specific vascular endothelial cell subpopulation highly expressing lipoprotein lipase was first identified, with a significantly increased proportion. This vascular endothelial cell subpopulation manifested robust peroxisome proliferator-activated receptor γ (PPARγ) transcription activity and an upregulated PPAR signaling pathway and was involved in lipid metabolism and the antibacterial response. A novel fibroblast subpopulation (FC3) with remarkable GREM1 and RFLNB expression was identified and validated to predominantly accumulate in the CrF. The FC3 was annotated as inflammation-associated fibroblasts, which are characterized by inflammatory responses and the regulation of Smad phosphorylation related to intestinal fibrosis. The trajectory of fibroblasts revealed their pro-inflammatory and profibrotic conversion tendency during CrF formation with corresponding gene dynamics. Additionally, we unprecedently dissected the different origins and functions of 6 macrophage subclusters within the myeloid compartment.
Our results uncover the cellular heterogeneity in the MAT of CD and the role of these various cellular compositions in CrF development. This comprehensive understanding of CrF provides future directions for in-depth research on and potential targets for MAT-based treatment.
Lay Summary
This is the first study that provides a comprehensive single-cell transcriptomic atlas in mesenteric adipose tissue (MAT) of Crohn’s disease and elaborates the functional diversity and dynamic changes of the cellular components during creeping fat (CrF) formation.
Creeping fat (CrF) is a pathological feature of Crohn’s disease (CD) and is closely associated with disease progression, but the cellular compositions within mesenteric adipose tissue (MAT) and their potential mechanism in CrF formation are poorly understood.
This is the first study that provides a comprehensive single-cell transcriptomic atlas of MAT in CD and elaborates on the functional diversity and dynamic changes in cellular components during CrF formation.
This comprehensive understanding of CrF provides future directions for in-depth research on and potential targets for MAT-based treatment.
Introduction
Crohn’s disease (CD) is an inflammatory bowel disease (IBD) characterized by chronic and recurrent inflammation in the gastrointestinal tract. The hypertrophic mesenteric fat attached to the outside of the intestinal wall, known as creeping fat (CrF), was first described in 1932 and has been identified as a unique hallmark of CD.1 However, the role of CrF and its mechanism in disease progression have yet to be clarified.
Creeping fat wraps around the outside of the intestine, especially the inflamed ileum with fibrosis and stricture, and covers up to 50% of the bowel circumference.2 Some previous studies3,4 defined CrF as a protective factor in defending against bacterial translocation and could attenuate intestinal inflammation in CD. Conversely, the altered tissue structure, abnormal cell aggregation, and overproduction of cytokines in CrF also lead to an uncontrollable inflammatory response and disease progression.5 The increased mesenteric fat mass has been regarded as a risk indicator for postsurgical recurrence of CD.6 New intestinal resection of surgical techniques such as the mesentery exclusion proposed by Coffey et al was reported to have a reduced postoperative recurrence rate.7 To date, CrF has been recognized as an important organ involved in the pathogenesis of CD. The special structure of lymphatic system, infiltration of macrophages, and translocation of bacteria may not only participate in CD development but also affect intestinal fibrosis.8,9 Nevertheless, the lack of reliable animal models leads to difficulties in elucidating the mechanism of CrF.
The recent development of high-throughput single-cell RNA sequencing (scRNA-seq) technology has allowed us to explore cellular heterogeneity, identify new cell subsets, and delineate relationships between cell lineages. Using this method, Ha et al10 outlined the progenitor cells, immune cells, and endothelial cells (ECs) in CrF and compared them with those in the uninvolved MAT (uMAT) of CD patients and healthy controls. Importantly, they found that microbial translocation from the gut was the central cue for CrF development and stimulated tissue remodeling by M2 macrophages. Enhanced lipid metabolism and synthesis were found in ECs and macrophages from CrF, suggesting their engagement in the development of CrF. Creeping fat was characterized by a primary immunogenic and fibrotic tissue, whereas the adjacent uMAT was likely a transitionary state between CrF and healthy MAT. However, the detailed changes of cells in MAT were not clarified.
In the current study, we profiled the transcriptome of 67 064 single cells by scRNA-seq in 3 paired CrF and adjacent uMAT samples from the stenotic and inflamed ileum of patients with CD to decipher the cellular heterogeneity, and we explored the potential mechanism of CrF and target therapy based on MAT.
Materials and Methods
Patient MAT Samples for scRNA-seq and Validation
A total of 18 surgically resected specimens from patients with a diagnosis of CD due to inflammatory ileal obstruction were collected from the Shanghai Tenth People’s Hospital of Tongji University and the Xinhua Hospital affiliated to Medical College of Shanghai Jiaotong University. We conducted scRNA-seq analysis in 3 CrF (hypertrophic mesenteric fat attached outside the inflamed and stenotic ileum) and uMAT sample pairs. Validation was performed in another 12 samples from 6 patients with CD. The clinical characteristics of the patients are presented in Table S1.
The study was approved by the Institutional Ethics Committee of the Shanghai Tenth People’s Hospital (SHSY-IEC-4.1/20-152/01). Patients provided written informed consent for this work.
ScRNA-seq Data Quality Control and Analysis
The raw sequencing data were initially processed by the 10x Genomics Cell Ranger suite (version 3.1.0), including cellular barcode demultiplexing, genome and transcriptome reference mapping, and read downsampling to enable data aggregation across samples with variable reads, ending with a unique molecular identifier (UMI) count matrix per gene per cell. This count matrix was then fed to the R package Seurat11 (version 3.1.2) for additional filtering. To remove cells of low quality or from likely multiplet captures, a novel approach was adopted where cells with a mean UMI count per gene at least 2 standard deviations away from the sample mean were assigned as possible multiplets and discarded. Following visual inspection of the fraction of mitochondrial UMI counts, cells with >20% counts from mitochondrial genes were further removed. DoubletFinder (version 2.0.2) was additionally used to remove double cells missed in the previous step. Library size normalization was performed next on the resulting matrix to generate the normalized count matrix.
To identify the top variable genes across single cells, the method described in Macosko et al12 was applied, where the average expression and dispersion for each gene were calculated and then subsequently divided into 20 bins based on the value. Batch effects were further removed by the mutual nearest neighbor (MNN) method implemented in the R package batchelor. Cells were clustered using the shared nearest neighbor (SNN) approach with different resolutions and were visualized in 2 dimensions by uniform manifold approximation and projection (UMAP). Marker genes for each cluster were identified by the FindAllMarkers function (test.use = bimod) in Seurat.
Differentially Expressed Gene Analysis and Functional Enrichment
To define feature genes among each cell type or cluster, differentially expressed genes (DEGs) were identified using the “FindMarkers” function in the Seurat package with a nominal P value < .05 and log-scaled fold change >0.58. Gene ontology (GO) enrichment and Kyoto Encyclopedia of Genes and Genomes (KEGG) pathway enrichment analyses of DEGs were performed by gene set enrichment analysis (GSEA)13 with the Molecular Signatures Database (MSigDB) C5 GO gene sets and C2 KEGG gene sets (Version 7.2). The GSEABase package (version 1.44.0) was used to load the gene set file from the KEGG database (https://www.kegg.jp/). To assign pathway activity estimates to individual cells, single-sample gene set variation analysis (GSVA; version 1.30.0)14 was applied to show the significantly different signaling pathways. Differences in pathway activities scored per cell were calculated with the Limma package (version 3.38.3).
Single-cell Regulatory Network Inference and Clustering Analysis
To assess which transcription factors were responsible for the differences in expression between endothelial cells from CrF and uMAT samples, single-cell regulatory network inference and clustering (SCENIC) analysis was used in the construction of regulation networks and in the identification of different cell states from scRNA sequencing data by using the motifs database for RcisTarget and GRNboost (SCENIC15 version 1.1.2.2, which corresponds to RcisTarget 1.2.1 and AUCell 1.4.1) with the default parameters. To evaluate the difference between cell clusters based on transcription factors or their target genes, the significantly expressed regulons were identified based on the calculated regulon activity score (RAS) and calculated by the Limma package. The regulon specificity score (RSS) was calculated based on the Jensen-Shannon divergence (JSD).16 The connection specificity index (CSI) for all regulons was calculated with scFunctions (https://github.com/FloWuenne/scFunctions/).
Immunofluorescence Staining
Mesenteric adipose tissue samples were fixed in 4% paraformaldehyde, dehydrated, paraffin embedded, and sectioned at 12-μm thickness. The following primary antibodies were used to detect the expression of specific proteins: rabbit anti-Decorin (1:100, ab175404, Abcam, Cat. No. GR312942-12), rabbit anti-Collagen 1 (1:250, ab260043, Abcam, Cat. No. GR3375275-4), mouse anti-Gremlin-1 (1:100, Santa Cruz Biotechnology, Cat. No. D0621), rabbit anti-FAM101B (1:50, PA5-56579, Thermo Fisher Scientific, Cat. No. PA5-56579), rabbit anti-PECAM1 (1:100, Servicebio, Cat. No. GB11063-2), and rabbit anti-Lipoprotein lipase (1:100, Abcam, Cat. No. Ab172953). The Cy3 (red)- or Alexa 488 (green)-labeled secondary antibodies (Servicebio) and DAPI (Servicebio, Wuhan, China) were used. Immunofluorescence was visualized with a fluorescence microscope (Nikon). The colocalization analysis was calculated by Manders’ colocalization coefficients based on pixel-intensity-correlation measurement, and the positive cells of each section were counted in 3 randomly selected fields under 400x magnification using ImageJ software (National Institutes of Health, Bethesda, MD, USA).
Cell Developmental Trajectory
The cell lineage trajectory of fibroblasts was inferred by using Monocle 2 to determine the dramatic translational relationship among the different clusters.17 The “differentialGeneTest function” was used to drive significantly changed genes from each cluster in Monocle 2 with a q value <0.01. To track changes over pseudotime, the expression of genes was plotted by the “plot genes in pseudotime function.”
Cell-cell Interaction Analysis
Biologically relevant ligand-receptor (LR) interactions were performed identified by CellPhoneDB (v 2.0), which can analyze different cell types’ interactions at the molecular level in order to identify significant LR pairs within CrF and uMAT cells. The cell type–specific LR interaction between cell types was identified according to the specific expression of the receptor by one cell type and a ligand by another cell type. For a given LR pair, the statistical significance was assessed by randomly shuffling the cluster labels of all cells and calculating the LR pair interaction score between 2 cell types. To display the cell-cell communication networks, the R packages Igraph and Circlize were utilized.18
Statistical Analysis
Statistical analyses and graph generation were performed using GraphPad Prism 6 (La Jolla, CA, USA). Continuous data were expressed as the mean ± standard deviation (SD). Comparisons between 2 groups of samples were evaluated by unpaired Student t test. A P value of <0.05 was considered statistically significant.
Results
Single-cell Expression Atlas Uncovered Diverse Cell Types in the MAT of CD
To investigate the heterogeneity of the cell populations and the molecular and pathway characteristics of MAT in CD, we performed scRNA-seq on 3 CrF and adjacent uMAT sample pairs from CD patients with an inflamed and stenotic ileum using the droplet-based 10X Genomics platform (Figure 1A). None of the patients had a history of biological agent or glucocorticoid use before surgery.
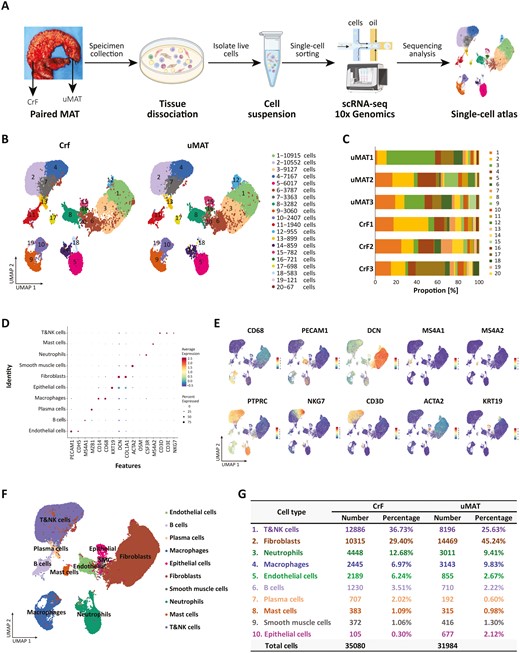
Single-cell RNA sequencing reveals cellular heterogeneity in CrF and its adjacent uMAT. A, Workflow of the sample preparation, sequencing, and bioinformatics analysis. B, UMAP plot revealing twenty cell clusters from CrF and uMAT samples. C, The proportion of cells from each sample in each cluster. D, Dot plot of representative molecular signatures for each cell type. E, UMAP plots showing typical markers of each cell type. F, UMAP plot displaying 10 cell types in MAT from CD. G, Cell numbers and percentage of each type from CrF and uMAT samples.
A total of 67 064 high-quality single cells (31 984 from CrF and 35 080 from uMAT) were obtained and divided into 20 clusters (Figure 1B). All 6 samples from 3 patients exhibited excellent consistency and repeatability according to the UMAP projection (Figure S1). Except for cluster 18, the other clusters contained cells originating from all samples (Figure 1C). Based on the typical markers (Figure 1D, E), we identified these clusters as 10 distinct cell types, including ECs (PECAM1, CDH5; 4.5%), B cells (MS4A1; 2.9%), plasma cells (MZB1; 1.3%), macrophages (CD14, CD68; 8.3%), epithelial cells (KRT19; 1.2%), fibroblasts (DCN, COL1A1; 37.0%), smooth muscle cells (ACTA2; 1.1%), neutrophils (OSM, CSF3R; 11.1%), mast cells (MS4A2; 1.0%), and T&natural killer (NK) cells (CD3D, CD3E, NKG7; 31.4%; Figure 1F). Plasma cells from CrF were obviously expanded compared with those from uMAT (1.99%±0.15% vs 0.58%±0.38%; P = .0039), whereas the other cell types showed no significant difference between the 2 groups (Figure 1G and Figure S2).
These analyses demonstrated a complex cellular ecosystem of MAT in CD patients. We further investigated the heterogeneity and functions of ECs, fibroblasts, and myeloid cells previously described to be associated with the pathogenesis of CrF.10
A Special Subcluster of VECs With High LPL Expression May Contribute to CrF Formation via Peroxisome Proliferator-activated Receptor Signaling
The only recent evidence10 analyzed by scRNA-seq in the MAT of CD found that a certain number of ECs existed in CrF with upregulated pathways for triglyceride and neutral lipid catabolic processes, indicating their role in tissue remodeling in CrF. However, the cellular compositions and functions have not yet been unveiled. In our research, we deeply deciphered the molecular disparity of ECs between CrF and uMAT. ECs accounted for 4.54% (3,044/67,064) of all detected cells, of which 2,189 (71.91%) were derived from CrF, while 855 (28.09%) were derived from uMAT. Endothelial cells were further classified into 5 subclusters according to canonical lineage markers (Figure 2A). We annotated 4 clusters (VEC1-4, PECAM1 + CDH5+) as vascular ECs (VECs) and one cluster as lymphatic ECs (LECs, FLT4 + PDPN+; Figure 2B). The proportion of VEC2 in CrF was significantly higher than that in uMAT samples (28.97%±7.18% vs 13.84%±3.15%; P = .0289, Figure 2C). A heatmap showed that BTNL9, CD300LG, CA4, LPL, and FMO2 were the top 5 most highly expressed genes in VEC2 (Figure 2D). The key lipolytic enzyme lipoprotein lipase (LPL) is recognized as an adipogenic marker,19 and mediates fatty acid (FA) uptake and lipid synthesis as the downstream molecule of the peroxisome proliferator-activated receptor (PPAR) signaling pathway in adipose tissue (AT).20,21 We validated the expression of LPL in the cytoplasm of ECs (PECAM1+) by IF. A higher percentage of LPL+PECAM1+ ECs was observed in CrF than in uMAT (5.04%±0.79% vs 0.60%±0.21%,;P = .0016, Figure 2E).
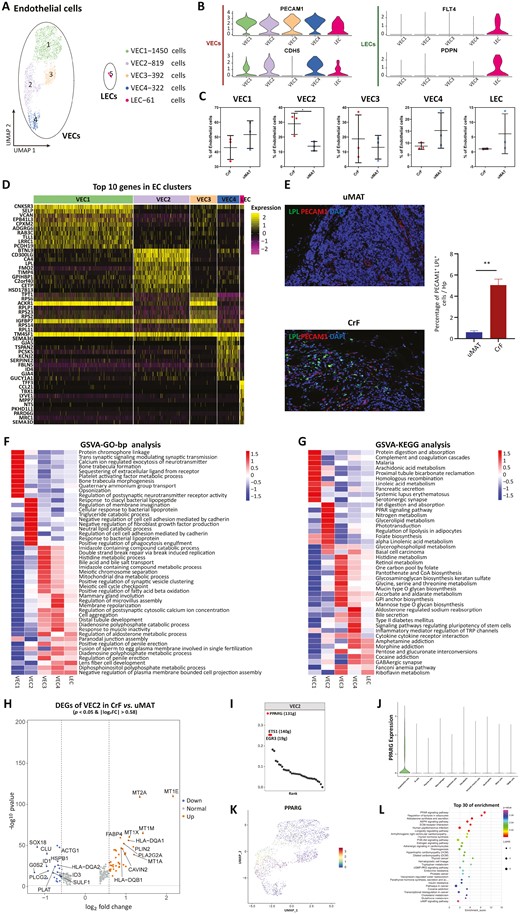
Subclustering of ECs reveals a special subcluster of VECs. A, UMAP plot showing 5 subclusters of ECs derived from CrF and uMAT. B, Expression of marker genes for VECs and LECs. C, Proportions of each subcluster of ECs in CrF and uMAT. D, Heatmap displaying the top expressed genes in each subcluster of ECs. E, The higher expression of PECAM1+LPL+ cells by immunofluorescence double staining (left) and significantly higher percentage of positive cells (right) in CrF than in uMAT. F, GO analysis of biological processes among each EC subcluster. G, GSVA of the hallmark pathways in the EC 1-EC5 subcluster. H, Volcano plot showing differentially up- (red) and downregulated genes (green) in VECs between CrF and uMAT. I, The top 10 regulons of VEC2 based on RSS ranking positions. J, Violin plots showing the expression of PPARγ in 10 cell types using. K, PPARγ expression in 4 VEC clusters using UMAP. L KEGG enrichment for target genes of PPARγ. *P < .05. **P < .01.
Gene ontology enrichment by GSVA showed that VEC2 mainly participated in triglyceride and neutral lipid catabolic processes and the response to bacteria, including diacylglycerol lipopeptide, bacterial lipopeotein, and phagocytosis engulfment (Figure 2F). Similarly, KEGG analysis showed that PPAR signaling transduction and fat digestion and absorption were robustly enriched in VEC2 (Figure 2G). Peroxisome proliferator-activated receptor γ is a necessary regulator of the PPAR signaling system, and its increased expression in the CrF of CD patients has been previously confirmed.22 Peroxisome proliferator-activated receptor γ activation not only mediates lipid absorption and storage in VECs but also converts VECs to adipocytes in AT.23 In addition, PPAR upregulation enhances the anti-inflammatory effect of ECs after bacterial exposure through internalization and infection resistance.24,25 Interaction between the translocated microbiota and cellular components in the MAT of CD is an indispensable cause of mesenteric expansion.
To further study the functional distinction of VEC2 between CrF and uMAT, DEGs were performed and the expression levels of metallothioneins (MTs), including MT1E, MT1M, MT1X, MT1A and MT2A, were significantly increased in VEC2 from CrF (Figure 2H). Metallothioneins facilitate the proliferation of VECs and inhibit their apoptosis.26 This upregulated gene expression may lead to angiogenesis in the CrF. Three lipometabolism-related genes, including FABP4, PLIN2 and PLA2G2A,27–29 were highly expressed in CrF-derived VEC2 (Figure 2H). In addition, GSEA data manifested increased PPAR activation in CrF-derived VEC2 (Figure S3A). The results illustrated that VEC2 in CrF was endowed with enhanced proangiogenic and adipogenic properties.
By SCENIC analysis, the PPARγ regulon showed the highest transcriptional activity in VEC2 (Figure 2I and Figure S3B). Peroxisome proliferator-activated receptor γ was exclusively expressed in ECs (Figure 2J), which was consistent with the provided scRNA-seq data in CrF.10 We further detected the highest expression of PPARγ in VEC2 among all vascular subpopulations (Figure 2K and Figure S3C), indicating its substantial importance in transcriptional regulation for this subcluster. To dissect the regulatory network of all target genes of PPARγ in VEC2, we conducted enrichment analysis and observed that the PPAR signaling system ranked top among all involved pathways, with the most target genes (LPL, PPARγ, PLIN2, FABP4, CD36, AQP7; Figure 2L). Almost all these targets are associated with lipid metabolism. Therefore, our observations suggest that the PPAR signaling pathway is crucial in regulating the functions of VEC2, especially in adipogenic responses.
Our study first identified a specific VEC cluster (VEC2) with high expression of LPL in CrF, which played a crucial role in lipid accumulation via PPAR signaling transduction. In addition, VEC2 might give rise to adipocytes contributing to CrF formation and have a potential immunologic defense against bacterial translocation, suggesting its protective role in the pathophysiology of MAT. These results shed light on a new mechanism of VECs in CrF formation. Further study is needed to confirm this hypothesis about the protective mechanism of the specific VECs in CrF.
Among the other subclusters of VECs, VEC1 is mainly involved in platelet-activating factor (PAF) and linoleic acid metabolism. Platelet-activating factor regulates vascular permeability, leukocyte adhesion, and phagocyte activation as an inflammation amplifier.30 The metabolites of linoleic acid were verified to adjust the adhesivity of ECs. Although VEC3 and VEC4 shared a similar pattern of biological processes, VEC3 was characterized by FA oxidation, whereas VEC4 was characterized by membrane repolarization.
CrF-derived LECs Upregulated the Gene Expression and Pathways Involved in Lymphangiogenesis and Inflammatory Responses
The DEGs showed that CD74 was the most elevated gene in LECs from CrF (Figure 3A). As reported, CD74 facilitates endothelial proliferation and is associated with high permeability of the tube wall, in line with the lymphatic pathophysiology in CrF.31,32 In addition, CD74 could interact with macrophage migration inhibitory factor (MIF), regulating monocyte-EC adhesion and mediating inflammation and injury. Additionally, FABP5, which encodes a member of the FA-binding protein (FABP) family, was also significantly upregulated in CrF-derived LECs; FABP5 can be expressed in many cell types (including adipocytes, endothelium, and macrophages) and affects cell proliferation and inflammatory responses.33 By binding FAs to activate the intranuclear PPAR pathway, FABP5 participates in lipid metabolism,34 which was also observed in our study (Figure 3B). Peroxisome proliferator-activated receptor signaling could further stimulate VEGFR-3 expression to promote lymphangiogenesis. In addition, IFN-γ-mediated signaling transduction and the JAK-STAT pathway were enhanced in CrF-derived LECs according to GO analysis (Figure 3C).
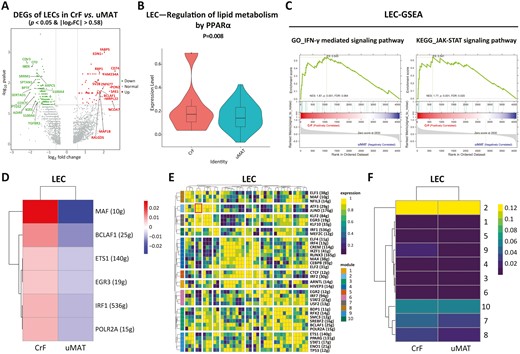
Changes in gene expression and transcriptional activity of LECs. A, Volcano plot indicating the DEGs of LECs (CrF vs uMAT). B, Upregulation of lipid metabolism by PPARα shown by single-cell metabolism in LECs. C, GO (left) and KEGG (right) enrichment analyses for LECs (CrF vs uMAT). SCENIC analysis of VECs shown as an RAS heatmap (D), regulon crosstalk (E), and heatmap of regulon modules of LECs (CrF vs uMAT; F).
Via SCENIC analysis, we identified that the musculoaponeurotic fibrosarcoma (MAF) regulon in CrF had the highest transcriptional intensity (Figure 3D). It intervenes in apoptosis and differentiation of ECs35 and exerts potential effects on lymphatic number and function. By calculating the CSI, we obtained a regulatory network composed of 10 modules and 37 regulons (Figure 3E). Transcription factors of ATF3/JUND heterodimers in module 2 displayed the strongest activity in CrF-LECs (Figure 3F) and were related to chronic inflammation.
Our results revealed that CrF-derived LECs had increased gene expression involved in inflammatory responses and lymphangiogenesis. Targeted therapy of abnormal LECs in CrF may be a promising way to alleviate CD intestinal inflammation.
A Novel Subgroup of GREM1+RFLNB+ Inflammation-associated Fibroblasts Related to Inflammation and Fibrosis Was Detected in CrF
Fibroblasts presented proportional predominance (36.96%) among all obtained cell types in our study and were reclustered to 7 subclusters (FC1-FC7, Figure 4A). Notably, FC3 was a previously unreported subpopulation predominantly accumulating in CrF (Figure 4B and Figure S4) with high expression of GREM1 and RFLNB (Figure 4C). We validated this type of GREM1+RFLNB+ fibroblasts colocalized in COL1A1+ and DCN+ fibroblasts in another 6 paired CrF and uMAT samples from CD patients by IF. The CrF samples had a significantly higher percentage of GREM1+ RFLNB+ cells than the uMAT samples (9.79%±4.54% vs 4.92%±4.82%; P = .0058; Figure 4D, E). Blockade of the widely known profibrogenic factor GREM1 could inhibit TGF-β-mediated matrix production and epithelial to mesenchymal transition (EMT).36 Upon binding with VEGFR-2 on fibroblasts, GREM1 activates the downstream MAPK signature and exacerbates intestinal fibrosis.37 Additionally, as a signaling effector of TGF-β1, RFLNB is required for profibrotic activation of fibroblasts.

Fibroblasts in MAT were divided into 7 subclusters, and a new subpopulation of IAF was identified in CrF. A, UMAP plot showing 7 subclusters of fibroblasts. B, Cluster proportion for each cluster. C, Expression of GREM1 and RFLNB genes in each cluster of fibroblasts. D, Immunofluorescence double staining and (E) the percentage of positive cells for the validation of the GREM1+RFLNB+ fibroblast subcluster (CrF vs uMAT). **P < .01, ***P < .001. GSVA enrichment analyses of GO terms (F) and hallmark pathways (G) for each cluster.
Based on the high expression of 3 gene signatures (CCL2, IL-6, and IRF1; Table S2),38 FC3 cells were thought to be inflammation-associated fibroblasts (IAFs). Gene set variation analysis showed that FC3 mainly participated in inflammatory responses (IgA production and Th17 cell differentiation, Figure 4F) and regulation of Smad protein phosphorylation (Figure 4G). The central role of Th17 immune responses in the pathogenesis of intestinal fibrosis has been illustrated in previous research.39 Smad signal transduction is also involved in the aggravation of inflammation-associated intestinal fibrosis.40 Here, the GREM1 + RFLNB + IAFs were first found predominantly in CrF and displayed potential abilities in pro-inflammatory responses and intestinal fibrosis.
The Pro-inflammatory and Profibrotic Properties of IAFs During Crf Formation by Pseudotime Analysis
The Monocle 2 algorithm was applied to investigate the developmental trajectories of fibroblasts during CrF development based on the unbiased clustering for each tissue (Figure 5A, B). The fibroblasts from 2 patients experienced a similar trajectory path with 3 states (Figure 5C, D). The uMAT-derived fibroblasts mainly occupied the prebranch (State 1), whereas the fibroblasts from CrF were predominantly located at State 2 (Figure 5E, F), suggesting a transition tendency during CrF formation. The fibroblasts at State 3 presented an intermediate phenotype (Figure 5G, H). Of note, the cellular distribution of the GREM1 + RFLNB + IAF subpopulation was highly matched with that of the CrF-derived fibroblasts, confirming their main origin from CrF, meanwhile implicating their substantial importance in CrF development.
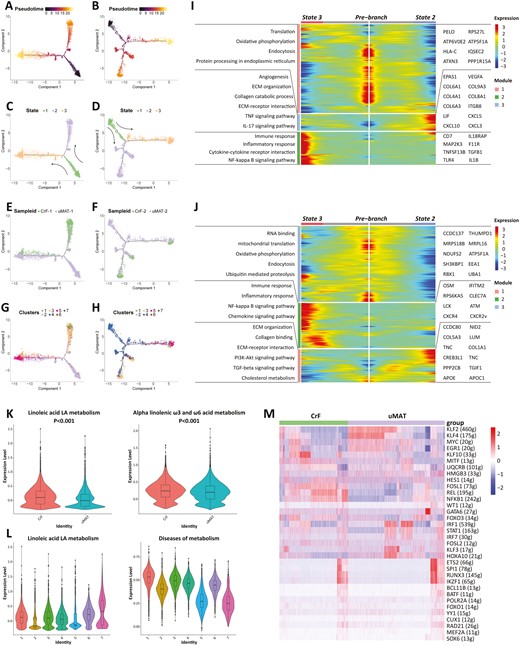
Pseudotime analysis and gene changes exploring the developmental trajectories of fibroblasts in MAT. The developmental pseudotime of fibroblasts with Monocle 2 in patient 1 (A) and patient 2 (B). The color key from dark to bright indicates disease progression from the uninvolved state of CD MAT to CrF formation. State transition of fibroblasts from patients 1 (C) and 2 (D). Cell source transition between CrF and uMAT in patients 1 (E) and 2 (F). Pseudotime trajectory of 7 subpopulations in patients 1(G) and 2 (H). Heatmap displaying the dynamic genes during CrF formation in patients 1 (I) and 2 (J). The differentially regulated REACTOME terms of scmetabolism in patients 1 (K) and 2 (L). M The RAS heatmap displayed changes in transcriptional activity.
Gene dynamics analyses (Figure 5I, J) showed that the remarkably upregulated genes at State 2 focused on collagen synthesis (COL5A3, COL6A1, COL8A1, etc.), extracellular matrix (ECM) regulation, interleukin (IL)-17 and tumor necrosis factor (TNF) signaling pathways. State 3 was characterized by the expression of genes related to immune and inflammatory responses (IL-1B, TLR4) and the NF-κB signaling pathway. These differential gene expression levels were consistent with the pro-inflammatory and profibrotic properties of the GREM1 + RFLNB + IAF subtype. The present data suggest that fibroblasts in MAT differentiate toward the direction of the pathogenic phenotype during CrF formation. In addition, the robust metabolic activity of linoleic acid in CrF-derived fibroblasts, which is relevant to many fibrotic diseases, was also enriched in FC3 (Figure 5K, L).41 Therefore, the FC3 subset, as IAFs mainly from CrF, may play a crucial role in the promotion of inflammation and fibrosis.
To further uncover the potential mechanism involved in the pathogenic behaviors of fibroblasts, we used SCENIC analysis. A 5-regulon signature (HES1, MITF, FOSL1, REL, and NF-κB) displayed enhanced transcriptional activity in CrF-derived fibroblasts (Figure 5M). As the major members of the NF-κB system, REL and NF-κB1 are well studied in pro-inflammatory and profibrotic responses. In contrast, the transcriptional activity of KLF2 was significantly lower in fibroblasts from CrF. In a previous report, KLF2 inhibited fibrosis by negatively regulating IL-1β and IL-6 production.42 Our results provide new insights to intervene in inflammatory and fibrogenic behaviors by regulating transcription in fibroblasts.
Heterogeneity of Macrophage Origins and Functions in the MAT of CD
A total of 9 clusters in the myeloid lineage were detected (Figure 6A) and identified as 3 cell types, including macrophages (C1, C3-C6 and C8; CD68, CD163), conventional dendritic cells (cDCs: C2 for cDC1, CD1C, FCERA1; C7 for cDC2, XCR1, and BATF3) and myeloid progenitor cells (C9; GATA1; Figure 6B).
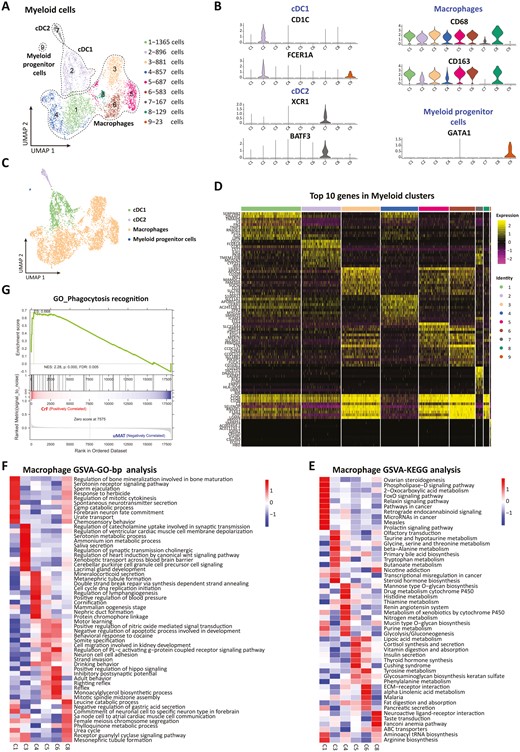
Heterogeneity in origins and functions of subpopulations of macrophages in the MAT of CD. A, UMAP plot showing 9 subclusters of myeloid-derived cells derived from MAT. B, Expression of marker genes for the cell subtypes. C, Cell subtype composition using a UMAP plot. D, Heatmap displaying the top expressed genes in each subpopulation. GSVAs showed the GO enrichment of the hallmark pathways (E) biological processes (F) of the macrophage subpopulations. G, GSEA of GO terms (CrF vs uMAT).
As the most important cell type in innate immunity, macrophages have been widely studied for their role in CrF formation. They can exert protective effects on translocated microbiota and facilitate mesentery expansion in the MAT of CD.10 In this research, we found that macrophages occupied the vast majority of the myeloid cell population in MAT (81.26% in CrF and 80.02% in uMAT, Figure 6C). To reveal the heterogeneity of macrophages, we first dissected their origins and functions (Figure 6D). The gene heatmap showed that C1 was an anti-inflammatory phenotype due to its expression of IL-10. Conversely, C3 highly expressed CCL8-presenting pro-inflammatory properties. Apolipoprotein A1, which facilitates lipopolysaccharide (LPS)-triggered inflammation, was detected in C3 with considerable expression43; C4 was defined as monocyte-derived macrophages for expressing S100A8 and S100A12.44 Due to the overexpression of MERTK and GPR34, both C5 and C6 were thought to be tissue resident macrophages.45 Additionally, C8 was a population of macrophages overexpressing immunomodulation-related genes such as C1Q and SELENOP.
Further GO and KEGG analyses by GSVA (Figure 6E, F) found that C1 was enriched in serotonin receptor signaling transduction. Serotonin modulates the phenotype and functional polarization of macrophages, maintaining their anti-inflammatory state.46 Interestingly, C3 is involved in the serotonin metabolic process, in line with its pro-inflammatory phenotype; C4 predominantly exerted influences on vascular and lymphatic functions. With identical origins, both the C5 and C6 subpopulations also shared similar profiles of biological processes and hallmark pathways in the regulation of nitric oxide-mediated signal transduction, apoptotic regulation, hippo signaling, lipoic acid metabolism, and fat formation. The receptor guanylyl cyclase signaling pathway regulating mesenteric inflammation was highly expressed in C8. In addition, GSEA displayed a significant enhancement of the phagocytosis of macrophages in the CrF (Figure 6G), consistent with its ability to defend against bacterial translocation.10
Taken together, the results of our study unprecedentedly deciphered the diversity in the phenotype and function of macrophage subsets in the MAT of CD. Compared with the results of previous research,10 our data provide more precise and valuable information for further explorations focused on macrophages in CrF.
T and NK cells were the most abundant immune cell type in our study; however, their proportion exhibited no significant difference between CrF and uMAT, which is in line with previous data.10 According to canonical lineage markers, we further divided these cells into 4 major subtypes, including CD4+ T cells (CD3D, CD4), CD8+ T cells (CD3D, CD8), γδ T cells (CD3D, TRDC), and NK cells (CD3D, KLRB1); and there was still no disparity in the percentages between the 2 groups (Figure S5).
Intercellular Communications in the MAT of CD
Using CellPhoneDB2 and mapping the expression of paired genes encoding ligands and receptors (Figure 7A and Figure S6), we revealed that fibroblasts became the core cells with the most extensive interactions with other cell types (Figure 7B, C), especially with ECs (including VECs and LECs; Figure 7D). Fibroblasts and LECs displayed the most intense interaction in the CrF (Figure 7D), and the strongest communication was found with VECs in uMAT (Figure 7E).
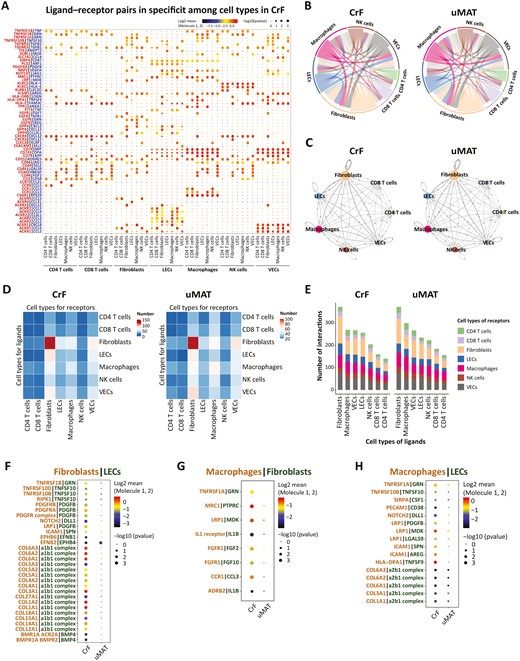
Cell-cell communication network between CrF and uMAT. A, Bubble plots show ligand-receptor pairs of cytokines in CrF and uMAT samples. P values are indicated by dot size. The dot color denotes the mean of the average ligand-receptor expression in the interacting lineages. B, Interactions between different cell types in CrF and uMAT. C, Cell-cell communication networks in CrF and uMAT. The node size reflects the total number of communications for each lineage. The edge color indicates that the ligands are broadcast by the cell lineage in the same color. The line thickness is proportional to the number of broadcast ligands. The potential ligand-receptor pairs predicted by CellphoneDB2 shown by a heatmap (D) and the numbers of pairs (E) between cell groups in CrF and uMAT were identified. F, Interaction changes between VECs (ligand) and fibroblasts (receptor; CrF vs uMAT). G, Interaction changes between fibroblasts (ligand) and macrophages (receptor; CrF vs uMAT). H, Interaction changes between LECs (ligand) and macrophages (receptor) in CrF and uMAT.
In CrF, LECs highly expressed integrin α1β1, which is tightly linked with the collagen produced by fibroblasts. Integrin α1β1 mediation of a collagen-dependent proliferation pathway regulates cell proliferation in collagenous matrices both in vivo and in vitro.42 Platelet-derived growth factor β (PDGF-β) was strongly expressed in the LECs of CrF and bound to PDGFR-α synthesized by fibroblasts (Figure 7F). Binding to various subsets of integrins, collagen can induce fibrosis and PDGFR-α-mediated signal transduction relevant to tissue repair and regeneration.47 The interactions between LECs and fibroblasts in CrF are probably a potent factor to accelerate intestinal fibrosis.
Macrophages, as important immune cells, exhibited the most interactions with other cell types in MAT (Figure 7E). In CrF, IL-1β was highly expressed in fibroblasts in combination with the classic receptor IL-1βR on macrophages, which could convert M2 macrophages to the M1-inflammatory phenotype and exacerbate disease development (Figure 7G). In addition, CrF-derived fibroblasts expressing CCL3 interacted with the receptor CCR1 on macrophages. The CCL3-CCR1 signaling pathway facilitates macrophage infiltration and M1 polarization. Notably, both fibroblasts and LECs in CrF produced MDK binding to the receptor LRP1 on macrophages (Figure 7G, H). The MDK-LRP1 axis plays a crucial role in promoting the differentiation of immunosuppressive macrophages,48 namely, the M2 phenotype, which promotes CrF formation and fibrosis. This study uncovered the diversity of cell-cell communications of MAT in CD and highlighted the crucial roles of fibroblasts, ECs, and macrophages in the complicated network. Disease development ultimately depends on the direction of intercellular communication between the balance of pro- and anti-inflammation or fibrosis.
Discussion
Growing evidence has focused on the pathophysiology and pathogenic role of CrF in CD. Nevertheless, compared with the large number of studies on mucosal immunity and intestinal flora, investigations on the mechanism of MAT involved in CD pathogenesis and the specific changes in various cellular components are still limited. ScRNA-seq, as a new technology, has opened up possibilities and opportunities for further explorations. ScRNA-seq can not only delineate the functional differences among distinct cell types but also identify novel cell subpopulations, providing great advantages in deeply understanding the mechanisms involved in disease development. At present, the only research10 on the CrF of CD by scRNA-seq illustrated the translocation of intestinal Clostridium into the mesentery and activated immune responses of macrophages. This study indicated the protective properties of CrF. However, the functional diversity of and dynamic changes in the cellular components in CrF still lack elaboration.
In the present study, we generated a comprehensive single-cell transcriptome atlas of MAT in CD with an inflamed and stenotic ileum and identified 10 cell types. Our data not only demonstrated the high heterogeneity of cell components in MAT but also uncovered changes in genes and signaling pathways during disease progression. In addition, we deeply analyzed several important but easily neglected cell types, including VECs, LECs, and fibroblasts. We first identified the specific VEC2 and IAF subclusters in CrF. These novel cell subpopulations exhibited abnormal gene expression and functions during CrF formation.
Based on the characteristics of the “comb sign” by computed tomography or magnetic resonance scanning in patients with CD, the functions of VECs and blood vessels have been highlighted for a long time. However, their roles and mechanisms in CrF formation remain elusive. According to the recently limited findings by scRNA-seq,10 VECs have adipogenic properties and play a role in tissue remodeling in CrF. Through in-depth analyses, we identified a specific VEC cluster (VEC2) for the first time and revealed its potential function. Except for quantitative advantages in CrF, VEC2 presented robust PPARγ transcription, as well as an activated PPAR signaling pathway and adipogenic and antibacterial phenotype, represented by triglyceride catabolism and response to bacterial lipoprotein. Increased PPARγ activation in CrF has been previously reported.22 Interestingly, VECs express PPARγ ligand and regulate lipid uptake in AT, contributing to fat accumulation.49 Meanwhile, VECs enhance phagocytosis and defensive behaviors in a PPARγ-dependent manner after bacterial exposure.25 Recently in CD patients, white AT browning, characterized by accelerated lipid metabolism, has been underscored and indicates protective properties.50 A PPARγ agonist accelerates white MAT differentiation toward brown AT.51 In response to PPARγ activation, VECs in AT give rise to adipocytes and cause adipose expansion. Thus, VEC2 may also participate in the white-brown conversion of MAT in CD. These results indicate that the VEC2 subset and PPAR signaling pathway may play crucial roles in CrF formation and disease progression.
Increasing evidence has demonstrated that lymphatic vessels exert important functions in alleviating inflammation by draining excessive fluid, inflammatory cells and mediators. Lymphatic endothelial incompleteness, structural disorders of lymphatic vessel valves, and the formation of tertiary lymphoid tissues are jointly involved in the pathogenesis of CrF.52,53 Lymphatic leakage promotes lipid accumulation, especially in areas rich in lymphatic tissue, such as the mesentery. Scholars have previously stated that hyperplastic MAT in CD is caused by mesenteric lymphatic insufficiency.22 Consistent with that, we obtained a relatively small number of LECs from CrF and found highly upregulated expression of CD74 and FABP5. Notably, CD74 is closely correlated with high lymphatic permeability, which is a widely recognized pathophysiological phenomenon in CrF. Via EC-monocyte interactions, CD74 also regulates EC proliferation and barrier integrity and mediates inflammatory responses.32 These data implicated its compensatory action in the regulation of lymphatic functions. By mediating FA metabolism, FABP5 participates in immune responses and affects proliferative behaviors of various cells.33,34 In addition, increased activity of the IFN and JAK-STAT signaling pathways was observed in CrF-derived LECs. As an important inflammatory mediator in antibacterial responses, IFN stimulates ECs and enhances the pro-inflammatory phenotype through hyperactivation of the JAK-STAT pathway.54 We infer that these changes may be helpful in addressing the translocation of intestinal microbiota in CrF. Our results not only suggest that dysfunctional LECs with decreased numbers may contribute to MAT inflammation and hyperplasia but also provide potential targets for the treatment of mesenteric lymphatic vessels in CD.
Intestinal fibrosis is a common and serious complication of CD. Both immune and nonimmune components take part in its pathogenesis.55 The fibrosis in MAT from patients with ileal CD was significantly higher than that from patients with colonic CD or ulcerative colitis.48 However, the mechanisms of profibrosis in CrF have been less studied. In the ileal inflammatory tissue of CD, a specific type of fibroblast was identified to promote the recruitment of monocytes in the blood to the inflammatory ileum and further differentiated into pathogenic inflammatory macrophages.56 Notably in the present study, a novel cluster of IAFs was detected predominantly in CrF by scRNA-seq based on considerable expression of inflammatory signatures (CCL2, IL-6, and IRF1). By binding CCR2, CCL2 is responsible for the recruitment of inflammatory monocytes, which are known as the counterpart of M1 in circulation. Furthermore, this IAF subset exhibited fibrogenic properties by specifically high expression of profibrotic genes (GREM1, RFLNB) and Smad phosphorylation. Pseudotime analysis indicated that fibroblasts have dynamic plasticity and differentiate toward inflammatory and fibrotic phenotypes during CrF formation. Consistently, REL and NFκB1, 2 classic members of the NF-κB signaling pathway, exhibited elevated transcriptional activity in fibroblasts from CrF. The role of NF-κB signaling transduction in exacerbating the pro-inflammatory and profibrotic effects of fibroblasts has been well clarified.57 In addition, the interaction of increased expression of integrin α1β1 from LECs and collagen from fibroblasts in CrF was observed in CrF, also confirming their pathogenic behaviors. Given the intimate relationship between CrF and its wrapped inflamed intestinal segment, our noteworthy findings may help shed light on the mechanism of fibrosis in MAT and intestine.
Macrophages are the most dominant intrinsic immune cells infiltrating the CrF. A recent study demonstrated that IL-10-secreting M2 macrophages predominate in CrF and exhibit a preference for M2b macrophages for a protective effect on confining translocated microbiota from the gut.9 In our work, we detected 6 subpopulations of macrophages in the MAT of CD for the first time and identified their distinct origins and phenotypes clearly. The various functions of these clusters included inflammation regulation, lipid metabolism, and ECM production, which supported the results of previous research.10 The data provide updated information for unveiling the role of macrophages in CrF.
To the best of our knowledge, this is the first study that provides a comprehensive single-cell transcriptomic atlas of MAT in CD and elaborates the functional diversity and dynamic changes in cellular components during CrF formation. In our study, all samples from the 2 groups displayed excellent repeatability. Furthermore, by comparison with the only scRNA-seq data from recent research by Ha et al,10 the representative gene expression in EC and macrophage clusters was also confirmed. This evidence strongly reflects the reliability of our research. Our data not only complement the limitations of previously similar scRNA-seq literature but also provide valuable information for a global understanding of the pathogenesis of CrF.
There are some limitations in our study. First, all the cell types and cell subpopulations with different phenotypes and functions could not be fully delineated within a single report, so we described only some crucial findings. Second, although 3 paired samples do not seem to be many, the results from these patients presented excellent repeatability and representativeness. As a relatively expensive technique, we think that the number of samples should be enough to carry out the research, rather than the more the better. Third, the unaffected MAT of CD patients cannot be strictly considered a healthy control sample. Thus, the analysis will be more comprehensive and valuable if the cells derived from non-IBD mesenteric fat tissue are also included. Nonetheless, our study unveiled the heterogeneity and dynamic changes in the cellular components within the lipid-rich and inflammatory microenvironment in CD MAT during disease development, which may provide useful information for exploring the mechanism and function of CrF formation, in addition to novel treatments for CD in the future. Fourth, more investigations are needed to validate our results, including in vitro and in vivo work on the roles of these key cells in CrF.
In summary, we first described comprehensive single-cell transcriptome expression profiles of MAT in CD and illustrated the cellular heterogeneity between CrF and uMAT. Some new cell subclusters or functions of VECs, fibroblasts, and myeloid cells were detected. This information provides new insight for delineating dynamic changes during CrF formation and directions for further investigation.
Supplementary Data
Supplementary data is available at Inflammatory Bowel Diseases online.
Figure S1. UMAP plot showing twenty clusters in 6 samples.
Figure S2. UMAP plot showing the composition of 10 cell types in 6 samples (a). Proportion of 10 cell types in 6 samples (B).
Figure S3. GSEA in VEC2 (CrF vs uMAT). (A) SCENIC analysis shown as an RAS heatmap in 4 VEC clusters. B, Violin plot showing PPARγ expression in 4 VEC clusters. (C)
Figure S4. UMAP plot showing fibroblasts from CrF and uMAT. (A) Proportion of 7 fibroblasts in 6 samples (B).
Figure S5. UMAP plot showing the T&NK-cell subtype composition. (A) Proportion of T&NK-cell subsets in CrF and uMAT. (B) UMAP plot showing the composition of T&NK-cell subtypes in 6 samples. (C)
Figure S6. Overview of ligand‒receptor interactions in uMAT.
Table S1. Clinical characteristics of each patient in this single-cell sequencing study.
Table S2. Gene expression in each individual fibroblast cluster.
Acknowledgments
Authors thank OE Biotech Co., Ltd. (Shanghai, China) for providing the 10x Genomics single-cell RNA sequencing technology and assisting with bioinformation analysis.
Author Contributions
X.W. and P.D. designed the study and critically revised the whole manuscript. W.S. and Y.W. were involved in the acquisition, analysis and interpretation of data, as well as the drafting of the manuscript and the drawing of all the figures. C.L., L.Z., P.Y., and D.Z. were involved in the acquisition and analysis of data for the work. Y.B.and G.Y. helped to analyze the data and gave suggestions on the manuscript drafting and figure arrangement. C.C. collected the qualified surgical samples, analyzed the clinical data, and gave constructive suggestions for revision. All authors agree with the final approval of the version to be published.
Funding
This work was partly supported by National Natural Science Foundation of China (Grant 81670476 and 81970449).
Conflicts of Interest
The authors declare no conflicts of interest.
Data Availability Statement
The data sets presented in this study can be found in online repositories. The name of the repository and accession number can be found below: http://ngdc.cncb.ac.cn/, HRA003230.
References
Author notes
The first two authors contributed equally to this work

