


Abstract
The actomyosin cytoskeleton enables cells to resist deformation, crawl, change their shape and sense their surroundings. Despite decades of study, how its molecular constituents can assemble together to form a network with the observed mechanics of cells remains poorly understood. Recently, it has been shown that the actomyosin cortex of quiescent cells can undergo frequent, abrupt reconfigurations and displacements, called cytoquakes. Notably, such fluctuations are not predicted by current physical models of actomyosin networks, and their prevalence across cell types and mechanical environments has not previously been studied. Using micropost array detectors, we have performed high-resolution measurements of the dynamic mechanical fluctuations of cells’ actomyosin cortex and stress fiber networks. This reveals cortical dynamics dominated by cytoquakes—intermittent events with a fat-tailed distribution of displacements, sometimes spanning microposts separated by 4 μm, in all cell types studied. These included 3T3 fibroblasts, where cytoquakes persisted over substrate stiffnesses spanning the tissue-relevant range of 4.3 kPa–17 kPa, and primary neonatal rat cardiac fibroblasts and myofibroblasts, human embryonic kidney cells and human bone osteosarcoma epithelial (U2OS) cells, where cytoquakes were observed on substrates in the same stiffness range. Overall, these findings suggest that the cortex self-organizes into a marginally stable mechanical state whose physics may contribute to cell mechanical properties, active behavior and mechanosensing.
The cytoskeleton is an essential component of cells, and is critical to many aspects of cellular mechanical function, including interactions with their physical environment. However, existing physical models fail to predict many cell mechanical phenomena, including the recently observed earthquake-like fluctuations called cytoquakes. This work describes measurements of the dynamic forces and displacements of the cortex, with high resolution and statistical power, for a range of cell types and substrate stiffnesses using arrays of flexible microposts. We find pervasive cytoquakes resembling earlier studies, suggesting that they are a general feature of the cytoskeleton and emphasizing the need for new physical models to capture the range of cellular behavior.
INTRODUCTION
The actomyosin cortex and associated machinery of living cells is a dramatic example of a self-assembled active material, and is an essential component of nearly all animal cells, defining their shape and driving contraction and cell motility [1]. There has been a sequence of biophysical models that have been developed that have sought to explain the complex mechanical behavior of the cytoskeleton, beginning with models that sought to exploit analogies with physical systems, such as sol–gel transitions [2, 3], tensegrity architectures [4, 5] and soft glassy rheology associated with emulsions and foams [6–10]. Perhaps the most successful is the active gel model [11–16], which seeks to build a cytoskeletal model that combines the physics of polymer networks with a picture of a distributed set of molecular motors that act incoherently on the network. Recent experiments on cells employing adherent microbeads [17] and active micropost array detectors [18] have shown that the cortex is subject to large, intermittent step-like motions whose fat-tailed amplitude distributions and temporal correlations resemble those seen in avalanches and earthquakes in physical systems. On the basis of these analogies, these cortical dynamics have been termed ‘cytoquakes’ [17], and notably are not naturally predicted by existing active gel models. Recent simulation studies have also found evidence for such phenomena, as manifested in heavy tailed distributions of releases of mechanical energy and sudden motion in models of actomyosin networks [19–21]. These results imply that portions of the cytoskeleton, and in particular the actomyosin cortex, may self-organize into a marginally stable state; one poised on the edge of a structural rearrangement. The physics of this state may then also govern a range of phenomena at subcellular and cellular scales, from superdiffusive motion of intracellular organelles and other tracers [13, 16, 22–26] to the power law rheology that governs cellular passive mechanics [8, 10, 22, 27, 28]. This possibility also promises to explain the long-noted similarity between cellular mechanics and that of soft glasses [6–10], which also self-organize into marginal mechanical states and display superdiffusion, power-law rheology and avalanches [29].
Experiments to date have been limited to human airway smooth muscle cells [17] and 3T3 fibroblasts [18], and thus it is important to establish whether such phenomena occur more broadly. In this paper we exploit our high-resolution micromechanical measurement techniques using micropost arrays [18] to study cortical fluctuation dynamics in a set of cell types that span a range of cytoskeletal phenotypes and mechanical activity [30–32], including examples of primary cell lines—neonatal rat cardiac fibroblasts (CFs) and cardiac myofibroblasts (CMFs)—as well as human embryonic kidney (HEK) cells and human bone osteosarcoma epithelial (U2OS) cells. Further, as cytoskeletal dynamics play a key role in the cellular response to external mechanical cues, for example in the rigidity sensing (‘durosensing’) of extracellular matrix (ECM) or substrate stiffness [33–37] that guides mechanical phenotype, stem cell differentiation [38], tissue morphogenesis [39], and cancer metastasis [40–42], the influence of the cell’s mechanical environment on cytoquake phenomena is also an important issue. To that end we have also studied the effects of substrate stiffness using 3T3 fibroblasts. Remarkably, all cell lines and conditions we have studied display the key phenomena associated with cytoquake processes, including step-like displacements that have a fat-tailed distribution of amplitudes, and superdiffusive mean squared displacements, despite the cells’ expected variation in actomyosin organization. Further, the micropost arrays enable coincidence detection techniques that allow us to identify examples of these avalanche-type events which span at least 4 μm in extent across all the cell types and conditions studied, suggesting that the cytoquake phenomenon may be very general, and that existing physical models of the cytoskeleton will need to be modified.
MATERIALS AND METHODS
Fabrication of mPADs
Micropost array devices (mPADs) were fabricated in poly(dimethylsiloxane) (PDMS) (Sylgard) as described previously [18], using replica molding from silicon masters [43]. Individual microposts had diameters d = 1.8 μm and were arranged on hexagonal lattices with center-to-center spacing of 4 μm. The PDMS was cast at a 10:1 ratio of base to curing agent. To control the substrate stiffness, the posts’ heights were varied in the range 9.1 –5.7 μm, which yielded effective spring constants k for small horizontal deflections of 5.5–22.3 nN/μm [43], corresponding to equivalent substrate stiffnesses in the range of 4.3–17 kPa [44]. These stiffnesses fall in the relevant physiologic range for living tissues, and correspond closely to that of muscle, including cardiac muscle [45], and cells are known to adopt morphologies on such micropost arrays similar to that seen on soft gels of corresponding stiffnesses [45]. The tops of the microposts were functionalized with fibronectin (Sigma–Aldrich) via microcontact printing to promote cellular adhesion, and the sides of the posts and all remaining surfaces of the arrays were coated with 0.2% w/v Pluronic F-127 (ThermoFischer Scientific) to restrict adhesion to the post tops [46].
Cell culture
NIH 3T3 fibroblasts (ATCC) were cultured in high glucose Dulbecco’s modified Eagle medium (DMEM) (Corning Cellgro) with 10% bovine serum (ThermoFisher Scientific), 100 units/ml penicillin, and 100 mg/ml streptomycin (Life Technologies). HEK cells (ATCC) were cultured with Eagle’s minimum essential medium (Quality Biological) with 10% fetal bovine serum and 1% penicillin. Human bone osteosarcoma epithelial cells (U2OS), (courtesy of Trina Schroer, JHU) were cultured with high glucose DMEM (Corning Cellgro) with 10% fetal bovine serum (FBS) and 1% penicillin. All cell types were cultured at 37 ̊C and 5% CO2. Primary CFs were extracted from the hearts of neonatal (2 day old) Sprague–Dawley rats (Harlan, Indianapolis, IN, USA). All animal procedures were performed in compliance with guidelines set by the Johns Hopkins Committee on Animal Care and Use and all federal and state laws and regulations. The extraction procedures followed a previously described method for isolation of neonatal cardiac cells [47] up to the point where the cells were ‘pre-plated’ to separate CFs from cardiomyocytes. The cells used in our experiments were then produced by culturing the preplate for 12 days in Medium 199 (Gibco) with 10% FBS, 1% penicillin and 4 μg/ml vitamin B12, and passaging twice (on Days 4–5 and 11–12). For CFs, the TGF-β receptor I kinase inhibitor SD-208 (Sigma) was added at 3 μM one day after each passage to block TGF-β1 signaling and maintain the CFs in a fibroblastic state. To differentiate CFs into CMFs, SD-208 was not added after the second passage, and the cells were treated with 5 ng/ml TGF-β1 (R + D Systems) for 48 h beginning 1 day after passaging.
For experiments, cells were suspended via trypsin/EDTA and seeded onto mPAD devices in 35 mm culture dishes at a concentration of 104 cells/ml. The cells were incubated overnight on the mPADs in their respective culture conditions (but without SD-208 or TGF-β1 for the CFs and CMFs, respectively) to allow them to adhere and spread on the microposts prior to experiments.
Data acquisition and imaging
Measurements of the microposts’ motion were performed on a Nikon TE-2000E inverted microscope, using a 40×, NA = 0.6, extra-long working distance air objective (Nikon Plan Fluor), using methods described in detail in [18]. Bright field movies, 30 min in duration, were recorded at either 10 frames per seconds (fps) or 100 fps (HEK and U2OS cells only) with a Prosilica GX-1050 CCD camera (Allied Vision Technologies) using the StreamPix software suite (Norpix). For imaging and quantification of smooth muscle actin (α-SMA) in CFs and CMFs, cell cultures were stained for α-SMA (DAKO) and DAPI before confocal imaging (LSM 710NLO-Meta, Zeiss) and plate fluorescence reader measurements (Spectramax M2, Molecular Devices).
Micropost position tracking
The microposts’ trajectories were determined using an implementation of a centroid-based particle tracking algorithm [48] written in Igor Pro (Wavemetrics) [18]. To account for frame-to-frame drift, the average displacement in each frame relative to the initial frame of all microposts not in contact with cells (background posts) was subtracted from all individual micropost trajectories. The undeflected positions of posts in contact with cells were determined by interpolation based on the positions of the background posts in the corresponding rows and columns of the mPAD array. This technique allows us to resolve the motion of the microposts to better than 2 nm.
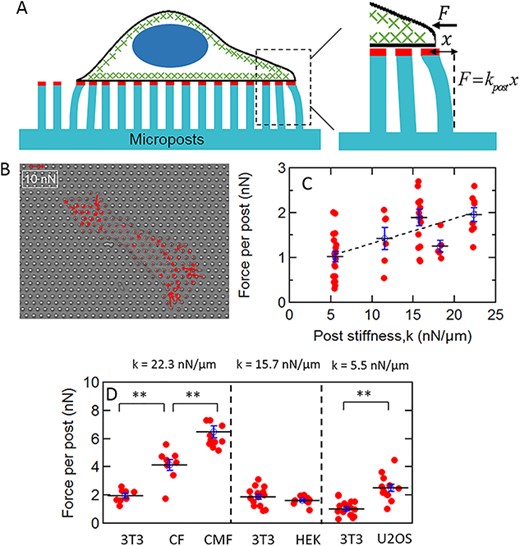
(A) Schematic of a cell on a micropost array. The tips of the microposts are coated with fibronectin (red) to enable coupling to the actomyosin cytoskeleton (green) via integrin linkages. Cellular traction forces bend the posts. The posts’ deflections are converted to force via the posts’ effective spring constant k for small deflections. (B) traction force map of a CMF cell. The red arrows indicate cellular traction force vectors. (C) Dependence of traction force per post on substrate stiffness. Each datapoint is the average traction force per post |$\big\langle \big|\vec{F}\big|\big\rangle =\frac{1}{N}\sum_ik\big|\Delta{\vec{r}}_i\big|$| for an individual cell. The variations of |$\big\langle \big|\vec{F}\big|\big\rangle$| between different values of k were significant via a one-way ANOVA test over the full dataset (P < 0.001). The dashed line shows a parametrization of the increase of |$\big\langle \big|\vec{F}\big|\big\rangle$| with k by linear regression in the range 5.5 nN/μm ≤ k ≤ 22.3 nN/μm as |$\big\langle \big|\vec{F}\big|\big\rangle = mk+b$| with m = 0.055 ± 0.013 μm and b = 0.76 ± 0.18 nN (r = 0.9). (D) Dependence of traction force per post on cell type. Each cell type is compared with 3T3 fibroblasts on the corresponding substrate stiffness; significance via unpaired t test: **P < 0.001. Error bars in C and D are standard error of the mean.
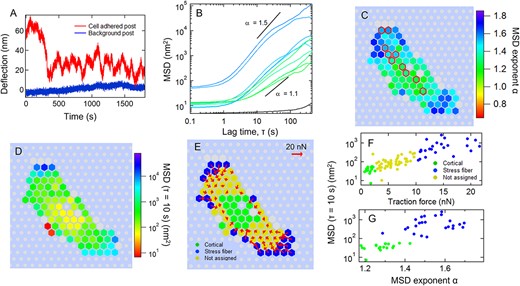
Micropost deflection fluctuations for a cardiac myofibroblast. (A) Deflection trace of one Cartesian component of the motion of a cardiac myofibroblast-associated micropost (red) and a background micropost (blue) over 30 min. (B) MSDs vs lag time τ calculated based on traces such as those in (A) for the posts indicated by red circles in C. The traces’ color indicates the MSD power-law exponent α over the range 5 s ≤ τ ≤ 10 s as given by the scale in panel C. The black trace is calculated for the background post shown in A. (C and D) Heat maps of (C) distribution of power-law exponent α over 5 s ≤ τ ≤ 10 s, and (D) MSD magnitude at τ = 10 s. Gray hexagons indicate posts not engaged with the cell for the full measurement interval. Gray circles indicate background posts. Red outlines indicate posts with MSD traces shown in B. (E) Distribution of cortical and stress fiber posts across the cell, as determined by the classification procedure based on average traction force magnitude described in the text, and the associated traction force vectors (red arrows). (F) Scatter plot of MSD magnitude at τ = 10 s vs average traction force. (G) MSD magnitude at τ = 10 s vs MSD exponent α for cortical and stress fiber posts.
Analysis of micropost dynamics
For force measurements, the microposts’ lateral deflections |$\Delta \vec{r}$| were converted to force |$\vec{F}=k\Delta \vec{r}$| via their spring constants k. To facilitate comparison across datasets, the deflections recorded at 100 fps (HEK and U2OS cells) were averaged to 10 fps, and all subsequent analysis was carried out on 10 fps datasets. The posts’ mean squared displacements (MSDs) < Δr2(τ) > = < (r(t + τ) − r(t))2 > were computed up to lag times τ = 360 s (1/5 of the measurement duration). As the MSDs showed power-law behavior <Δr2(τ) > ∝ τα for one to two decades in τ, the MSD exponents α for each post were obtained by fitting and subtracting the short-τ noise floor and averaging the slope of the logarithmic time derivative of the resulting ‘subtracted MSD’ between 5 s ≤ τ ≤ 10 s [18]. The condition α < 0.5 was used to identify ‘background’ posts not engaged with the cell, which we have shown to be a robust criterion [18]. To identify posts that were not engaged with the cell for the full 1800 s measurement interval (e.g. due to cell motility), we analyzed the MSDs separately for the first and last third of each video. Posts with MSD exponents < 0.5 for either of those intervals were eliminated from further consideration.
Posts associated with different cytoskeletal components were identified based on the traction force for each post. Cortex-associated posts were identified as those with maximum traction force less than an upper bound Fc,max = 2 nN. Stress fiber-associated posts were identified as those with average traction force over the full 1800 s measurement interval Favg greater than a cutoff Fsf,min The values for Fsf,min were 5 nN for HEK, U2OS and 3T3 cells (all conditions) and 10 nN for CF and CMF cells.
RESULTS
Traction force variation across cell types and stiffnesses
To characterize the cell types under study we first measured the average traction forces they generated on the mPAD substrates, shown schematically in Fig. 1A. This force is |$\vec{F}=k\Delta \vec{r}$|, where |$\Delta \vec{r}$| is the deflection of a micropost from its resting position [43, 46, 49]. An example of the traction force map for a CMF cell on a substrate with micropost stiffness k = 22.3 nN/μm is shown in Fig. 1B. The force generated by each cell may be quantified by averaging the magnitude of the traction force it generates over all the posts it is adhered to, |$\big\langle \big|\vec{F}\big|\big\rangle =\frac{1}{N}\sum_ik\big|\Delta{\vec{r}}_i\big|$|. This average force per post is shown in Fig. 1C for 3T3 cells over the range of micropost stiffnesses used. The variation of |$\big\langle \big|\vec{F}\big|\big\rangle$| between different values of k was significant via a one-way ANOVA test with P < 0.001 over the full dataset in Fig. 1C, and |$\big\langle \big|\vec{F}\big|\big\rangle$| increased with increasing k (dashed line in Fig. 1C; r = 0.9 by linear regression), consistent with previous results on these substrates [37, 43]. (We note that throughout this work, the results shown for 3T3 cells on substrates with post stiffness k = 15.7 nN/μm include data published previously [18] in order to facilitate comparison of results across different substrate stiffnesses.)
Since we found only a factor of two variation in average traction forces for 3T3 cells over the available range of substrate stiffnesses, we chose substrates for the other cell types based on experimental considerations, specifically to ensure that posts with the largest deflections, typically those under cell edges, had small enough displacements to both allow accurate determination of their deflections with our particle tracking algorithms and to allow determination of the traction forces applied to them from linear beam bending theory. We first studied primary neonatal rat CFs and CMFs. The CMFs were prepared by treatment with TGF- β1, and the CFs were maintained in their fibroblastic state by treatment with the TGF-β receptor I kinase inhibitor SD-208. To verify that cells treated with SD-208 were behaving as undifferentiated CFs, and those treated with TGF-β1 as differentiated CMFs, we stained both groups for smooth muscle actin (α-SMA). Fluorescence microscopy showed high expression of α-SMA in the TGF-β-treated cells, and very little expression in the SD-208-treated cells (Fig. S1A). These observations were verified quantitatively via fluorescence plate reader measurements from ensembles of cells (Fig. S1B), which showed a more than 4-fold enhancement of α-SMA expression in the TGF-β-treated over the SD-208-treated cells (P < 10−6 N = 6). Both cell types were cultured on substrates with micropost stiffness of k = 22.3 nN/μm. The CMFs had both larger spread areas compared to the CFs (Fig. S2) and larger traction force per post (P < 0.05, NCF = 8 and NCMF = 10) than for CFs (Fig. 1D), as expected for the myofibroblast phenotype, and consistent with previous results [50]. Both the CF and CMF phenotypes showed significantly larger traction forces compared to a reference set of 3T3 fibroblasts (P < 0.05, NCF = 8, NCMF = 10 and N3T3 = 8) on the same substrates (Fig. 1D).
We also assessed two representative nonfibroblast cell types, HEK and human bone osteosarcoma (U2OS) epithelial cells. Compared with 3T3 fibroblasts on substrates of corresponding stiffness (k = 15.7 nN/μm for HEK and k = 5.5 nN/μm for U2O; Fig. 1D), the HEK cells showed similar average traction forces whereas the traction forces for U2OS cells were higher (P < 0.05, NU2OS = 11 and N3T3 = 19).

(A) Dependence of average fluctuation magnitude L10 on substrate stiffness for 3T3 cells. There is no significant difference in L10 between k values via one-way ANOVA (P = 0.99). The horizontal dashed line shows the average value |${\overline{L}}_{10}=6.9\pm 0.2$| nm (S.E., N = 59). (B) Converted fluctuational force kL10 vs substrate stiffness for 3T3 cells. The black dashed line is an eye-guide with slope |${\overline{L}}_{10}$|as determined from the data in A. (C) Dependence of fluctuational force on cell type with 3T3 fibroblasts on the same substrate stiffness shown for reference (**: P < 0.01, *: P < 0.05). Each datapoint corresponds to a cell. Error bars are standard error of the mean.
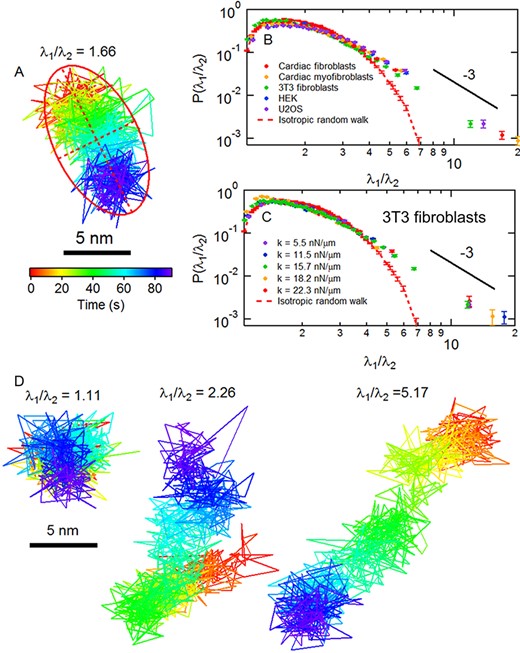
Anisotropy of cortical fluctuations. (A) A displacement trajectory for a micropost adherent to a CMF cell over a 90-second interval. The red ellipse with semimajor axis λ1 and semiminor axis λ2 shows the calculation of the anisotropy index λ1/ λ2 using principal component analysis. (B) Probability distributions of the anisotropy index for (B) different cell types and (C) for 3T3s on substrates of different stiffness show apparent high-anisotropy power-law tails as compared to that computed for an isotropic random walk (dashed red lines). (D) Examples of posts adherent to a CMF cell with different values of λ1/ λ2. Error bars were estimated as |$1/\sqrt{N}$| for each bin in the probability distributions.
Force fluctuations across cell types and stiffnesses
To assess cytoskeletal dynamics, we recorded brightfield movies of individual cells for 30 min and measured each micropost’s position vs time r(t) with a centroid tracking algorithm [18, 48] having spatial resolution of <2 nm. Figure 2A shows the time-dependence of the dynamic fluctuations for a micropost adhered to a CMF cell. The motion of such cell-adhered posts was significantly larger for all cell types studied than the noise seen on ‘background’ posts that were not engaged with cells. We characterized the fluctuating motion of the cell-associated posts through their mean square displacements (MSDs) < Δr2(τ) > = < (r(t + τ) − r(t))2>, where τ is the lag time. Figure 2B shows sample MSD curves for representative posts whose positions under a CMF cell are shown in Fig. 2C. The MSD traces rise above the short-time noise floor and show power-law behavior <Δr2(τ) > ∝ τα for one to two decades in τ. We parameterized the MSD curves via their MSD exponent α in the range 5 s ≤ τ ≤ 10 s and their MSD amplitude at τ = 10 s, using procedures described previously [18]. Figure 2C and D show the distribution of these two parameters for all the microposts under this cell. The microposts generally showed superdiffusive behavior with α > 1. The microposts underneath the cell periphery tended to show higher MSD magnitudes and MSD exponents compared to posts elsewhere, consistent with our previous findings on 3T3 fibroblasts [18]. Following our previously established methods [18], we used individual posts’ average traction force to identify posts that are associated with the cortex (low traction) and with stress fibers (high traction). By discarding posts with intermediate values of the traction force, we ensured that the two populations of posts are biophysically distinct. We note that this identification procedure was validated previously in Ref. [18] for 3T3 fibroblasts by both immunofluorescence imaging that demonstrated localization of stress fibers at the cell periphery where the high traction force posts are found, and biochemical interventions (blebbistatin, Y27632 and ATP depletion) that are known to selectively ablate stress fibers [27, 51] and which abrogated high traction force posts from treated cells. For CMF cells, such as that shown here, we identified posts with maximum traction force <2 nN as ‘cortex-associated’ and those with average traction force Favg > 10 nN as ‘stress fiber-associated’. The locations of the two subpopulations of posts for this sample cell are shown in Fig. 2E, together with the corresponding average traction force vectors. The correlations of the parameters describing the MSD fluctuations with the discriminator based on traction force are shown in Fig. 2F and G. This same procedure was applied to 3T3 cells on the different substrate stiffnesses and to the other cell types (See Supplementary Figs S3–S9 for representative examples). The remainder of this paper will focus primarily on the dynamics of the cortex-associated posts as identified by this procedure.
To compare the dynamical properties across post stiffnesses, we calculated the square root of the average MSD magnitude at τ = 10 s (|${L}_{10}$|) over all cortical posts in each cell (Fig. 3A). This fluctuation magnitude showed no significant differences for 3T3 cells for the different values of micropost stiffness k, as measured by a one-way ANOVA test (P = 0.99). The average value over the full dataset (horizontal dashed line in Fig. 3A) was |${\overline{L}}_{10}=6.9\pm 0.2$| nm (S.E.). As a result, the root-mean-squared (RMS) force from fluctuations |$k{L}_{10}$|showed a linear increase with k (Fig. 3B). These results suggest that the physical mechanism responsible for the deflections is inherently strain (rather than stress) controlled, or that cells adjust their internal fluctuations to maintain a constant RMS strain.
We also compared the fluctuation magnitudes across different cell types, using 3T3 fibroblasts on the corresponding substrate stiffness as a reference. As illustrated in Fig. 3C, CMFs have larger fluctuations than CFs (P < 0.01, NCF = 8, NCMF = 10), and U2OS cells have different fluctuational magnitudes compared to 3T3 fibroblasts (P < 0.05, NU2OS = 11 and N3T3 = 19). These results indicate that dynamical fluctuations vary in magnitude across cell types. We note also that the distribution of the MSD exponents across the cell types studied here showed qualitatively similar behavior to that observed in 3T3 cells [18] (Fig. S10), with large variations both within and between cells, and the MSD exponents in the stress fiber posts αsf were consistently larger than for cortical posts αc (P < 0.01 for each cell type from paired T-tests).
Microposts show non-Gaussian fluctuations
To characterize the active mechanics of the actin cortex, it is important to establish the nature of the active fluctuations. One important question is whether such motions are determined by processes with Normal (i.e. Gaussian) or anomalous (i.e. non-Gaussian) statistics. However, for such assessments, it is important to account for the possibility that heterogeneity in the cytoskeletal rheology or myosin activity either among different posts or among cells could lead standard measures of pooled data to show non-Gaussian distributions, even if the underlying fluctuations are themselves Gaussian. We therefore examined dimensionless measures of individual post Gaussianity that are inherently immune to effects from static heterogeneity across post or cell populations [18].
We first used a dimensionless anisotropy index of each post’s 2D motion by applying principal component analysis (PCA) to cortical-associated microposts’ trajectories over 90 s segments of the 1800 s duration datasets [18]. We computed the moment of inertia tensor I of the trajectory for each segment [52] and characterized the anisotropy of the motion for that interval via the ratio of the two eigenvalues λ1/λ2 (λ1 > λ2) of I that parametrize the trajectories (Fig. 4A). Notably, the distribution of this anisotropy parameter is remarkably similar across the cell types studied (Fig. 4B), with most trajectories being close to isotropic (by comparison to a simulated isotropic random walk) but with a highly anisotropic subset that approximately followed a power-law tail with an exponent of around −3, deviating significantly from the simulated random walk. This anisotropy distribution also showed little variation across substrate stiffness (Fig. 4C). As noted previously [18] and illustrated here in Fig. 4D, the anisotropic tail of this distribution is associated with posts that show large unidirectional displacements of several tens of nanometers that can span tens of seconds. The major axes of these cortical fluctuation trajectories are only weakly correlated with the direction of average traction force (Fig. S11A and B and Table S1), in contrast to stress fiber-associated microposts, which do show such alignment (Fig. S11C and D and Table S1) across both cell type and substrate stiffness, suggesting that the large-anisotropy (and large uniaxial displacement) events in the cortex are not associated with sudden release of traction from a micropost [18]. Further, the probability distribution for the fraction of time when an individual cortical post’s motion is highly anisotropic (defined here as λ1/λ2 > 5) followed a Poisson distribution (Fig. S12A and B) with expectation value ~0.1–0.12 in all cases studied, consistent with our prior observation [18] that large displacement events in the cortex occur randomly in space and time. In contrast, the motions of stress fiber posts were persistent in direction and aligned with a given post’s average traction force (Fig. S12C and D). Again, we see that such behavior appears to be independent of cell type and substrate stiffness.
To illustrate further this intermittent process for individual cortical microposts, we also employed a second dimensionless measure for characterizing anomalous distributions, the non-Gaussian parameter |${\alpha}_2=\frac{\big\langle{x}^4\big\rangle }{3{\big\langle{x}^2\big\rangle}^2}-1$|, which assesses the ratio of the 4th moment to the 2nd moment of a probability distribution [18, 53]. Each post’s 1800 s trajectory was segmented into 20 s intervals, and α2 was calculated for the post’s motion over each interval. Figure 5 shows the distributions of α2 for all such intervals for a given substrate stiffness (Fig. 5A) or cell type (Fig. 5B). Compared to the distribution calculated for a Gaussian random walk, α2 showed significant tails extending to large values, which are likely associated with the highly anisotropic trajectories described above, and again showed remarkable consistency across substrate stiffness and cell type. Therefore, although the magnitude of actin cortical fluctuations varied across individual cells as well as between cells, its generic nature appears to be conserved: large displacements appear randomly in time and space, and their magnitudes are power-law distributed.
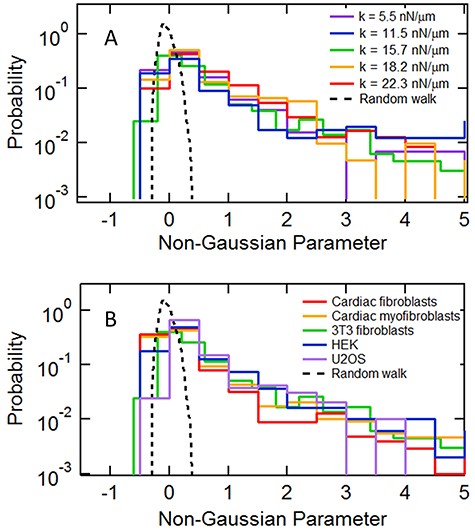
Distribution of the non-Gaussian parameter computed over 20-second intervals for (A) 3T3 fibroblasts on different substrate stiffnesses and (B) for different cell types. The dashed lines show the corresponding distribution for a Gaussian random walk model processed in the identical fashion.
Number of cortical cytoquake events and event rates observed for different cell types and substrate stiffnesses. k: effective micropost spring constant of substrate. N cells: number of cells measured. *: includes data from 39 cells reported previously [18]. 90 s segments: total number of 90 s time intervals searched for events involving anticorrelated motion of near-neighbor cortical post pairs. Events: NN-pairs: number of cytoquake events identified via the coincidence detection screen described in the text and in Ref [18]. Control: number of events from control datasets composed of the same number of 90 s segments for randomly selected non-near-neighbor pairs. Average event rates: cytoquake event rates per pair per hour and per cell per hour (±S.E.) for the data shown in Fig. 9.
| Cell type | k (nN/μm) | N cells | 90 s segments | Events | Average event rates (h−1) | ||
|---|---|---|---|---|---|---|---|
| NN-pairs | Control | Per pair | Per cell | ||||
| 3T3 | 5.5 | 19 | 45 007 | 164 | 8 | 0.15 ± 0.02 | 17 ± 3 |
| 3T3 | 11.5 | 12 | 28 846 | 52 | 0 | 0.11 ± 0.04 | 17 ± 6 |
| 3T3 | 15.7 | 47* | 60 750 | 84 | 2 | 0.07 ± 0.02 | 12 ± 3 |
| 3T3 | 18.2 | 8 | 29 214 | 37 | 1 | 0.07 ± 0.02 | 15 ± 2 |
| 3T3 | 22.3 | 8 | 15 048 | 102 | 0 | 0.25 ± 0.05 | 25 ± 7 |
| CF | 22.3 | 8 | 23 358 | 99 | 2 | 0.16 ± 0.04 | 18 ± 4 |
| CMF | 22.3 | 10 | 32 651 | 164 | 2 | 0.30 ± 0.06 | 27 ± 6 |
| HEK | 15.7 | 12 | 36 494 | 57 | 3 | 0.10 ± 0.03 | 9 ± 2 |
| U2OS | 5.5 | 11 | 42 588 | 60 | 6 | 0.06 ± 0.02 | 10 ± 4 |
Detection of cytoquake events
Physical systems with intermittent and spatially extended, collective rearrangements having a fat-tailed distribution of amplitudes are said to display ‘avalanches’, in analogy to those in snow or sand. Although avalanche-like rearrangements in the cell cortex would naturally explain the non-Gaussian single-post deflections noted above, we have not yet determined if the fluctuations are spatially extended. In our previous work [18] we developed an approach to observe directly the largest of these cortical rearrangement events via coincidence-based detection of anticorrelated motion on nearest neighbor micropost pairs. Briefly, we searched the cortical posts’ deflections within 90 s windows for large deflections on pairs of microposts where the posts’ motions were anticorrelated and aligned with the two posts’ line of centers and were nearly coincident in time [18]. Screens for similar events on comparably sized sets of cortical posts that were not nearest neighbors were used as statistical controls. Details of this process are provided in Table S2. With this approach we identified significant numbers of cytoquake type events for all the cell types we studied and, for 3T3 fibroblasts, across all substrate stiffness we examined. These results are summarized in Table 1 and examples of the events found are shown in Figs 6 and 7. We note that both expanding and contracting events were observed with approximately equal frequency (Table S3). In addition, searches for events with other symmetries (correlated parallel motion or antiparallel tangential motion of the post pairs) did not yield results significantly different from the randomized control (Table S2).
To parameterize these step-like motions, we used an error function to fit the posts’ motion along the lines of centers of each pair (Figs 6 and 7) and extracted their heights, occurrence times and durations from the amplitude, midpoint and width parameters of the error functions, respectively. To assess the nature of these step-like events, we then calculated the averaged motions for each experimental condition, and compared the step durations of the two posts within individual pairs (Figs S13 and S14). As seen previously in our initial measurements of 3T3 cells [18], the amplitudes and shapes of the expanding and contracting events are similar, and there are only weak correlations in step durations between the two posts within the same pair. These observations suggest these processes display complex spatial–temporal evolution, and are consistent with the notion of cytoquakes rather than a viscoelastic response to a single step stress [18].
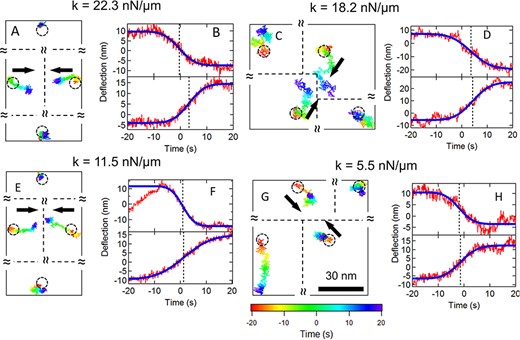
Sample cytoquake events for 3T3 fibroblasts on different substrates of different stiffness. (A), (C), (E), (G) 2D traces over 40 s for nearest neighbor post pairs and the corresponding 2nd nearest neighbor posts. The black arrows show each post’s overall direction of motion. The trajectories are color coded to indicate time (scale shown in G). The circles show the posts’ resting positions. The relative positions of the posts are shown, but the separations are not to scale. (B), (D), (F), (H) Displacements for the posts in the pairs projected along the lines of centers (red traces). Blue curves show error function fits and dashed lines show the midpoints of the fits.
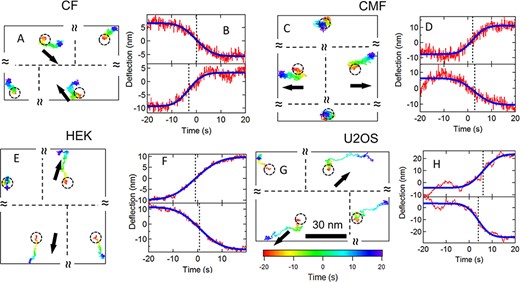
Sample cytoquake events for different cell types. (A–B) Cardiac fibroblast. (C–D) Cardiac myofibroblast. (E–F) HEK. (G–H) U2OS. (A), (C), (E), (G) 2D traces over 40 s for nearest neighbor post pairs and the corresponding 2nd nearest neighbor posts. The black arrows show each post’s overall direction of motion. The trajectories are color coded to indicate time (scale shown in G). The circles show the posts’ resting positions. The relative positions of the posts are shown, but the separations are not to scale. (B), (D), (F), (H) Displacements for the posts in the pairs projected along the lines of centers (red traces). Blue curves show error function fits and dashed lines show the midpoints of the fits.
We then compared the dependence of step heights and durations between substrate stiffnesses and cell types. Figure 8A and B show step heights and durations for 3T3 fibroblasts for substrate stiffnesses from 5.5 nN/μm to 22.3 nN/μm. Since the distributions of step heights and step durations appear to be non-Gaussian, we compared them with a Kolmogorov–Smirnov test (K–S test) instead of the standard t-test, and found no significant differences between the steps’ heights and durations as the substrate stiffness varied. We applied the same analysis of step height and step durations for the different cell types, as illustrated in Fig. 8C and D, and compared them with 3T3 fibroblasts at the corresponding stiffness. Again, we found that the step durations showed no significant differences when compared to 3T3 fibroblasts, and between CFs and their myofibroblast phenotype. However, we found that nonfibroblast cells (HEK and U2OS) showed larger step heights compared with 3T3s (P < 0.05 between HEK and 3T3 fibroblasts on k = 15.7 nN/μm, NHEK = 30 and N3T3 = 126; P < 0.01 between U2OS and 3T3 fibroblasts on k = 5.5 nN/μm, NHEK = 72 and N3T3 = 148), and that CMFs had larger steps compared with CFs (P < 0.05, NCF = 82 and NCF = 122).
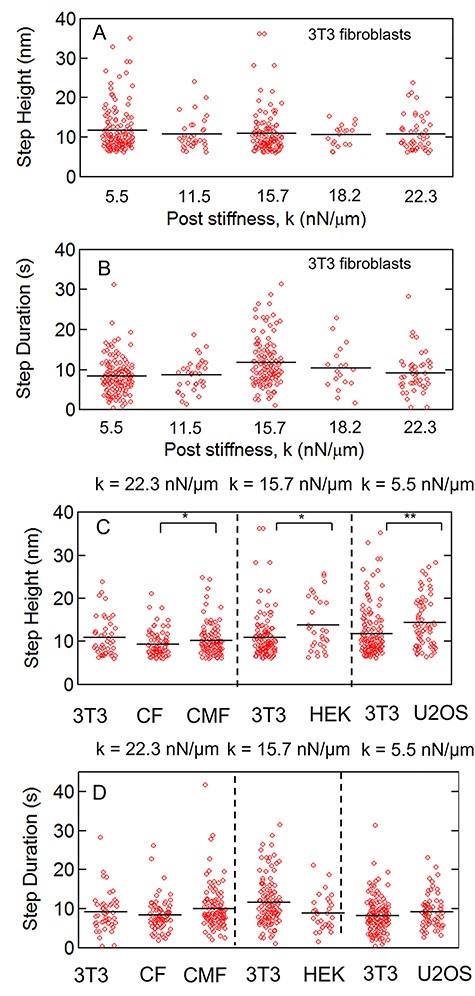
(A) Step heights and (B) step durations of cytoquake events found in 3T3 fibroblasts on different substrate stiffnesses. (C and D) show the corresponding data for different cell types, where CF = cardiac fibroblast and CMF = cardiac myofibroblast. The black lines show the means. Each cell type is compared with 3T3 fibroblasts on the corresponding substrate stiffness. (*: P < 0.05, **: P < 0.01 via Kolmogorov–Smirnov test.)
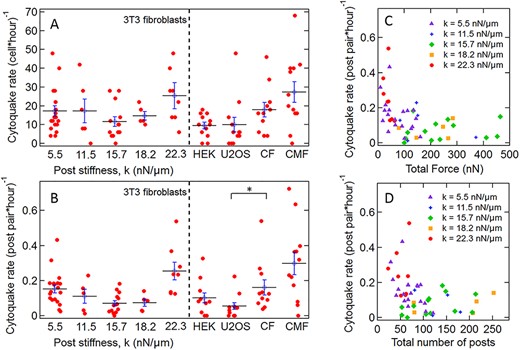
(A) Number of cytoquakes detected per cell per hour and (B) number of cytoquakes detected per post pair per hour in 3T3 fibroblasts on different substrate stiffnesses and for different cell types, where CF = cardiac fibroblast and CMF = cardiac myofibroblast. Each datapoint represents the detected cytoquake rate within an individual cell. Horizontal lines are average values (±S.E). The variations in B between different values of k were significant via a one-way ANOVA test over the full dataset (P < 0.001) (*: P < 0.05). (C and D) Scatter plots showing anticorrelation between number of cytoquakes detected per post pair per hour and (C) total force per cell and (D) cell spread area (number of associated posts) for 3T3 fibroblast cells. The data in C and D are color coded for different substrate stiffnesses. Each datapoint represents an individual cell.
Finally, we assessed the cytoquake event rates, which are shown for all cell types and conditions per cell (Fig. 9A) and per post pair (Fig. 9B) for each cell. The average rates are given in Table 1. Notably, although the former, extensive measure shows little variation across substrate stiffnesses, the latter intensive measure does depend significantly on the substrate stiffness (P < 0.001 via one-way ANOVA) and shows a biphasic response. Interestingly, this response is anticorrelated with both the substrate modulated total average traction force (Fig. 9C) and the cell spread area (Fig. 9D).
DISCUSSION
In this work we have used high spatial and temporal resolution studies of cells on micropost array detectors to measure the active mechanical fluctuation dynamics in several cell types and over a range of effective substrate stiffnesses. The large dataset reported here includes both standard human cell lines (U2OS and HEK) and primary cultures of well-defined neonatal rat cardiac fibroblasts and myofibroblasts. The central finding is that the highly intermittent fluctuating cortical motion and cytoquake behavior we previously identified in 3T3 fibroblasts [18] appear to be a general feature of the cellular actomyosin network.
A robust protocol based on average traction force on individual posts allowed separation of posts into cleanly delineated pools associated with different cytoskeletal components, which we identify with stress fibers and the cortex. The cortical datasets for all the cell types and conditions have many features in common. These include superdiffusive fluctuations in the micropost positions, and post trajectories whose displacement distributions are distinctly non-Gaussian and whose shapes show anomalous high-anisotropy tails with apparent power-law distributions, as revealed by measures that are insensitive to static heterogeneity both within cells (post-to-post) and between cells.
Although such statistical analyses are highly suggestive, a critical feature of our approach is that the mPADs enable detection of large and rare cortical rearrangements via coincidence techniques. Such events were identifiable in significant numbers for all experimental conditions through their effects on near-neighbor post pairs. Notably, the duration of these events, and the symmetry between contracting and expanding pairs (Table S3) rule out many possible explanations for cytoquakes, including post unbinding, out of plane deformations, or the sliding and unbinding of individual myosin mini-filaments [18] (the latter as supposed in current active gel models [14–16]). Alternatively, the cytoquakes’ temporal evolution, spatial extent and symmetry are consistent with the extended deformations or avalanches of a marginal solid [29]. This suggests that the cortex may self-organize into a mechanical state where many elements are on the cusp of unbinding or structural change, i.e. a marginal network. This is consistent with recent simulations of actomyosin, that showed that the unbinding of individual myosin complexes were spatially and temporally correlated, leading to cytoquake-like rearrangements [20].
Our results also provide new insight on the relative activity of the myofibroblast phenotype. Myofibroblasts are well known to play an active role in numerous physiological processes including wound healing, as well as pathologic responses such as fibrosis [30]. The force generation associated with such phenomena, and which we see in our comparison of CFs and CMFs herein, is typically associated with stress fiber production and upregulation of cytoskeletal components such as α-SMA. Indeed, we observe all these hallmarks in our system, but we also found significant enhancements in cortical mechanical fluctuations, with increases in the superdiffusive exponent and in the avalanche rates and amplitudes. This suggests that there is a broader change in the mechanical state upon induction of the myofibroblast phenotype.
Although cellular contractility is well known to be sensitive to substrate stiffness (durosensing) [33–37], our findings reveal that cortical displacements are only weakly affected by the mechanical environment but the corresponding fluctuating forces and cytoquake event rates are strongly influenced by the effective stiffness of the substrate. We conjecture that a self-organized marginal network in contact with an elastic ECM would display correlations between the network’s internal mechanical state (such as crosslink or myosin complex tension) and ECM stiffness that could provide a mechanism of durosensing. Further, these results have led to the intriguing prediction that the resulting enhanced susceptibility of this marginally stable state to small changes in the cell’s chemical or mechanical environment can explain the cell’s ability to adapt quickly to external cues, and drive dynamic mechanical processes, such as chemotaxis [20].
CONCLUSION
In summary, these studies have advanced the elucidation of the spatiotemporal correlations of the dynamics of the actomyosin cortex. The picture of cortical dynamics that emerges—of a system whose motion is dominated by fluctuations with anomalous distributions that are influenced significantly by rare but large events—suggests that physical phenomena associated with marginally stable states in plastic materials may be key to understanding the mechanical states of cells and that models of cellular behavior must encompass such phenomena in order to develop predictive power for the description of cell mechanics.
Acknowledgments
We thank C. S. Chen and B. Camley for helpful discussions, C. S. Chen for donation of mPAD masters, and T. Schroer for donation of U2OS cells.
Funding
This work was supported by the National Heart, Lung and Blood Institute of the National Institutes of Health [grant number HL-127087] and the National Science Foundation [grant PHY-1915193 at Johns Hopkins University and grant PHY-1915174 at the University of Pennsylvania].
Conflict of interest statement
None declared.
