


Summary
We investigate crustal Vp–Vs ratios and thickness along the Transantarctic Mountain (TAM) front and on Ross Island, Antarctica to determine if the TAM crust has been modified by the Neogene magmatism associated with Ross Island. A seismic low velocity zone (LVZ) in the upper mantle beneath Ross Island extends laterally ∼80 km under the TAM front, and mantle temperatures within the LVZ may be sufficiently elevated for partial melting to have occurred and modified the crust. Data for the study come from 16 temporary seismic stations that were part of the TAM Seismic Experiment and three permanent stations. Estimates of Vp/Vs (κ) and crustal thickness (H) have been obtained from receiver functions analysed using the H–κ stacking method for 10 of the stations, and for the remaining stations, crustal thickness has been calculated by using the Moho Ps arrival time with an assumed Vp/Vs value. A Vp/Vs value of 1.88 is obtained for Ross Island, consistent with the mafic composition of the volcanic rocks from Mt. Erebus. Vp/Vs values for stations in the TAM situated away from the LVZ range from 1.63 to 1.78, with a mean of 1.73, while values for stations in the TAM lying above the LVZ range from 1.67 to 1.78, with a mean of 1.72. This result indicates that there is little difference in bulk crustal composition for areas above and away from the LVZ, and together with a Vp/Vs value (1.73) that is typical for felsic to intermediate composition crust, suggests that the crust along the TAM front has not been altered significantly by mafic magmatism. Crustal thickness estimates along the coast are quite variable, ranging from 18 to 33 km, and increase to 39 km inland beneath the crest of the TAM. On Ross Island, crustal thickness estimates range between 19 and 27 km.
1 Introduction
In this study, we investigate crustal structure along the Transantarctic Mountain (TAM) front in the vicinity of Ross Island, Antarctica, to determine the extent to which the crust has been modified by the Neogene volcanism associated with Ross Island and the Terror Rift. The TAM represent Earth's largest non-collisional mountain range and mark the tectonic boundary between the East Antarctic (EA) craton and the West Antarctic Rift System (WARS; Fig. 1). Extension within the WARS began during the Jurassic and continues today within the Terror Rift (Behrendt et al. 1991a,b; Fig. 1). Mafic to intermediate alkaline volcanism is present at Mt. Erebus, located on Ross Island at the southern end of the Terror Rift.
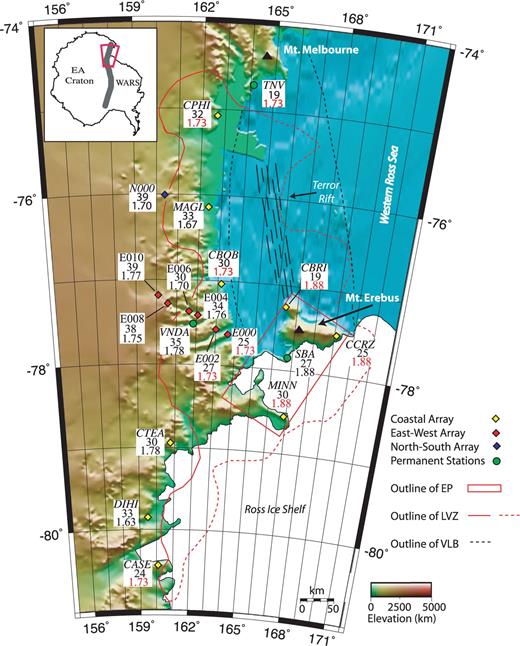
Topographic map of the TAM showing seismic station locations and results from this study. The red box outlines the general extent of the Erebus volcanic province and the thin red line marks the extent of a –1 per cent S-wave velocity anomaly (LVZ) from Watson et al. (2006). The eastern edge of the LVZ is marked with a dashed line because it is not well defined. EA, East Antarctica; WARS, West Antarctic Rift System. Crustal thickness estimates (km) and Vp–Vs ratios are given below each station name. A Vp–Vs ratio in red indicates that it was assumed. Inset shows a map of Antarctica with the study area highlighted. The TAM are marked by the grey line.
P- and S-wave tomography models (Watson et al. 2006), as well as surface wave tomography models (Lawrence et al. 2006a), reveal a low velocity zone (LVZ) in the upper mantle beneath and surrounding Ross Island. Laterally, the LVZ extends from north of Ross Island to ∼80 km inland from the coast beneath the TAM (Fig. 1). The LVZ, which extends from the uppermost mantle to least 150 km depth, indicates that upper-mantle temperatures over a broad area may be elevated by ∼200–300 K, sufficiently high to cause partial melting (Watson et al. 2006). Consequently, the crust and upper mantle surrounding Ross Island may have been altered over a much broader region than suggested by the spatial extent of the volcanism (Fig. 1). To determine if the crust away from Ross Island has been modified by the Neogene magmatism, we obtain new estimates of Vp/Vs and crustal thickness from receiver function (RF) analysis using broad-band data from 16 stations on Ross Island and along the TAM front that were part of the Transantarctic Mountain Seismic Experiment (TAMSEIS), as well as from three permanent stations.
2 Geological Setting and Background
The initial uplift of the TAM began at ∼55 Ma (Fitzgerald 1992, 1994). The TAM basement consists of Precambrian and Cambrian metasediments, Cambro-Ordovician granites and Devonian granodiorites (Fitzgerald 1992). The basement complex was eroded to form the Kurki peneplain before being overlain by the Devonian-Triassic Beacon Supergroup, which consists of shallow marine, glacial and alluvial sediments (Barrett et al. 1986). Magmatism within the TAM occurred at ∼180 Ma with the intrusion of the Ferrar dolerite sills and the eruption of the Kirkpatrick basalt (Fitzgerald 1992).
Ross Island sits at the southern end of the Victoria Land Basin (VLB) in the western Ross Sea (Fig. 1). High crustal P-wave velocities and gravity modelling results indicate that the VLB crust has been extensively intruded and thinned (Trey et al. 1999). Presently, extension is thought to be occurring in the Terror rift, which formed by transtensional and strike-slip faulting in the early Neogene (Behrendt et al. 1991b, 1996). The Terror Rift lies 50–100 km east of the TAM front in the VLB, is ∼70 km wide, and stretches from Mt. Erebus to Mt. Melbourne (Cooper et al. 1987; Paulsen and Wilson 2009; Fig. 1). Mt. Erebus is located in the middle of Ross Island, at one end of the Terror Rift (Fig. 1). It marks the northern-most extent of the Erebus Volcanic Province (EVP), which extends south of Ross Island to Minna Bluff (station MINN; Kyle 1990a,b; Cooper et al. 2007; Fig. 1). The composition of lava flows forming Mt. Erebus ranges from basanite to anorthoclase phonolite (Kyle et al. 1992).
Several studies have investigated crustal thickness beneath the TAM using RFs (Bannister et al. 2003; Lawrence et al. 2006b; Pondrelli et al. 1997). Bannister et al. (2003) used data from a 10-station temporary array plus data from permanent stations VNDA and SBA to compute RFs using the multiple-taper spectral correlation method of Park and Levin (2000). Lawrence et al. (2006b) investigated crustal structure using data from the TAMSEIS network along with data from three permanent stations SBA, TNV and VNDA. They used a niching genetic algorithm to jointly invert RFs and Rayleigh wave phase velocities for crustal and upper-mantle structure. Both studies report crustal thicknesses of ∼20 km for Ross Island and along the TAM front adjacent to Ross Island, and thicker crust (36–40 km) beneath the TAM.
Pondrelli et al. (1997) used data from a four station temporary array that crossed perpendicular to the strike of the TAM approximately along 76°S, near TAMSEIS stations MAGL and N000 (Fig. 1). They obtained Moho depth estimates of 26 km near the coast and 41–43 km beneath the crest of the TAM. Della Vedova et al. (1997) used data from 58 portable stations to conduct a wide angle seismic refraction experiment along the ACRUP transect which also ran along 76°S. Using forward ray trace modelling and traveltime inversion, Della Vedova et al. (1997) obtained Moho depth estimates of ∼38 km beneath the crest of the TAM which decreased to ∼30 km at the coast.
3 Data, Methods and Results
Data for this study comes from 16 TAMSEIS stations and three permanent stations located on Ross Island and along the TAM front above the upper-mantle LVZ imaged by Watson et al. (2006) and Lawrence et al. (2006a,b) (Fig. 1). The TAMSEIS network consisted of 41 three-component, broad-band seismometers that were deployed from 2000 November until 2003 December. The stations were configured in three arrays: Coastal, East–West and North–South (Fig. 1). Data from nine stations of the Coastal array, including two stations on Ross Island, six in the East–West array and one station from the North–South array have been used, along with data from the permanent stations SBA, TNV and VNDA. All of these stations were located on bedrock, while the remaining TAMSEIS stations were located on ice. Additional information about the TAMSEIS network can be found in Lawrence et al. (2006a).
RF analysis is commonly used to obtain constraints on crust and upper-mantle structure beneath three-component seismic stations (e.g. Langston 1979). In this study, the iterative time-domain deconvolution method of Ligorría and Ammon (1999) was used to generate the RFs from a range of backazimuths (see Supporting Information). The RFs were then filtered with a Gaussian pulse width of 1.0 (f≤ 0.5 Hz) or 2.5 (f≤ 1.25 Hz), and the radial and transverse components were inspected for evidence of lateral heterogeneity. Events with large amplitude transverse RFs were removed from the data set (Finotello 2009). A least-squares misfit criterion was also applied to evaluate the quality of the RFs, and those with a fit of 85 per cent and higher were used for modelling and interpretation. A cut-off of 85 per cent resulted in only a few RFs for stations TNV, CCRZ, CBOB, CBRI and so for these stations, RFs with a minimum fit of 75 per cent were used.
To apply the H–κ method, weights must be assigned to each phase in eq. 1, and an average crustal Vp must be selected. A Vp of 6.5 km s−1, which is consistent with average crustal P-wave velocities from previous studies (Della Vedova et al. 1997; Pondrelli et al. 1997), and a weighting system of w1= 0.5, w2= 0.5 and w3= 0.0 were used. The third weight (w3) was set to be zero because it was difficult to consistently identify a clear second crustal reverberation (PsPs+PpSs) on the RFs at every station (Figs 2–4 and Supporting Information).
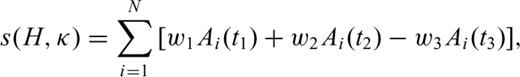
Result of H–κ stacking of receiver functions for station CTEA. Left-hand side: stacking surface where contours show percentage values of the objective function and the red line gives 90 per cent confidence ellipse. Right-hand side: receiver functions with labelled arrivals of relevant phases predicted by best fitting H and κ shown with red lines. Receiver functions have been computed using a Gaussian pulse width of 1.0.
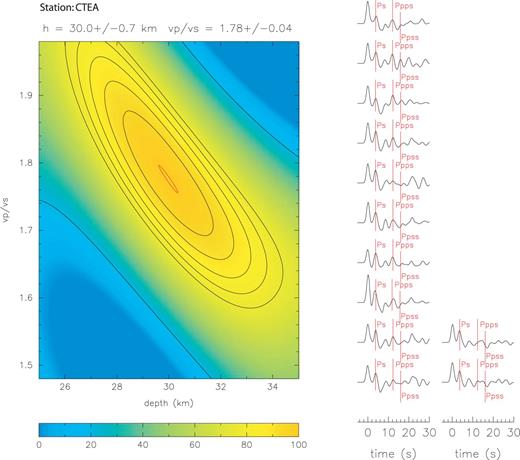
Result of H–κ stacking of receiver functions for station SBA. Left-hand side: stacking surface where contours show percentage values of the objective function and the red line gives the 90 per cent confidence ellipse. Right-hand side: Selected receiver functions with labelled arrivals of relevant phases predicted by best fitting H and κ shown with red lines. Receiver functions have been computed using a Gaussian pulse width of 2.5.

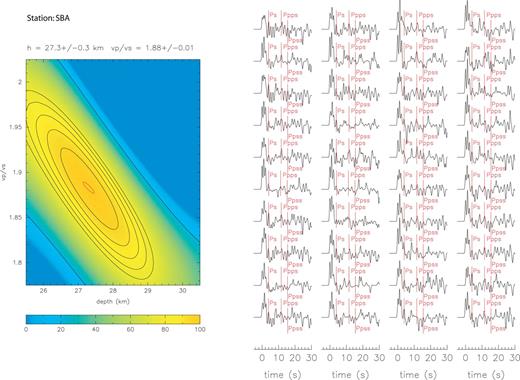
Receiver functions for station E000 arranged by ray parameter. The red marks show Moho Ps arrival times picked and the blue line shows the Moho Ps arrival time for the crustal thickness given in Table 2.
Results for two stations are shown in Figs 2 and 3. For most stations, as illustrated for station CTEA, RFs computed using a Gaussian pulse width of 1.0 were used (Fig. 2). For station SBA, however, RFs with a Gaussian pulse width of 1.0 did not yield consistent arrivals for the Moho Ps and crustal reverberations. Therefore, RFs computed with a Gaussian pulse width of 2.5 was used instead to avoid interference with arrivals from other possible intracrustal discontinuities (Fig. 3). Results for the other stations can be found in the Supporting Information.
Uncertainties in H and κ were obtained simultaneously using a bootstrap method, which involved repeating the stacking procedure 200 times with a resampled data set selected at random from the original data set (Efron and Tibshirani 1991). Examples of the uncertainties are shown in Figs 2 and 3. In addition, for assessing uncertainty in crustal thickness and Vp/Vs resulting from the choice of the mean crustal P-wave velocity, the H–κ stacks were recomputed using mean crustal P-wave velocities of 6.3 km s−1 and 6.7 km s−1. To obtain an overall uncertainty in H and κ, the uncertainty obtained from the bootstrap method was combined with the range of H and κ values obtained when using different mean crustal P-wave velocities, respectively. Results and the overall uncertainties for the 10 stations where the H–κ stacking method was successfully applied are summarized in Table 1 and Fig. 1.
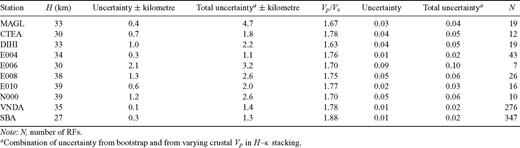
Results from H-κ stacking method using crustal Vp of 6.5 km s−1.
For nine stations, the H–κ stacking method did not yield acceptable results mainly because the crustal multiples (PpPs and PsPs+PpSs) could not be clearly identified on RFs generated with either a Gaussian pulse width of 1.0 or 2.5 (Fig. 4 and Supporting Information). Therefore, for those stations, the method described by Zandt et al. (1995) was followed to estimate H using the arrival time of the Moho Ps phase and an assumed Vp/Vs value. An assumed Vp/Vs value of 1.73, which is an average of Vp/Vs values from the stations in Table 1 excluding SBA, was used for all stations located outside the EVP. For the stations located within the EVP (CBRI, CCRZ and MINN; Fig. 1), a Vp/Vs value of 1.88 was used to be consistent with the H–κ stacking result from SBA. The results are summarized in Table 2 and Fig. 1, and the uncertainty associated with crustal thickness estimates in Table 2 represent two standard deviations of the mean value.
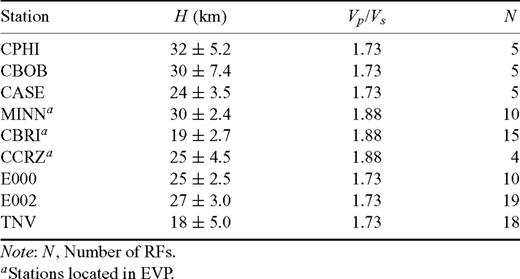
Summary of H estimates using the method of Zandt et al. (1995).
4 Discussion
In this section, we first examine crustal Vp/Vs to investigate the influence of Neogene magmatism on crustal composition, and then comment on crustal thickness. We note that the Vp/Vs values obtained are not likely affected by dipping structure along the TAM front because most of the events come from backazimuths that are generally along strike of the front (Supporting Information). Vp/Vs is commonly used as a general indicator of bulk crustal composition. Typical Vp/Vs values for different lithologies are on average ∼1.70 for felsic rocks (i.e. granite), ∼1.76 for intermediate rocks (i.e. diorite) and ∼1.84 for mafic rocks (i.e. basalt), and are little influenced by subsolidus temperature variations (Christensen 1996).
The Vp/Vs value of 1.88 obtained for station SBA on Ross Island indicates a bulk crustal composition that is mafic, which is consistent with the composition of volcanic rocks on the island. Vp/Vs values for stations in the TAM situated away from the LVZ (i.e. E010, E008, CTEA, DIHI; Fig. 1) range from 1.63 to 1.78, with a mean of 1.73, while values for stations in the TAM lying above the LVZ (i.e. E006, VNDA, E004, MAGL, N000; Fig. 1) range from 1.67 to 1.78, with a mean of 1.72. This comparison shows that there is little difference in bulk crustal composition for areas above and away from the LVZ, and together with a mean Vp/Vs (1.72) which is typical for felsic to intermediate composition crust, suggests that the crust along the TAM front has not been altered significantly by mafic magmatism. If a significant portion of the crust had been modified by mafic intrusions and/or underplating, then Vp/Vs values closer to the Vp/Vs ratio of 1.88 found at Station SBA would be expected across regions of the TAM front lying above the LVZ.
Is it possible that there could be minor modification of the crust under parts of the TAM front that is small enough to go undetected? If significant compositional modification (e.g. over 5–10 km) of the lowermost crust had occurred, then a gradational transition across the crust–mantle interface would be expected. A clear Moho Ps can be seen on the RFs for all of the stations, and, in addition, the multiples from the Moho can also be seen clearly on many of the stations, even for those stations situated above the LVZ (Supporting Information). If the crust–mantle interface were gradational over a depth interval of more than ∼5 km, then a clear Moho Ps arrival, as well as multiples from the Moho, would not be readily observed. Thus, while a few kilometres of lower crustal modification cannot be ruled out, larger amounts of crustal modification by mafic intrusions and/or underplating are not consistent with the nature of the arrivals on the RFs or with Vp/Vs values obtained.
A comparison of the Vp/Vs values for the TAM crust to values for Precambrian crust of similar age on other Gondwanan continents corroborates further the conclusion that the TAM crust above the LVZ has not been significantly modified. For example, Pan African crust in East Africa that has not been affected by Cenozoic rifting has an average Vp/Vs ratio of 1.75 (Dugda et al. 2005).
Along the East–West array, crustal thickness estimates range from ∼25 km near the coast to ∼39 km beneath the crest of the TAM (Fig. 1). Along the Coastal array and TAM front, crustal thickness is quite variable ranging between 18 and 33 km. In comparison to results from previous studies, near the crest of the TAM our results (stations E004–E010 and VNDA) are consistent with the Moho depths reported by Bannister et al. (2003) and Lawrence et al. (2006b) (Table 1 and Fig. 1). However, near station E000 along the coast, Bannister et al. (2003) reported a crustal thickness of ∼18 km, but we find a ∼25 km thick crust beneath station E000. In the velocity model obtained by Bannister et al. (2003) from inverting RFs, a Moho depth of ∼18 km corresponds to an S-wave velocity increase to 4.0–4.2 km s−1. Their model also shows that at ∼25 km depth there is an S-wave velocity increase to 4.3–4.4 km s−1, which is consistent with our Moho depth estimate for station E000.
Bannister et al. (2003) suggested that the transition between the VLB and TAM near Ross Island is characterized by a rapid change in crustal thickness from ∼20 km to ∼40 km. Although the majority of the ray coverage in our data set is parallel to this transition, our results indicate that this transition may not be quite as pronounced, with only a change in crustal thickness from ∼25 to ∼40 km. Bannister et al. (2003) also commented on crustal Vp/Vs but noted that it was not well constrained in their models. At station VNDA they reported a Vp/Vs value of ∼1.76, which is consistent with our result.
Lawrence et al. (2006b) also used the TAMSEIS data set to estimate crustal thickness beneath the TAM. Along the East–West Array, our results are consistent with the crustal thickness estimates reported by Lawrence et al. (2006b) except beneath two stations. At stations E000 and E004 our results indicate a crustal thickness of ∼25 km and ∼35 km, respectively, both ∼5 km thicker than reported by Lawrence et al. (2006b). Similarly, for the Coastal array stations, excluding TNV and CASE, our crustal thickness estimates are, on average, between 8 and 10 km thicker than those reported by Lawrence et al. (2006b). At stations CASE and TNV, our results are consistent with Lawrence et al. (2006b), within the large uncertainties in our Moho depth estimates for these stations (Table 2).
There are two possible explanations for the difference between our crustal thickness estimates and those of Lawrence et al. (2006b). The first one has to do with how Lawrence et al. (2006b) interpreted their velocity models. For example, at station E000, Lawrence et al. (2006b) placed the Moho at ∼20 km depth, and on their velocity model, this depth coincides with an S-wave velocity increase from ∼3.45 to 4.1 km s−1. Our results indicate a deeper Moho (25 km, Table 2), which coincides with an S-wave velocity increase in the Lawrence et al. (2006b) model for this station from 4.1 to 4.45 km s−1. There are similar discrepancies in the interpretation of the velocity models for stations CBOB, CTEA and MAGL.
The second explanation concerns station DIHI, where the difference in crustal thickness could be due to the low average crustal Vs (∼3.1 km s−1) in the Lawrence et al. (2006b) model compared to the higher average crustal Vs (∼3.9 km s−1) in our model. Lawrence et al. (2006b) did not attempt to constrain the crustal Vp/Vs in their models.
Comparisons with the results obtained by Pondrelli et al. (1997) show that our crustal thickness estimates are consistent beneath the crest of the TAM, but our results are ∼8 km thicker along the coast. The difference in crustal thickness estimates may reflect the small number (4) of events used by Pondrelli et al. (1997) in their analysis. In contrast, our results are consistent with the seismic refraction profile published by Della Vedova et al. (1997), which shows ∼40 km thick crust under the crest of the TAM and ∼30 km thick crust under the coast.
Our crustal thickness estimate for station SBA on Ross Island of ∼27 km is 7 km thicker than the estimates from Bannister et al. (2003) and Lawrence et al. (2006b). Bannister et al. (2003) reported a Moho depth of ∼20 km by choosing the depth at which the S-wave velocity reached 4.2–4.3 km s−1 in their model, but they noted that the Moho structure in their model is gradational. Their model also shows an increase in S-wave velocity to 4.3–4.4 km s−1 at ∼28 km depth. Similarly, Lawrence et al. (2006b) reported a Moho depth of ∼20 km for SBA based on the depth in their velocity model at which the S-wave velocity increased to 4.15–4.35 km s−1. Consistent with Bannister et al. (2003), in the Lawrence et al. (2006b) velocity model there is another S-wave velocity increase to 4.35–4.5 km s−1 at ∼26 km. If the deeper discontinuity (∼26–28 km depth) in the Bannister et al. (2003) and Lawrence et al. (2006b) models is selected as the Moho, then there is little discrepancy in the results between the three studies.
For station SBA, if we force the H–κ stacking algorithm to give a Moho depth of 20–22 km, which can be done by limiting the time window over which the algorithm is able to pick a Moho Ps, then we obtain a Vp/Vs value of 1.59, which is unrealistically low. Placing the Moho at 27 km depth instead of 20 km yields both a good fit to the RFs and a Vp/Vs value that is consistent with the composition of the volcanics on Ross Island, and therefore we argue that 27 km is a better estimate of crustal thickness than 20 km beneath station SBA.
For the other two stations on Ross Island, CBRI and CCRZ, we obtained Moho depth estimates of 19 and 25 km, respectively (Table 2). Within the reported uncertainty, our crustal thickness estimate for CBRI is consistent with the estimate from Lawrence et al. (2006b) and with the estimate from Bannister et al. (2003) for a nearby station. For station CCRZ, our Moho depth estimate is also consistent with the estimate from Lawrence et al. (2006b), given the reported uncertainties for our Moho depth estimate.
We obtained a crustal thickness estimate of ∼30 km for MINN, which is ∼10 km thicker than the estimate of Lawrence et al. (2006b). This discrepancy in Moho depth can be attributed to the selection of the Moho Ps arrival on the RFs. Lawrence et al. (2006b) identified the Moho Ps arrival at ∼3.3 s on their higher frequency RFs while we identified a Moho Ps at ∼4.2 s on our lower frequency RFs, which is consistent with the lower frequency RF from Lawrence et al. (2006b). If we force the H–κ algorithm to select the arrival at 3.3 s to be the Moho Ps using the higher frequency RFs, then the H–κ stacking algorithm yields two maxima in the objective function, one with a Vp/Vs value of 1.74 and a Moho depth of 30 km, and a second one with a Vp/Vs value of 1.64 and a Moho depth at 34 km. Given this result, we argue for a Moho depth of 30 km beneath station MINN.
5 Summary and Conclusions
In summary, Vp/Vs values for stations in the TAM situated away from the LVZ in the upper-mantle range from 1.63 to 1.78, with a mean of 1.73, while values for stations in the TAM lying above the LVZ and closer to the EVP range from 1.67 to 1.78, with a mean of 1.72. On Ross Island, a Vp/Vs value of 1.88 was obtained. Crustal thickness estimates along the Coastal array vary from 18 to 33 km, and along the East–West array they range from 25 km near the coast to 39 km beneath the crest of the TAM. On Ross Island, crustal thickness beneath stations CBRI is ∼19 km and increases to ∼27 and ∼25 km beneath stations SBA and CCRZ, respectively.
A comparison of the Vp/Vs values shows that there is little difference in bulk crustal composition for areas above and away from the LVZ, and together with a mean Vp/Vs value (1.72) typical for felsic to intermediate composition crust, suggests that the crust along the TAM front has not been altered significantly by mafic magmatism. If a significant portion of the crust had been modified by mafic intrusions and/or underplating, then Vp/Vs values closer to the Vp/Vs ratio of 1.88 found at Station SBA would be expected across areas of the TAM front lying above the LVZ. While a few kilometres of lower crustal modification cannot be ruled out, larger amounts of crustal modification by mafic intrusions and/or underplating are not consistent with the nature of the arrivals on the RFs or with the Vp/Vs values obtained.
Comparison to previous work indicates that along the Coastal array, our estimates of crustal thickness are 8–10 km thicker than the estimates from Lawrence et al. (2006b), except for stations TNV and CASE. Along the East–West array our results match well with Lawrence et al. (2006b) and Bannister et al. (2003), except at the coast, where our crustal thickness estimate is ∼5 km thicker. In addition, at stations SBA and CCRZ on Ross Island, we obtain a crustal thickness that is ∼5–7 km thicker than previously estimated. The difference in crustal thickness estimates possibly reflects the use by Lawrence et al. (2006b) and Bannister et al. (2003) of a lower Vs to define the Moho than we used, and by the low average crustal Vs used by Lawrence et al. (2006b) compared to the Vs we used.
Our results also indicate that the crust along the TAM front is quite variable, and, in many locations thicker than previously estimated. Bannister et al. (2003) and Lawrence et al. (2006b) suggested that there is an abrupt change in crustal thickness from ∼20 km at the coast to ∼40 km beneath the TAM near Ross Island. Our results show an increase in crustal thickness as well, but it is not quite as pronounced, increasing only from ∼25 km at the coast to ∼40 km beneath the TAM. This finding is consistent with the crustal model of Della Vedova et al. (1997) developed from seismic refraction data. However, elsewhere along the TAM front (i.e. station TNV), the crust is only 18 km thick.
Acknowledgments
We thank W. Geissler and an anonymous reviewer for constructive comments. This research has been supported by the National Science Foundation (grants OPP 9909603 and OPP 9909648).
Supporting Information
Additional Supporting Information may be found in the online version of this article:
Station locations
Part A. H-κ stacking results for stations in Table 1. Mean crustal Vp and selection of weights used for stacking are explained in the text. Arrival times of Moho Ps and crustal multiples predicted by the H-κ results are indicated on the receiver functions.
Part B. Receiver functions plotted against ray parameter for stations in Table 2.Receiver functions shownwere obtained using a Gaussian filter of 1.0 except for stations CCRZ and CBRI, where a Gaussian of 2.5 was used.
Part C. Azimuthal data coverage illustrated on figures showing Moho Ps conversion points (red symbols) for receiver functions used in this study. Small maps show conversion point locations for individual stations.
Please note: Wiley-Blackwell are not responsible for the content or functionality of any supporting materials supplied by the authors. Any queries (other than missing material) should be directed to the corresponding author for the article.
References
