Summary
The S-ratio is a rock magnetic parameter employed to provide a relative measure of the contributions of low and high coercivity material to a sample's saturation isothermal remanent magnetization (SIRM). The current form of expressing the S-ratio involves reporting a single value that represents the relative contribution of the low coercivity material, such as magnetite, to the overall SIRM. Expressing the S-ratio in this form is somewhat misleading, suggesting that the derived values are real numbers held in a Euclidian sample space. In fact, S-ratio data are constrained to a 1-D unit-simplex, meaning that many of the descriptive statistics reported for collections of data, for example, means and standard deviations, are in error because the employed statistical methods are designed for unconstrained data only. A simple example of this problem will be given, followed by a demonstration of how meaningful statistics for the S-ratio can be obtained using the additive-log-ratio transform of Aitchison.
1 Introduction
The S-ratio parameter compares the SIRM obtained in a saturating forward field with the isothermal remanent magnetization obtained subsequently in a suitable backfield (yielding
IRMbf). The classical S-ratio,
Sclassic, proposed by
Stober & Thompson (1979) is based simply the ratio of these two remanences (
Thompson & Oldfield 1986):
and, thus, could lie in the range from −1 (only high coercivity material) to 1 (only low coercivity material). Subsequently,
Bloemendal et al. (1992) redefined the S-ratio to lie in the range 0 to 1, with the derived parameter,
S, providing a measure of the relative contribution of the low coercivity material to the total remanence:
The relative contribution of the high coercivity material to the SIRM is thus 1 −
S. Alternatively, as discussed by
Kruiver & Passier (2001),
S can be determined in the absence of magnetic interactions by normalizing the remanence formed in a suitable non-saturating forward field,
IRMff, by the SIRM:
This is commonly termed the ‘forward S-ratio’. It is important to note that it has been shown that the S-ratio is not solely a function of mineral type but is also influenced by factors such as grain size and substitution (
Bloemendal et al. 1992;
Liu et al. 2007). For simplicity, the following discussion of the statistical analysis of the S-ratio will refer only to ‘low’ and ‘high’ coercivity components.
When dealing with collections of samples, it is common to present descriptive statistics, such as the arithmetic mean and standard deviation of the S-ratio, to represent the relative importance of low coercivity minerals over the sample set (Chaparro et al. 2004; Peck et al. 2004; Garming et al. 2005; Chadima et al. 2006; Otamendi et al. 2006; Kawasaki et al. 2007; Song et al. 2007). However, the current use of basic descriptive statistics has ignored a fundamental property of the S-ratio, which is that it provides exclusively ‘relative’ rather than ‘absolute’ information and is actually a bivariate measure represented by both low and high coercivity contributions (S and 1 −S, respectively). These two relative measures must both lie in the range 0 to 1, with the added criterion that they sum to one for any given sample (technically, they are constrained to a two-part simplex,  , I.E. A Line Segment). The S-ratio is thus a form of so-called ‘closed’ data (Swan & Sandilands 1995), where the quantifications of the low and higher coercivity components are fundamentally interdependent. The statistical methods currently employed to characterize S-ratio data sets are only applicable to unconstrained (values can potentially range between −∞ and +∞) univariate data, and they will thus produce spurious results.
To demonstrate this problem, a numerical example will follow, which ‘describes’ a collection of three S-ratio values using univariate statistics that do not account for the properties and constraints discussed above. This will be followed by a description of the additive-log-ratio transform that provides a method with which statistics can be obtained for S-ratio data correctly. A second example will be given using published data, which shows how important insights into the behaviour of the S-ratio can be obtained by taking the  sample space into consideration.
2 A Simple Example
Consider the collection of S-ratios,
x =[0.35, 0.73, 0.90], the arithmetic mean of which is given by
where
n is the number of values. Next, the standard deviation,
s, can be determined:
Finally, the values of

and
s = 0.28 are employed to find the upper, μ
U, and lower, μ
L, 1-α confidence limits on the mean, μ, of the population (
Swan & Sandilands 1995):
where
t represents the value of Student's
t with
n− 1 degrees of freedom. This results in 95 per cent confidence limits of μ
L = −0.04 and μ
U = 1.36, which are clearly in error because they fall outside of the allowable range for the S-ratio 0 to 1. These spurious statistics are a direct result of considering the low coercivity part of the S-ratio in isolation, rather than considering the true relative nature of the data.
To determine descriptive statistics for the S-ratio information properly, it is necessary to consider the ratio of the low and high coercivity components together. This can be performed using the additive-log-ratio (alr) transform (
Aitchison 1982,
1986), which provides a method with which to map the relative bivariate S-ratios from
into
real space. In addition the values become unconstrained in so far as they can potentially range between −∞ and +∞. The key to understanding the applicability of the alr is to appreciate that it is the relative magnitude and variation of the low and high coercivity components, which is important in the statistical analysis. For a given value,
S, of the S-ratio the
alr transform takes the form
Note that because the alr employs the ratio of the low and high coercivity contributions, it preserves the relative nature of the data. Given the form of
eq. (8), it is apparent that the alr is valid in the range 0 <
S < 1, and thus, it can only be applied to S-ratios of the form given by
Bloemendal et al. (1992) and not to
Sclassic, which can range from −1 to 1 (
Thompson & Oldfield 1986). The inverse operation (alr
−1) to transform from log-ratio space back into the data space is given by
Once transformed into unconstrained univariate space using
eq. (8), standard statistical methods can be applied and the parameters described by
eqs (4)–(7) can be determined correctly. Finally, these parameters can be transformed back into the original
sample space using
eq. (9) to provide values that are constrained in the same manner as the original input values of the S-ratio (
Weltje 2002). Repeating the example above using
yields μ = 0.70 as a measure of the ‘location’ of the data (it is necessary to adjust our terminology because the term
mean has no physical meaning is this situation;
Aitchison 1989). The derived 95 per cent confidence limits, μ
L = 0.07 and μ
U = 0.99, are now correct and fall into the allowable range for S-ratios.
3 The S-Ratio for Mixtures of Magnetite and Haematite
Frank & Nowaczyk (2008) recently published the results of a detailed study that investigated the rock magnetic properties of well-defined mixtures of magnetite and haematite. In one part of their study, S-ratios of the form given in eq. (2) were determined as a function of relative magnetite versus haematite composition using a forward field of 1.5 T and a backfield of −0.2 T (Fig. 1a and see their fig. 8). Although clearly non-linear, the mathematical form of the function relating the value of the S-ratio to the composition of the magnetite versus haematite mixture is not apparent.
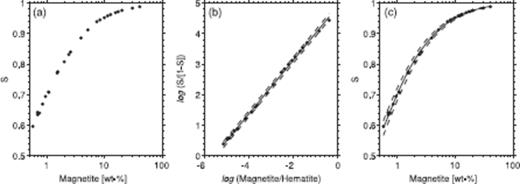
Figure 1.
(a) Experimental S-ratio data from Frank & Nowaczyk (2008) for a collection of magnetite and haematite mixtures. Only samples with S < 0.99 and magnetite >0.5 (wt. per cent) were selected for the analysis because the data becomes noisy toward its extremes. (b) After applying the additive-log-ratio transform to both the S-ratio and mineral mixture values, a linear regression line (solid) can be fitted to the data and a 95 per cent prediction interval (dashed) determined. (c) Using the inverse transform the results of the regression analysis can be returned to the original sample space and plotted with the measured data.
The first step to determine a suitable regression relationship between the S-ratio and mixture composition is to transform the values of the S-ratio into unconstrained real space using the alr. Second, it is important to note that the mineral mixture composition data, wt. per cent of magnetite and haematite, is also closed, that is, it is relative, and the two components must sum to a constant (in this case 100 per cent). Thus it is also necessary to transform the mixture compositions into real space using the alr in the form
The transformed S-ratio and mixture composition data are plotted in
Fig. 1(b) and would appear to be related linearly. A simple least-squares linear regression can be determined with its associated 95 per cent prediction interval (
Fig. 1b). As a final step, these lines can be transformed back into the original sample space to provide a regression line and prediction interval relating the S-ratio to magnetite versus haematite mixture composition (
Fig. 1c). Thus, a simple regression relationship has been derived, which follows the experimental data closely and is based on the fundamental properties of the measured parameter. This must be considered an improvement over some arbitrarily chosen high-order polynomial that while fitting the untransformed S-ratio data closely may have no physical meaning.
4 Discussion
Application of the alr to the S-ratio may seem to be nothing more than statistical fussiness; however, it is hoped that the presented examples demonstrate that when attempting to characterize experimental data in a meaningful manner, it is essential to recognize the sample space within which the data are held and to understand the resulting constraints that must be considered and accounted for during statistical analysis. In the case of the S-ratio, the additive-log-ratio transform provides a framework within which descriptive and more advanced statistics can be determined correctly.
Acknowledgments
I am grateful to U. Frank and N. R. Nowaczyk for providing access to their experimental data. The constructive comments of two anonymous referees helped to improve the manuscript. This work was funded through DFG-Research Center/Cluster of Excellence ‘The Ocean in the Earth System’.
References
,
1982
.
The statistical analysis of compositional data
,
J. R. Stat. Soc. B
,
44
,
139
–
177
.
,
1986
.
The Statistical Analysis of Compositional Data
,
Chapman & Hall
,
London
.
,
1989
.
Measures of location of compositional data sets
,
Math. Geol.
,
21
,
787
–
790
.
,
1992
.
Rock magnetism of Late Neogene and Pleistocene deep-sea sediments: relationship to sediment source, diagenetic processes and sediment lithology
,
J. geophys. Res.
,
97
,
4361
–
4375
.
,
2006
.
Magnetic fabric variations in Mesozoic black shales, Northern Siberia, Russia: possible paleomagnetic implications
,
Tectonophysics
,
418
,
145
–
162
.
,
2004
.
Magnetic studies applied to different environments (soils and stream sediments) from a relatively polluted area in Buenos Aires Province, Argentina
,
Env. Geol.
,
45
,
654
–
664
.
,
2008
.
Mineral magnetic properties of artifical samples systematically mixed from haematite and magnetite
,
Geophys. J. Int.
,
175
,
449
–
461
.
,
2005
.
Alteration of magnetic mineralogy at the sulfate-methane transition: analysis of sediments from the Argentine continental slope
,
Phys. Earth planet. Inter.
,
151
,
290
–
308
.
,
2007
.
Current-scattered (?) detrital remanence directions in the Zn-rich Pennsylvanian Stark black shale, USA
,
Geophys. J. Int.
,
171
,
594
–
602
.
,
2001
.
Coercivity analysis of magnetic phases in sapropel S1 related to variations in redox conditions, including an investigation of the S-ratio.
,
Geophys. Geochem. Geosyst.
,
2
,
.
,
2007
.
What do the HIRM and S-ratio really measure in environmental magnetism?
,
Geophys. Geochem. Geosyst.
,
8
,
.
,
2006
.
EPR stratigraphy applied to the study of two marine sedimentary sections in southwestern Venezuela
,
Phys. Earth planet. Inter.
,
154
,
243
–
254
.
,
2004
.
A mineral magnetic record of Late Quaternary tropical climate variability from Lake Bosumtwi, Ghana
,
Palaeogeog. Palaeoclim. Palaeoeco.
,
215
,
37
–
57
.
,
2007
.
Late Neogene rock magnetic record of climatic variation from Chinese eolian sediments related to uplift of the Tibetan Plateau
,
J. Asian Earth Sci.
,
30
,
324
–
332
.
,
1979
.
An investigation into the source of magnetic minerals in some Finnish lake sediments
,
Earth planet. Sci. Lett.
,
45
,
464
–
474
.
,
1995
.
Introduction to Geological Data Analysis
,
Blackwell Science
,
Oxford, UK
.
,
1986
.
Environmental Magnetism
,
Allen & Unwin
,
London
.
,
2002
.
Quantitative analysis of detrital modes: statistically rigorous confidence regions in ternary diagrams and their use in sedimentary petrology
,
Earth Sci. Rev.
,
57
,
211
–
253
.
© The Authors Journal compilation © 2009 RAS


