


Summary
We develop a self-consistent thermodynamic description of silicate liquids applicable across the entire mantle pressure and temperature regime. The description combines the finite strain free energy expansion with an account of the temperature dependence of liquid properties into a single fundamental relation, while honouring the expected limiting behaviour at large volume and high temperature. We find that the fundamental relation describes well previous experimental and theoretical results for liquid MgO, MgSiO3, Mg2SiO4 and SiO2. We apply the description to calculate melting curves and Hugoniots of solid and liquid MgO and MgSiO3. For periclase, we find a melting temperature at the core-mantle boundary (CMB) of 7810 ± 160 K, with the solid Hugoniot crossing the melting curve at 375 GPa, 9580 K, and the liquid Hugoniot crossing at 470 GPa, 9870 K. For complete shock melting of periclase we predict a density increase of 0.14 g cm−3 and a sound speed decrease of 2.2 km s−1. For perovskite, we find a melting temperature at the CMB of 5100 ± 100 K with the perovskite section of the enstatite Hugoniot crossing the melting curve at 150 GPa, 5190 K, and the liquid Hugoniot crossing at 220 GPa, 5520 K. For complete shock melting of perovskite along the enstatite principal Hugoniot, we predict a density increase of 0.10 g cm−3, with a sound speed decrease of 2.6 km s−1.
1 Introduction
Liquid state thermodynamics have long played a central role in the study of mantle petrology and geochemistry. The chemical history of a terrestrial planet is intimately tied to its thermal history through fractionation processes associated with cooling of a magma ocean and melting of a solid mantle (Ohtani & Sawamoto 1987; Ohtani 1988; Miller et al. 1991b; Agee & Walker 1993; Solomatov & Stevenson 1993). Furthermore, seismic observations suggest the presence of partial melt atop the 410 km discontinuity (Revenaugh & Sipkin 1994; Songet al.1994) and at the base of the mantle (Garnero & Helmberger 1995; Williams & Garnero 1996; Revenaugh & Meyer 1997). Accurate estimates of the solidus temperature of the mantle at those depths can thus provide key constraints on the composition and geothermal profile of the mantle. Decompression melting close to the free surface is responsible for the mafic and ultramafic igneous rocks that, together with mantle xenoliths, provide our most direct chemical observations of the Earth's deep interior. Accurate estimates of the equations of state and phase equilibria of melts constrain the pressures at which melting primarily occurs (McKenzie & Bickle 1988; Asimowet al.1995) and the depth limits from which melts can reach the surface (Stolperet al.1981; Agee & Walker 1988, 1993; Rigdenet al.1989; De Kokeret al.2008).
While the equations of state of many solid mantle phases have been measured to lower mantle pressures (Stixrude & Lithgow-Bertelloni 2005, and references therein), the experimental study of silicate liquids remains challenging, even at low pressures (Lange & Carmichael 1987; Rigdenet al.1989; Lange & Navrotsky 1992; Shen & Lazor 1995; Ai & Lange 2008). First principles molecular dynamics (FPMD) studies (Traveet al.2002; Laudernet et al. 2004; Stixrude & Karki 2005; Karki et al. 2006, 2007; Wan et al. 2007; De Koker et al. 2008; Sun 2008) have recently focused on silicate liquids at pressures and temperatures relevant to the full extent of the Earth's mantle, and revealed rich structural and thermodynamic compressional behaviour. Thermodynamic properties were found to be significantly different from those of solids: the isochoric heat capacity (CV) is generally larger than the high temperature limit seen in solids (3NkB) and varies significantly on compression; the Grüneisen parameter (γ) increases with compression, whereas it always decreases during isostructural compression of solids.
In this study, we develop a self-consistent thermodynamic description of liquid state thermodynamics relevant to silicate liquids at pressures and temperatures characteristic of mantles and magma oceans associated with terrestrial planets. We apply our thermodynamic formalism to the description of FPMD results, using these as a guide to the functional forms and the relevant physics. In addition, we derive an anharmonic fundamental relation for solids at high temperature (i.e. in the classical limit), which we combine with the liquid descriptions to obtain melting curves and theoretical Hugoniot loci for MgO periclase and MgSiO3 perovskite.
2 Previous Work
PVT equations of state were first described for the ideal gas (Boyle 1662; Clapeyron 1834). This equation of state treats particles as independent, and is thus unable to describe the liquid-vapour transition. At high pressures, this relation is commonly applied to stellar interiors (Chandrasekhar 1939; Phillips 1994), but it does not capture the comparative incompressibility of terrestrial materials such as silicate liquids at the conditions characteristic of planetary interiors. Subsequent Van der Waals (van der Waals 1873) and Redlich-Kwong (Redlich & Kwong 1949) equations were formulated to capture critical behaviour and the liquid-vapour transition, but are only valid close to ambient conditions, predicting very incompressible behaviour at higher pressure. Modified Redlich-Kwong forms (Halbach & Chatterjee 1982; Holland & Powell 1991; Brodholt & Wood 1993) address this problem, but require many free parameters to constrain. Similarly, other empirical and semi-empirical forms, developed primarily for interpolation of large data sets of liquid and gas thermodynamic properties (Belonoshko & Saxena 1992; Pitzer & Sterner 1994; Span & Wagner 1997), also require large numbers of free parameters with consequent poor extrapolation and unphysical oscillations in thermodynamic properties. None of these existing forms are thus able to capture the essentials of silicate liquids over a geophysically interesting pressure range with sufficiently few free parameters.
The Thomas-Fermi model (Slater & Krutter 1935; Marshak & Bethe 1940; Feynman et al. 1949) gives an approximate description of the equation of state at very high pressures, based on a simplified model of the electronic charge density. It has been successfully applied to stellar and gas giant interiors, but is too approximate to offer insight into the behaviour of materials within the Earth's interior (Birch 1952; Knopoff & Uffen 1954). In high pressure hydrodynamic simulations these problems are remedied to some extent by the quotidian equation of state (More et al. 1988; Young & Corey 1995), which, however, makes a number of simplifying assumptions, in particular the Dulong-Petit law and the Lindemann law, that have been shown not to hold for silicate melts (Stebbins et al. 1984; Wolf & Jeanloz 1984; Stixrude & Karki 2005; Karki et al. 2007; De Koker et al. 2008).
Experimental studies of the equation of state of silicate liquids have been almost entirely limited to ambient and uppermost mantle pressures (Bottinga 1985; Lange & Carmichael 1987; Agee & Walker 1988, 1993; Courtial et al. 1997; Lange 1997; Ai & Lange 2008), with only a few shock loading and multi-anvil measurements giving insight into the equation of state at pressures characteristic of the lower mantle (Rigden et al. 1984, 1989; Miller et al. 1991a; Chen et al. 2002; Suzuki & Ohtani 2003; Matsukage et al. 2005; Sakamaki et al. 2006; Mosenfelder et al. 2007, 2009). These results have shown that simple polynomial descriptions of P(V, T) or V(P, T) (Ghiorso & Sack 1995) are inadequate at high pressure (Ghiorso 2004). The Birch-Murnaghan equation of state (Birch 1952, 1978) has been widely used (Rigden et al. 1989; Ghiorso et al. 2002; Lange 2003; Suzuki & Ohtani 2003; Matsukage et al. 2005; Sakamaki et al. 2006; Lange 2007), but more high pressure data are needed to test its validity. While the Birch-Murnaghan equation of state and similar forms, such as the Universal equation of state, have been widely and successfully tested against measurements on solids (Jeanloz 1989; Anderson 1995; Cohen et al. 2000), this has not been done for silicate liquids. Indeed, the suitability of the Birch-Murnaghan form has been questioned on a theoretical basis (Hofmeister 1993; Ghiorso 2004).
A key issue which has not been carefully addressed, is the thermal contribution to the liquid equation of state. In describing the temperature and pressure dependence of a material simultaneously, great care must be taken to preserve thermodynamic self-consistency (Dorogokupets 2000; Ghiorso et al. 2002; Pavese 2002; Ghiorso 2004; Ai & Lange 2008). The main goal of the work presented here is to derive a thermodynamic treatment of silicate liquids which self-consistently describes their thermal and compressional behaviour.
3 Fundamental Thermodynamic Relations
By deriving all the equilibrium thermodynamics from a single function, self-consistency among properties is guaranteed through Maxwell relations.
3.1 Liquids

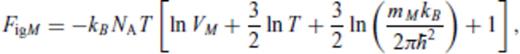
3.1.1 Atomic momentum contribution
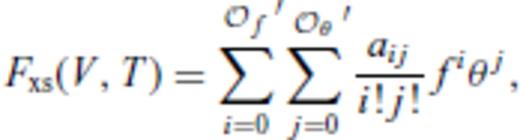
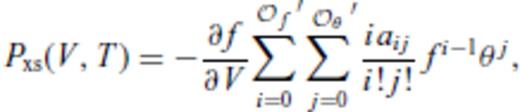
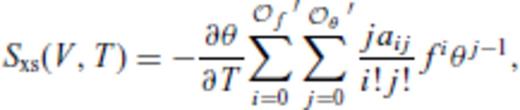
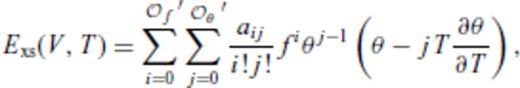
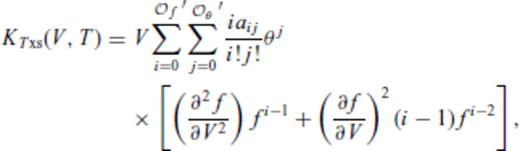
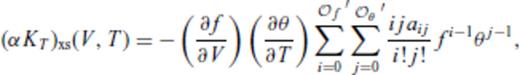
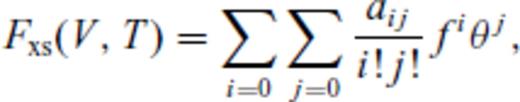
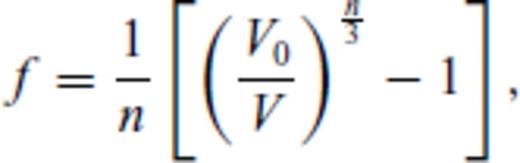
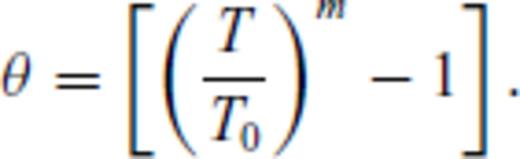
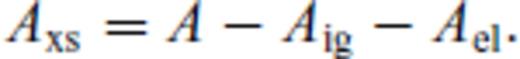
3.1.2 Excess contribution
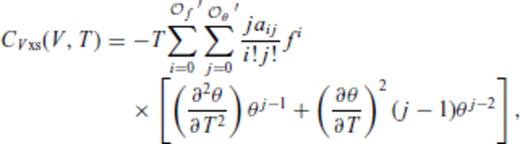
 and
and  , and primes on sums indicate that
  must be satisfied.
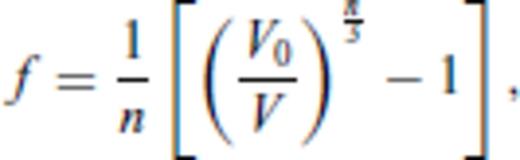
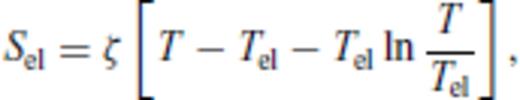
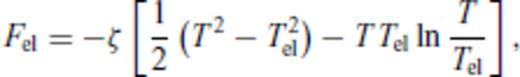
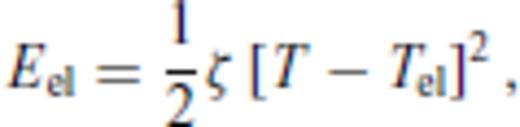
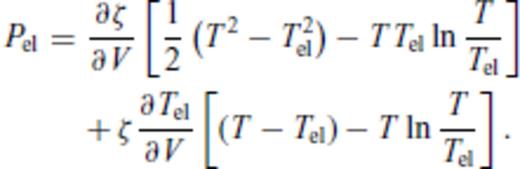
3.1.3 Thermal electronic contribution

3.1.4 Limiting behaviour
The liquid relation is designed such that the infinite temperature and volume limits capture the expected material properties at those conditions, given suitable values of n and m. Limiting values of the excess properties, derived from eqs (17)–(22) are summarized in Table 1. Total values follow from addition of ideal gas, excess and thermo-electronic terms, with the exception of the Grüneisen parameter which is not additive.
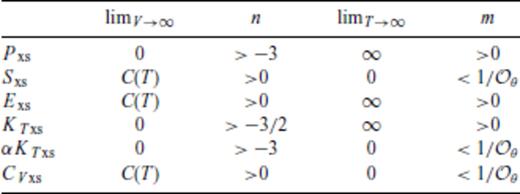
Theoretical behaviour of excess thermodynamic properties in the limit of an ideal gas, and values of n and m such that these limits hold. C(T) denotes a limiting value which depends only on T.
Furthermore, the non-electronic portion of the liquid relation captures the physics of the liquid-vapour transition at moderately high volumes, although the power-law parametrization of volume dependence in the thermo-electronic contribution does not capture the limiting behaviour of Fel as V→∞.
3.2 Solids at high temperature


4 First Principles Molecular Dynamics Simulations
To test the solid and liquid fundamental relations, we use FPMD simulation results for MgO periclase, MgSiO3 perovskite (Stixrude & Karki 2005), as well as liquid MgO (Karki et al. 2006), MgSiO3 (Stixrude & Karki 2005), Mg2SiO4 (De Koker et al. 2008) and SiO2 (Karki et al. 2007). With the application to shock melting in mind, we supplement the MgSiO3 and MgO liquid data of Stixrude & Karki (2005) and Karki et al. (2006) at high pressures. These systems are melted at higher temperatures (8000 and 15 000 K, respectively), and then cooled isochorically as in previous calculations. Mg2SiO4 and MgSiO3 liquid simulations at 2000 K are also added to improve constraints at ambient pressure. We therefore have simulations spanning a range of compression of V/VX = 0.35– 1.20, where VX is an experimental estimate of the liquid volume at ambient conditions.
Our computational technique is described in detail in our previous work, and we only highlight a few salient points here. FPMD simulations based on Density Functional Theory (DFT, Hohenberg & Kohn 1964; Kohn & Sham 1965) are performed as implemented in the VASP plane-wave code (Kresse & Furthmüller 1996), using pseudo-potentials (Kresse & Hafner 1994), the local density approximation (LDA, Ceperley & Alder 1980) and a single k-point at the Brillouin zone centre (Γ). Systems consist of 64 (MgO liquid and periclase), 112 (Mg2SiO4 liquid), 80 (MgSiO3 liquid and perovskite) and 72 atoms (SiO2 liquid) in a periodic simulation cell. The cell is cubic for liquid simulations, with solid cell dimensions adjusted to obtain a hydrostatic stress tensor. Simulations are performed in the canonical ensemble (constant NVT) through the use of a thermostat (Nosé 1984). We use a time increment of 1.0 fs and run durations of at least 3000 fs, sufficient for converged values of the pressure and internal energy, the mean values of which are obtained using the blocking method (Flyvberg & Petersen 1989).

Because atomic motion in molecular dynamics simulations is entirely classical at all temperatures (Allen & Tildesley 1987; Frenkel & Smit 1996), energy values do not capture the quantum effects characteristic of atomic vibrations at low temperature in solids, and are thus only physical in the limit of high temperatures. Quantum corrections can be applied (Wigner 1932; Kirkwood 1933; Matsui 1989), but our interest here is in solids close to melting where such corrections will be negligible.

5 Determination Of Parameters


To perform the fit for the liquid, the order to which the excess free energy needs to be expanded must be determined and n and m specified. Considering its overwhelming success in fitting and extrapolating high pressure equations of state, we adopt the Eulerian finite strain in our description for melts as well, that is, we use n = 2. Similarly, the correct limiting behaviour as T→∞ requires m < 1 for  and m < 1/2 for
  . A unique value of m is determined for each composition within the constraints required by the value of
  required to fit the data.
6 Results
6.1 Liquids
Consistent with the conclusions in the original studies, we find that MgO, Mg2SiO4 and MgSiO3 liquid equations of state are sufficiently described with a third-order finite strain expansion ( ), while SiO2 requires a fifth-order expansion (
 ) (Figs 1–4). Values of m that optimize the first (
 ) and second (
 ) order fits to the FPMD data, are noted in Table 2. Our preferred models are those where our FPMD results can be accurately represented with the smallest number of free parameters.
  yields accurate fits for MgO, Mg2SiO4 and MgSiO3 (Figs 1–3), but is insufficient for SiO2 (Fig. 4) where high temperature low density points are poorly modelled. These discrepancies are remedied using
  , with the SiO2 fit significantly further improved by excluding the T = 6000 K, V/VX = 0.8, 0.9 and 1.0 points (white circles in Fig. 4). These points are at pressures below 15 GPa, where 6000 K is of less geophysical importance. Therefore, our preferred model for SiO2 is
  , which precludes extrapolation for this composition.
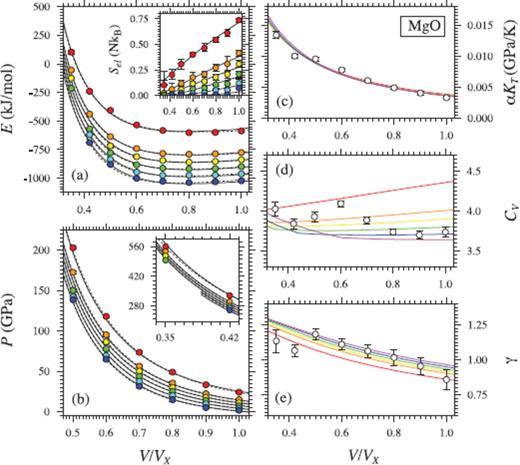
(a) Internal energy (E), (a, inset) thermal electronic entropy (Sel), (b) Pressure (P), (c) thermal pressure coefficient (αKT), (d) isochoric heat capacity (CV) and (e) Grüneisen parameter (γ) of MgO liquid. Coloured circles in (a) and (b) show values from FPMD simulations at 3000 K (blue), 4000 K (cyan), 5000 K (green), 6000 K (yellow), 7000 K (orange) and 10000 K (red) (Karki et al. 2006, except for points at V/VX = 0.35 and V/VX = 0.42). Black lines indicate the fit of P and E to eq. (16) with  (solid lines; first order in T, see text) and
  (dashed lines; second order in T, see text), and a third-order expansion in finite strain. Errorbars are smaller than the size of the symbols. Black lines in (a, inset) indicates the fit to eq. (30). Lines in (c), (d) and (e) are second derivatives of the fundamental relation, coloured by temperatures as the symbols in (a) and (b). These lines follow the trend previously found (Karki et al. 2006) by independent linear fits of FPMD results along each simulated isochore (white symbols), but it should be kept in mind that these points represent mean values over a large temperature range, which is not thermodynamically self-consistent, and may also be off due to the glass transition.

Same as Fig. 1, but for Mg2SiO4 liquid. Coloured circles in (a) and (b) show values from FPMD simulations at 2000 K (purple), 3000 K (blue), 4000 K (green) and 6000 K (red) (De Koker et al. 2008, except for points at 2000 K). Black lines indicate the fit of P and E to eq. (16) with  (solid lines) and
  (dashed lines), and a third-order expansion in finite strain. White symbols in (c), (d) and (e) are the mean values from (De Koker et al. 2008).
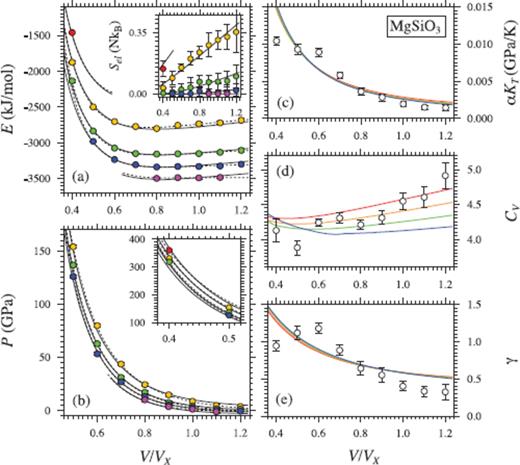
Same as Fig. 2, but for MgSiO3 liquid. Coloured circles in (a) and (b) show values from FPMD simulations at 2000 K (purple), 3000 K (blue), 4000 K (green), 6000 K (yellow) and 8000 K (red) (Stixrude & Karki 2005, except for points at 2000 K and at V/VX = 0.4). Black lines indicate the fit of P and E to eq. 16 with  (solid lines) and
  (dashed lines), and a third-order expansion in finite strain. White symbols in (c), (d) and (e) are the mean values from (Stixrude & Karki 2005).
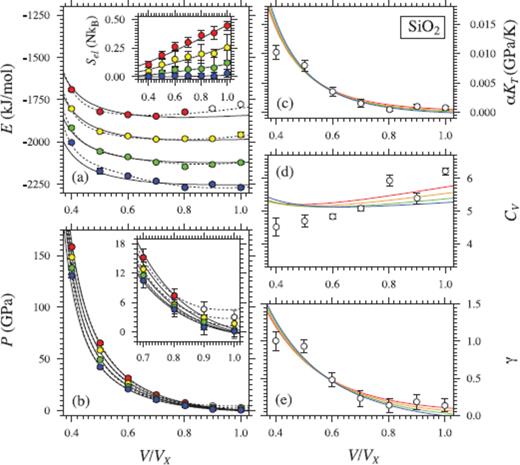
Same as Fig. 3, but for SiO2 liquid. Coloured circles in (a) and (b) show values from FPMD simulations at 3000 K (blue), 4000 K (green), 5000 K (yellow) and 6000 K (red, white) (Karki et al. 2007). Black lines indicate the fit of P and E to eq. (16) with  (solid lines) and
  (dashed lines), and a fifth-order expansion in finite strain. Lines in (c), (d) and (e) are second derivatives of the
  fundamental relation. White symbols in (c), (d) and (e) are the mean values from, and may be off due to the glass transition (Karki et al. 2007).
m values used in liquids Fxs fits.
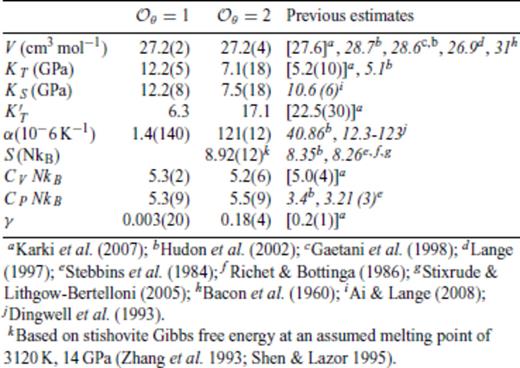
Thermodynamic properties at ambient pressure for the respective liquids are compared to previous experimental and theoretical estimates in Tables 3–6. Only partial molar experimental data for MgO liquid is available, and we mostly compare to previous theoretical estimates. Equation of state parameters differ slightly from those of Karki et al. (2006), because all the data are used in obtaining the equation of state fit. Values determined from  and 2 are very similar;
  is sufficient to model the data. The added simulations at 2000 K for Mg2SiO4 and MgSiO3 enable us to draw a direct comparison to experimental data collected at
  and 2 results are again very similar, and
  is sufficient to model the results. As with MgO, the 3000 K equation of state parameters parameters of SiO2 also differ somewhat from those obtained by Karki et al. (2007). Notable discrepancies with α, CV and CP likely result from the large thermal extrapolation of experimental data. As noted before,
  is not sufficient to represent the SiO2 data; indeed
  and 2 results are rather different. Uncertainties in each thermodynamic property is estimated by repeated fitting to a Monte Carlo perturbation of the simulation data, constrained by its error estimates. As shown in Figs 1–4,
  fundamental relations yield αKT, γ and CV values similar to those obtained by (inconsistent) isochoric linear fits, and are well behaved upon extrapolation. In contrast, for
  these properties do not extrapolate well.
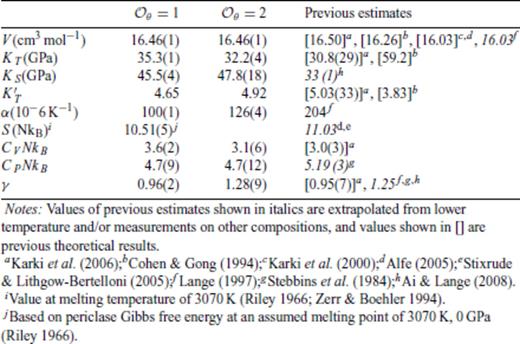
Thermodynamic properties of FPMD MgO liquid at 0 GPa, 3000 K.
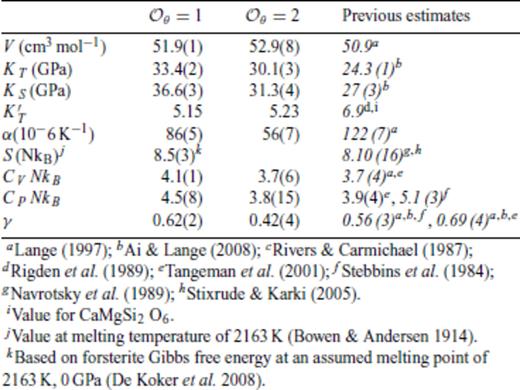
Thermodynamic properties of FPMD Mg2SiO4 liquid at 0 GPa, 1773 K.

Thermodynamic properties of FPMD MgSiO3 liquid at 0 GPa, 1773 K.
Thermodynamic properties of FPMD SiO2 liquid at 0 GPa, 3000 K.
The ability of the liquid relation to capture the thermodynamics of the liquid-vapour transition is illustrated by extrapolating the Mg2SiO4 6000 K isotherm to very large volumes (Fig. 5). We ignore the thermal electronic contribution here, as it will vanish at such large volumes.
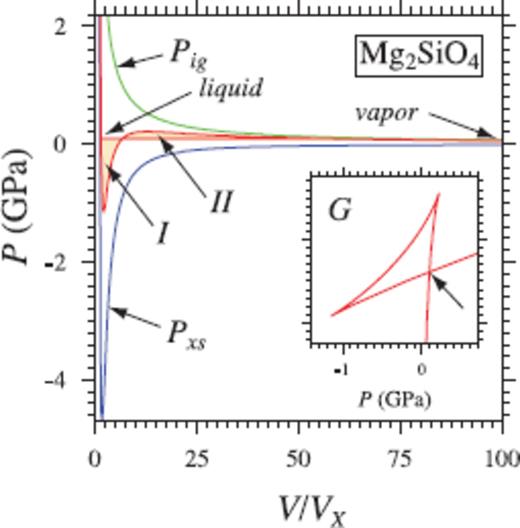
Thermodynamics of vapourization in Mg2SiO4 liquid. Eq. (16) also captures the thermodynamics of vapourization, as illustrated by extrapolation of the 6000 K isotherm in Mg2SiO4. The pressure of liquid-vapour coexistence (0.09 GPa; horizontal red line) is found from the triplication in G (arrow in inset), or equivalently from the Maxwell equal area construction (area I = area II). The resulting heat of vapourization (1130 kJ mol−1) is comparable to the heat of vapourization of forsterite used in giant impact studies (Benz et al. 1989; Canup 2004).
6.2 Solids
A third-order finite strain expansion is sufficient to fit the periclase simulations up to a compression ratio of V/VX = 0.45, but we find that a fourth-order expansion is required to account for the points at higher pressures (Fig. 6). As found by Stixrude & Karki (2005), a third-order finite strain expansion is sufficient to fit the perovskite results, including the added data points at V/VX = 0.4 (Fig. 7).
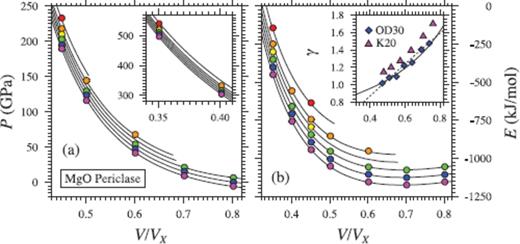
(a) Pressure (P), (b) internal energy (E) and (c) Grüneisen parameter (γ) of MgO periclase. Coloured circles show values from FPMD simulations at 2000 K (purple), 3000 K (blue), 4000 K (green), 5000 K (yellow), 6000 K (orange) and 8000 K (red). Black lines in (a) and (b) indicate the fit of eq. (35), with a fourth-order expansion in finite strain required to account for the points at V/VX = 0.35 (left inset). Errorbars are smaller than the size of the symbols. Grüneisen parameter represented with eq. (46) (solid line) gives a superior fit to eq. (49) when compared to previous estimates (K20 –Karki et al. (2000), γ at 2000 K from lattice dynamics; OD30 –Oganov & Dorogokupets (2003), FPMD at 3000 K).
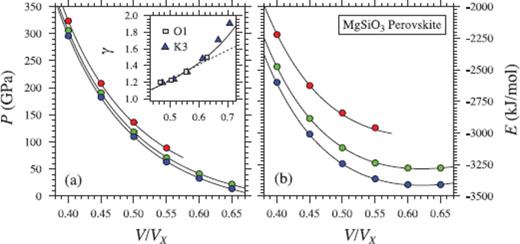
Same as Fig. 6, but for MgSiO3 perovskite. Coloured circles show values from FPMD simulations at 3000 K (blue), 4000 K (green) and 6000 K (red). Black lines in (a) and (b) indicate the fit of eq. (35), with a third-order expansion in finite strain. K3 –Karki et al. (2000), γ at 3000 K from lattice dynamics; O1 –Oganov et al. (2001), FPMD at 1000 K.
For periclase and perovskite, thermodynamic parameters at ambient pressure and reference temperature compare favourably with values from experiment and previous theoretical calculations (Tables 7 and 8). As previously concluded by Stixrude & Lithgow-Bertelloni (2005), we find the representation of γ(V) using eq. (46) to give a superior comparison to previous theoretical estimates (insets in Figs 6 and 7).
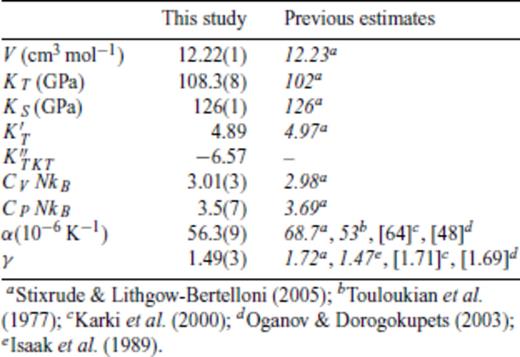
Thermodynamic properties of FPMD MgO periclase at 0 GPa, 2000 K.
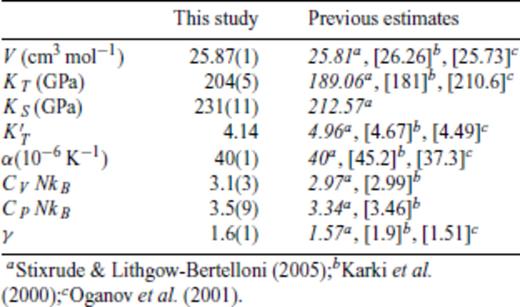
Thermodynamic properties of FPMD MgSiO3 perovskite at 0 GPa, 2000 K.
7 Applications
To illustrate the power of our method, we compute ambient pressure thermodynamic properties as well as high pressure melting curves and Hugoniots for MgO periclase and MgSiO3 perovskite (orthoenstatite unshocked state), and the corresponding liquid phases. Our aim is to obtain a direct comparison of our simulation results to a broad range of low pressure measurements and high pressure shock loading data and make predictions of trends to expect where measurements have not yet been made.
Melting curves are obtained by finding the loci of pressure and temperature where solid and liquid Gibbs free energies correspond. As we use a reference melting temperature to constrain the liquid free energy from that of the solid, this approach is equivalent to integration of the Clapeyron equation, with integration done analytically rather than numerically.
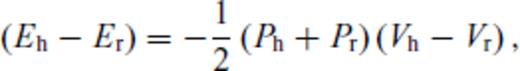
Because internal energy and volume (density) are the natural thermodynamic variables along the Hugoniot, a first-order phase transition, such as univariant melting, occurs over a range of pressure-temperature conditions (Callen 1985). With increasing pressure, the Hugoniot intersects the melting curve, follows the melting curve for a finite interval of pressure along which the fraction of liquid increases, and then departs from the melting curve as the solid phase is exhausted. The liquid fraction along the melting portion of the Hugoniot is found by solving eq. (57) for a mechanical mixture of liquid and solid. Experiments may depart from this equilibrium picture due to kinetic effects including superheating (Luo 2003).

Our periclase melting curve differs only by a small degree from the previous first principles estimate of Alfe (2005) using FPMD simulation of direct phase coexistence in the LDA (Fig. 8). Both these curves are in general agreement with previous non-first principles theoretical estimates of the melting of periclase at high pressure (Cohen & Gong 1994; Vočadlo & Price 1996; Belonoshko & Dubrovinsky 1996; Cohen & Weitz 1998; Strachan et al. 2001), and are intermediate between the experimental determination of Zerr & Boehler (1994) and the compositional extrapolation of Zhang & Fei (2008). The slope remains positive over the entire pressure range considered.
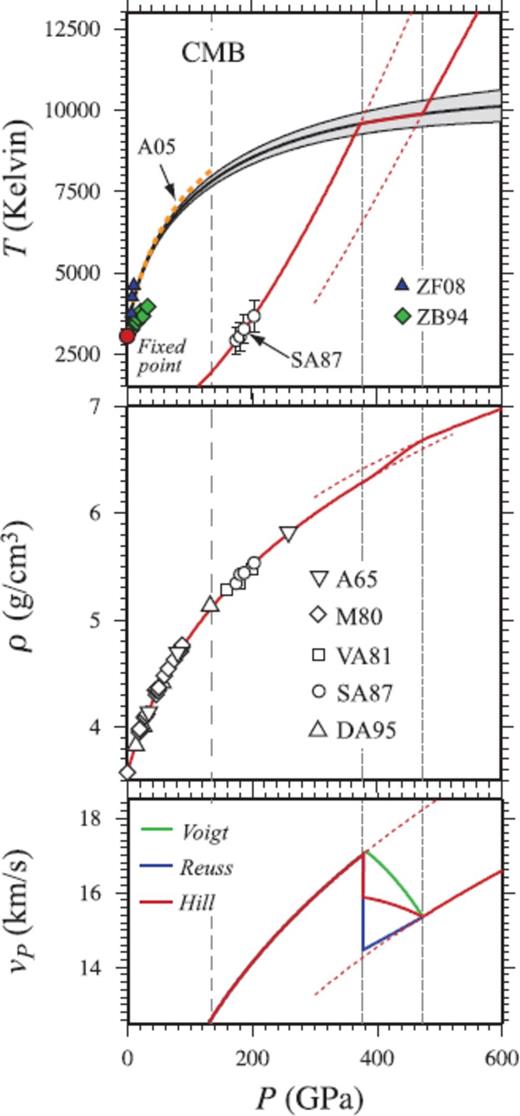
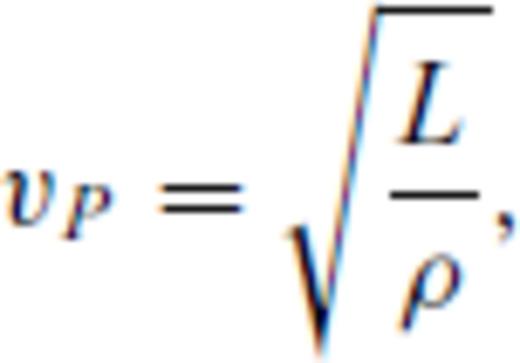
Shock melting of MgO periclase. (top panel) FPMD melting curve of periclase with uncertainty given by grey envelope. Melting temperature at the CMB is 7810 ± 160 K. Direct coexistence simulation using FPMD in the LDA of Alfe (2005) (A05; orange dotted line), and experimental measurements of Zhang & Fei (2008) (ZF08) and Zerr & Boehler (1994) (ZB94) shown for comparison. The solid Hugoniot crosses the melting curve at 375 GPa, 9580 K, and the liquid Hugoniot crosses at 470 GPa, 9870 K (faint dotted lines). In between these points the equilibrium Hugoniot follows the melting curve. Metastable Hugoniot sections are shown as broken lines. SA87-shock temperature measurements of Svendsen & Ahrens (1987) (middle panel). Pressure-density Hugoniot, compared with experimental shock measurements of Al'tshuler et al. (1965) (A65), Marsh (1980) (M80), Vassiliou & Ahrens (1981) (VA81), Svendsen & Ahrens (1987) (SA87) and Duffy & Ahrens (1995) (DA95). Complete shock melting is predicted to result in a ∼0.14 g cm−3 density increase along the Hugoniot, even though no density crossover is present along the melting curve. (bottom panel) Compressional wave velocity (vP) of the liquid is 2.2 km s−1 slower than that of the solid calculated along the FPMD periclase Hugoniot using experimental estimates of the shear modulus from Stixrude & Lithgow-Bertelloni (2005) (SLB05). Coloured lines in insipient melting section of Hugoniot represent the Voigt and Reuss bounds and the Hill average (Watt et al. 1976, see text).
The FPMD periclase Hugoniot agrees very well with the measured pressure-density Hugoniot (Marsh 1980; Vassiliou & Ahrens 1981; Svendsen & Ahrens 1987; Duffy & Ahrens 1995), as well as with the temperature measurements of Svendsen & Ahrens (1987). The periclase Hugoniot crosses the melting curve at P = 375 GPa, T = 9580 K, with the liquid phase periclase Hugoniot crossing the melting curve at P = 470 GPa, T = 9870 K. Complete shock melting is predicted to result in a ∼0.14 g cm−3 density increase and a 2.2 km s−1 sound velocity decrease along the Hugoniot.
The pressures at which we predict shock melting along the principal Hugoniot of periclase are very high, and beyond the current reach of shock wave experiments employing gas guns. However, shock melting can be achieved by using porous or pre-heated unshocked samples. We thus also calculate the shock melting interval for a number of pre-heated and porous starting materials (Tables 9 and 10).
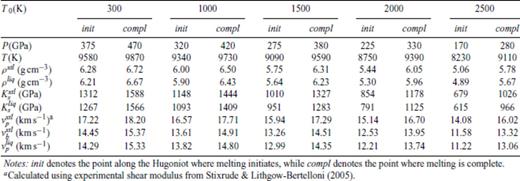
Shock melting elastic properties of MgO periclase shocked from periclase pre-heated to T0 at 0 GPa.
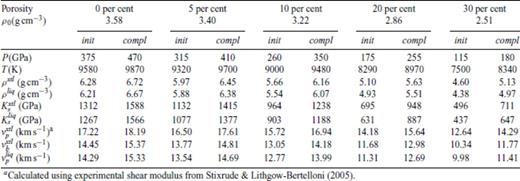
Shock melting elastic properties of MgO periclase shocked from porous periclase at 0 GPa, 300 K.
Our perovskite melting curve (Fig. 9) is slightly different from the result of Stixrude & Karki (2005), as a result of the larger range of data used and the self-consistency imposed on the empirical correction for the overbinding of the LDA. The curve is somewhat colder than the measurements of Zerr & Boehler (1993) and Shen & Lazor (1995), though warmer than the experimental measurements of Knittle & Jeanloz (1989), Heinz & Jeanloz (1987) and Sweeney & Heinz (1998), as well as the result of Stixrude & Bukowinski (1990a). The Clapeyron slope remains positive over the entire pressure range considered.
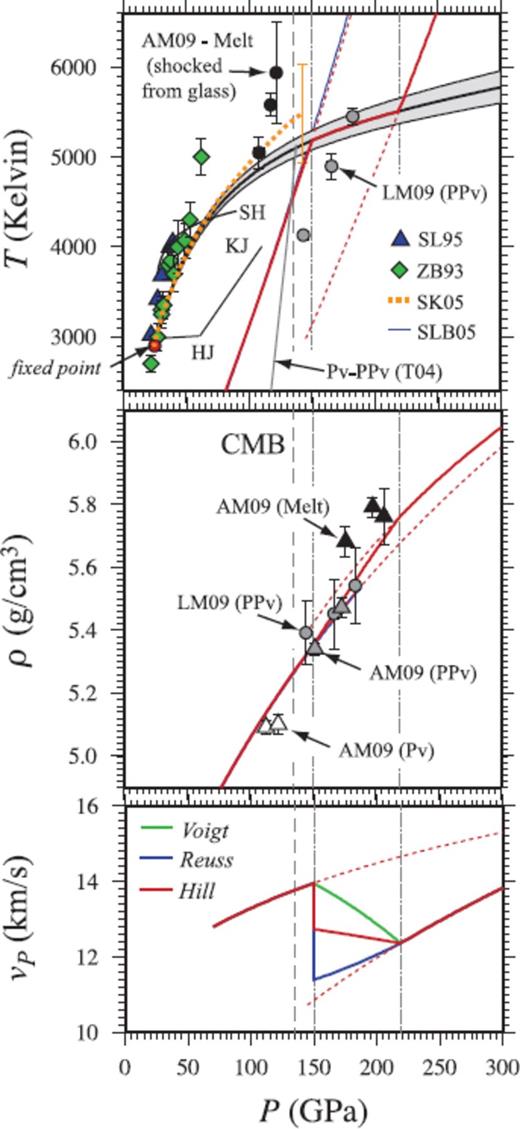
Same as Fig. 8, but for MgSiO3 perovskite. (top panel) Melting temperature at the CMB is 5100 ± 100 K, which is within the uncertainty of the result of Stixrude & Karki (2005) (SK05; red dotted line). Experimental melting measurements are shown for Heinz & Jeanloz (1987) (HJ), Knittle & Jeanloz (1989) (KJ), Sweeney & Heinz (1998) (SH), Zerr & Boehler (1993) (ZB93), and Shen & Lazor (1995) (SL95), together with orhtoenstatite Hugoniot for perovskite calculated using the model of Stixrude & Lithgow-Bertelloni (2005). The solid Hugoniot crosses the melting curve at 150 GPa, 5190 K, and the liquid Hugoniot crosses at 220 GPa, 5520 K (faint dotted lines). LM09 and AM09-shock temperature measurements for enstatite of Luo et al. (2004) and Akins et al. (2004), respectively, reassessed by Mosenfelder et al. (2009). T04 –Tsuchiya et al. (2004). (middle panel) Pressure-density Hugoniot, compared with experimental shock measurements. Complete shock melting is predicted to result in a ∼0.10 g cm−3 density increase along the Hugoniot. (bottom panel) Compressional wave velocity (vP) of the liquid is 2.6 km s−1 slower than that of the solid calculated along the FPMD perovskite Hugoniot using experimental extimates of the shear modulus Stixrude & Lithgow-Bertelloni (2005) (SLB05).
The FPMD perovskite component of the enstatite principal Hugoniot compares well with the measured pressure-density Hugoniot (Akins et al. 2004) points at 149 and 170 GPa, but is notably warmer than the temperature measurements of Luo et al. (2004). The perovskite Hugoniot crosses the melting curve at P = 150 GPa, T = 5190 K, with the liquid phase Hugoniot crossing the melting curve at P = 220 GPa, T = 5520 K. Complete shock melting is predicted to result in a ∼0.10 g cm−3 density increase and a 2.6 km s−1 sound velocity decrease along the Hugoniot. Shock melting interval for a number of pre-heated and porous starting samples (orhtoenstatite) are shown in Tables 11 and 12.
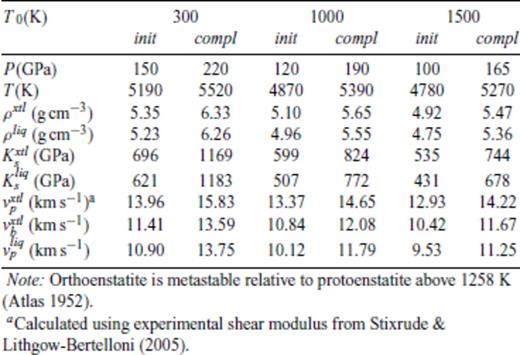
Shock melting elastic properties of MgSiO3 perovskite, shocked from orthoenstatite pre-heated to T0 at 0 GPa.
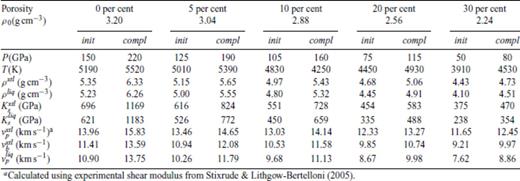
Shock melting elastic properties of MgSiO3 perovskite, shocked from porous orthoenstatite at 0 GPa, 300 K.
8 Discussion
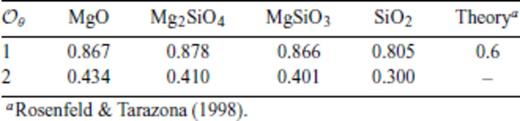
 ), optimal values of m are remarkably similar for all four compositions considered. However, our results show that for
  these optimal values differ notably from the value of m = 3/5 expected theoretically for dense, simple liquids (Rosenfeld & Tarazona 1998). To see this, note that the internal energy expression derived from our liquid fundamental relation (eq. 26) is equivalent to the expression of (Rosenfeld & Tarazona 1998) for
  and m = 3/5
 breaks down in the case of SiO2 which requires
  to accurately represent the FPMD results.
Our findings contrast those of previous semi-emprical MD studies of SiO2, MgSiO3 and Mg2SiO4 liquids (Saika-Voivod et al. 2001; Ghiorso et al. 2006; Martin et al. 2006), in which eq. (62) was assumed to hold for individual isochores, and highlight the importance of determining the interatomic forces in situ from the electronic structure of the liquid.
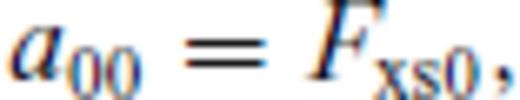
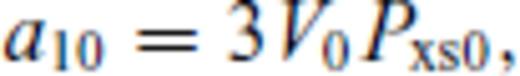
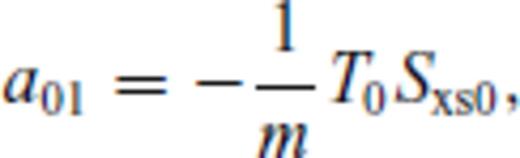
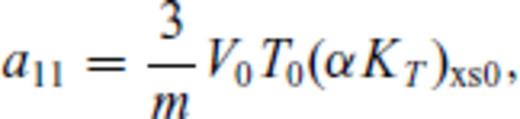
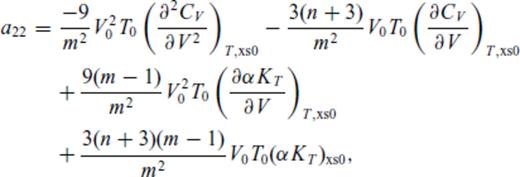
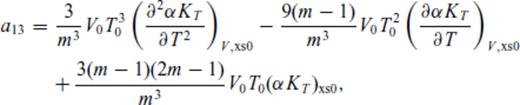
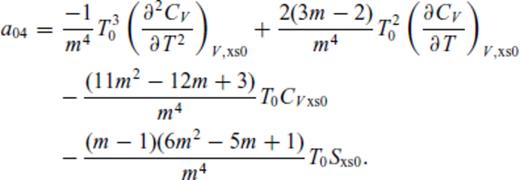
 : the relationships between the coefficients a00, a10, a20, a30, a01, a11, a21 and m (eq. 16), and the thermodynamic properties F0, V0, K0, K′0, S0, αKT0 and (dαKT0/dV)T,0 are presented in the Appendix. While we have chosen to constrain parameters with the values of E and P computed from FPMD simulations, we note that experimental data could also be used to constrain the fundamental relation. Indeed, the procedure for constraining parameters using dynamic compression experimental data would be very similar to what we have outlined here as the measured quantities on the Hugoniot are also E and P. Hugoniot data could be supplemented by precise measurements at low pressure, and thermochemical measurements of the heat capacity and entropy of the liquid at the ambient melting point might be used to constrain the value of m via
 . We further note that the constraints on the value of m dictates that Sxs0 < 0, that is, the total entropy of the liquid is less than that of the ideal gas. This order of fit appears to be sufficient for the silicate liquids we have studied to date with the exception of pure silica liquid. For pure silica liquid,
  may be adequate for many applications, but is not sufficient to represent our FPMD results over the entire volume-temperature range that we have explored. We have found that fits with
  , which contain a much larger number of free parameters, appear to produce unphysical extrapolation outside of the fitted range, unlike those with
  , which extrapolate physically to well beyond the fitted range.
The theoretical suitability of a Eulerian finite strain expansion for use with highly compressible materials such as silicate liquids has been questioned (Ghiorso et al. 2002; Ghiorso 2004; Hofmeister 1993). The two main concerns that have been cited, are firstly that analytical interatomic potentials derived from the Birch-Murnaghan equation of state predict non-physical effects for K′0 > 6 (Hofmeister 1993), and secondly that the equation allows liquid bulk moduli to vanish at large volumes. Experimental and theoretical results for silicate liquids show K′0 values to vary from around 5 to as high as 12 (Rigden et al. 1989; Lange 2003; Stixrude & Karki 2005; Karki et al. 2007; Lange 2007; Ai & Lange 2008; De Koker et al. 2008; Sun 2008). These high values reflect the ability of silicate liquids to access structural compression mechanisms not available to solids, such as changes in coordination (Williams & Jeanloz 1988) and ring statistics (Stixrude & Bukowinski 1990b), which enable liquids to become very compressible at high temperature and low density. The Hofmeister (1993) prediction only applies to simple ionic compounds, in which only the bond length is altered upon compression, and is therefore not relevant to silicate liquids. The second concern cited is, in fact, an asset of the finite strain expansion. When combined with an ideal gas term, as we have done, the relation shows a Van der Waals loop (Fig. 5), and thus also captures the thermodynamics of the liquid-vapour transition.


The relation for solids works well over the large range of pressure and temperature we consider, though the absence of a quantum correction requires caution in comparison with experimental equation of state data below the Debye temperature. The requirement of a fourth-order finite strain expansion for periclase is primarily due to the very large pressures attained in the smallest volume considered (V/VX = 0.35). The relation requires only six (seven for periclase) free parameters, and can therefore be extrapolated to higher temperatures and pressures with reasonable confidence.
The agreement with experiment of the theoretical periclase Hugoniot derived from our fundamental relation is very encouraging, and attests to the accuracy of FPMD at very high pressure and temperature, as well as to the utility of our method for modelling such information self-consistently. Agreement with pressure-density Hugoniot data for perovskite is good (Akins et al. 2004; Luo et al. 2004; Mosenfelder et al. 2009), but no comparison with shock temperature measurements is possible as existing measurements are believed to correspond to the post-perovskite phase (Luo et al. 2004; Mosenfelder et al. 2009). We note that a Hugoniot obtained using the thermodynamic model of Stixrude & Lithgow-Bertelloni (2005), which is constrained by a variety of non-dynamic experimental data is very similar to our FPMD Hugoniot. Furthermore, our melting curve is consistent with shock temperature measurements for MgSiO3 glasses, believed to correspond to the molten phase (Luo et al. 2004; Mosenfelder et al. 2009). While the discrepancy between the density increase along the Hugoniot upon melting predicted by theory and that observed in experiment (Akins et al. 2004; Mosenfelder et al. 2009) is somewhat troubling, these three inferred liquid points are at pressures smaller than that at which we find the theoretical liquid Hugoniot to cross the melting curve, and are likely only partially molten.
The fact that the liquid Hugoniot is at a larger density than that of the solid in both periclase as well as perovskite should not be confused with a density crossover. The larger liquid Hugoniot density results simply due to thermal contraction as heat is absorbed during melting. Indeed, along the melting curves the densities of periclase and perovskite remain larger than that of the respective coexisting liquids, as reflected by the positive Clapeyron slopes. Our analyses show that computed Hugoniots and melting curves are insensitive to the choice of the reference melting point. An error in the assumed reference melting point translates into errors in computed high pressure Hugoniot and melting temperatures that are almost identical in magnitude. This is an important justification of our approach as low pressure melting properties are almost always more precisely known than the high pressure melting curves and Hugoniots that are our primary interest.
9 Conclusion
By extending the finite strain description of materials at high pressure of Birch (1952, 1978) to account for the thermal free energy contribution, we have constructed a thermodynamic description of silicate liquids that is self-consistent and requires relatively few free parameters. Application of this relation to silicate liquids simulated by FPMD reveals that the effect of excited electronic states cannot be ignored in these materials at temperatures well above that of melting, and that existing theoretical predictions for the temperature dependence of the liquid free energy fail for silicate liquids at high temperature.
Of particular geophysical interest is the melting of mantle minerals at deep lower mantle pressures, most readily achieved in shock loading experiments. Shock melting may be identified by large changes in the temperature, discontinuities in density, and a marked decrease in the sound velocity of the shocked state measured along the Hugoniot. We are able to apply the thermodynamic description to obtain melting curves and Hugoniot loci for perovskite and periclase, compare to existing shock loading measurements and make quantitative predictions of each of the melting criteria. The agreement of the theoretical Hugoniots derived from our fundamental relation attests both to the accuracy of FPMD at very high pressure and temperature, and to the utility of our method for modelling such information self-consistently.
Acknowledgments
This research was supported by the National Science Foundation under Grants EAR-0409074 and EAR-0409121, and in part by the European Commission under contract MRTN-CT-2006-035957. Computing facilities were provided by the Center for Computation and Technology at Louisiana State University and by the Center for Advanced Computing at the University of Michgan. We thank P. D. Asimow and an anonymous reviewer for helpful comments on the manuscript.
References
Appendix
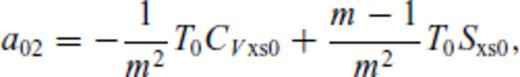
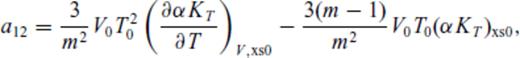
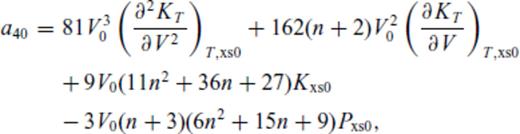
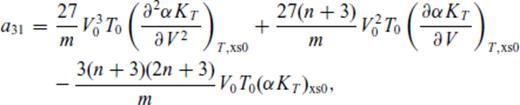
Appendix A: Coefficients Of ![graphic]() In The Liquid Fundamental Relation
In The Liquid Fundamental Relation


Author notes
Now at: Bayerisches Geoinstitut, University of Bayreuth, Germany
