


Abstract
Evolutionary theories of ageing predict a reduction in selection efficiency with age, a so-called “selection shadow,” due to extrinsic mortality decreasing effective population size with age. Classic symptoms of ageing include a deterioration in transcriptional regulation and protein homeostasis. Understanding how ant queens defy the trade-off between fecundity and lifespan remains a major challenge for the evolutionary theory of ageing. It has often been discussed that the low extrinsic mortality of ant queens, that are generally well protected within the nest by workers and soldiers, should reduce the selection shadow acting on old queens. We tested this by comparing strength of selection acting on genes upregulated in young and old queens of the ant, Cardiocondyla obscurior. In support of a reduced selection shadow, we find old-biased genes to be under strong purifying selection. We also analyzed a gene coexpression network (GCN) with the aim to detect signs of ageing in the form of deteriorating regulation and proteostasis. We find no evidence for ageing. In fact, we detect higher connectivity in old queens indicating increased transcriptional regulation with age. Within the GCN, we discover five highly correlated modules that are upregulated with age. These old-biased modules regulate several antiageing mechanisms such as maintenance of proteostasis, transcriptional regulation, and stress response. We observe stronger purifying selection on central hub genes of these old-biased modules compared with young-biased modules. These results indicate a lack of transcriptional ageing in old C. obscurior queens, possibly facilitated by strong selection at old age and well-regulated antiageing mechanisms.
Significance
Understanding the exceptional longevity of ant queens and how they defy the trade-off between fecundity and lifespan remains a major challenge for the evolutionary theory and molecular biology of ageing. In this study, we offer several clues as to how this occurs on a molecular level in Cardiocondyla obscurior queens. Specifically, we believe a reduction in the selection shadow due to low extrinsic mortality, has allowed the evolution of well-regulated antiageing mechanisms. Consequently, we suggest several promising starting points for future research into the poorly understood phenomenon of extreme longevity in ant queens. Making progress in this field will not only allow us to better understand longevity and fertility in social insects but may also offer interesting research strategies for human ageing.
Introduction
Ageing, the progressive decline of physiological function with age, and thus of survival and fertility, is common to most multicellular species (Jones et al. 2014). Extensive genetic and molecular studies have illuminated several proximate mechanisms involved in the ageing process, allowing us to better understand how we age. The majority of these “hallmarks of ageing” can be attributed to the accumulation of cellular damage (Gems and Partridge 2013; López-Otín et al. 2013) and an overall deterioration of regulation (Frenk and Houseley 2018). One important hallmark of ageing, the loss of protein homeostasis, is caused by a reduction in quality control mechanisms such as chaperones that support correct folding and structure of proteins, as well as proteolytic pathways that ensure the removal of misfolded peptides (Calderwood et al. 2009; Koga et al. 2011; Rubinsztein et al. 2011; Tomaru et al. 2012; López-Otín et al. 2013). The result is an accumulation of toxic, misfolded proteins and an inefficient replenishment of correctly functioning proteins. Further hallmarks of ageing include deleterious changes in terms of cell cycle (a cessation of cellular replication), intercellular communication, nutrient sensing, and epigenetic regulation (López-Otín et al. 2013), as well as a downregulation of mitochondrial and protein synthesis genes (Frenk and Houseley 2018). Importantly, the ageing process is often accompanied by a dysregulation of transcription (Frenk and Houseley 2018).
Several classic evolutionary theories of ageing aim to explain why organisms age (Kirkwood and Austad 2000; Flatt and Partridge 2018). These theories generally describe a reduction in selection efficiency with increasing age because the number of surviving individuals decreases due to extrinsic mortality. In the mutation accumulation theory, this “selection shadow” leads to an accumulation of mutations which have a deleterious effect later in life (Kirkwood and Austad 2000; Flatt and Partridge 2018). In support, empirical studies have found that genes with expression biased toward late life are less conserved than those highly expressed at young age across several tissues and mammalian species (Jia et al. 2018; Turan et al. 2019). Building on this, the antagonistic pleiotropy theory describes how genes with beneficial effects early in life can be maintained by selection even if they have pleiotropic negative effects later in life (Williams 1957). In the disposable soma theory, the pleiotropic effect of more specific genes is described, that cause a trade-off between somatic maintenance and reproduction (Kirkwood 1977), so that an increased, or early, investment in offspring is expected to come at the price of a shorter lifespan and vice versa (Kirkwood and Austad 2000).
There are, however, exceptions to these expectations; possibly most notably within social insects, where reproductive castes exhibit relatively long lifespans compared with their sterile siblings (Keller and Genoud 1997). This apparent lack of a trade-off between longevity and fecundity in social insects is at odds with expectations for the disposable soma theory. The longer life of queens compared with sterile castes might be explained by low extrinsic mortality due to the protection of a well-defended nest (Keller and Genoud 1997; Negroni et al. 2016). The low extrinsic mortality of queens can in turn be expected to lead to a reduction of the selection shadow as more queens reach old age, allowing efficient selection on genes that are important for somatic maintenance late in life.
In an attempt to understand the relationship between fecundity and longevity in social insects, several studies have investigated caste and age-specific expression of putative ageing genes in honeybees (Corona et al. 2005, 2007; Aamodt 2009; Seehuus et al. 2013; Aurori et al. 2014), ants (von Wyschetzki et al. 2015; Lucas et al. 2016; Lucas and Keller 2018; Negroni et al. 2019) and termites (Elsner et al. 2018; Kuhn et al. 2019). One of these studies, which compared gene expression between young and old queens of the ant Cardiocondyla obscurior, identified several overlaps with ageing pathways known from Drosophila melanogaster (von Wyschetzki et al. 2015). However, surprisingly, for many genes, the ratio of expression level between old and young ant queens was reversed compared with D. melanogaster. Further studies comparing expression between castes and age groups highlight the importance of several gene pathways for longevity in social insects that have previously been implicated in ageing, such as antioxidants (Corona et al. 2005; Aurori et al. 2014; Kuhn et al. 2019; Negroni et al. 2019), immunity (Aurori et al. 2014; Negroni et al. 2016; Lucas and Keller 2018; Kuhn et al. 2019; Negroni et al. 2019), DNA and somatic repair (Aamodt 2009; Seehuus et al. 2013; Lucas et al. 2016; Kuhn et al. 2019), respiration (Corona et al. 2005; Lockett et al. 2016), as well as the insulin/insulin-like growth factor (IGF) signaling (IIS) (Aurori et al. 2014; Kuhn et al. 2019), and the target of rapamycin (TOR) signaling pathways (Kuhn et al. 2019; Negroni et al. 2019). The IIS and TOR nutrient sensing pathways are of particular interest in this context, since their role in longevity and fecundity has been extensively studied in model organisms (Tatar et al. 2003; Kenyon 2010; Partridge et al. 2011; Flatt and Partridge 2018). These transcriptional studies offer insights into individual genes and their pathways that might be involved in ageing in social insects. However, a more holistic view of gene networks is likely to uncover further important genes as well as insights into transcriptional regulation. For example, a study of gene coexpression networks (GCNs) on mouse brains revealed that with age a decrease in the correlation of expression between genes occurred, showing that transcriptional dysregulation can lead to a significant reduction in gene connectivity (Southworth et al. 2009). These findings demonstrate the application of transcriptional studies for investigating whole pathways and gene networks and their wide-reaching implications for ageing. Furthermore, the extent at which a selection shadow may be reduced for old queens due to a reduction in extrinsic mortality has so far not been formally tested.
To address these questions, we investigated transcriptomic data available for young and old queens of the polygynous ant, C. obscurior (von Wyschetzki et al. 2015). These ant queens are relatively short lived compared with most ant species (median lifespan: 16–26 weeks; Schrempf et al. 2005; Kramer et al. 2015), which is in accordance with expectations for polygynous species, where extrinsic mortality is higher than in monogynous colonies (Keller and Genoud 1997). Nevertheless, as for most ant species, C. obscurior queens (up to 48 weeks) outlive sterile workers that are expected to live around 12–16 weeks (Oettler and Schrempf 2016). Importantly, consistently high reproductive output throughout their lives until immediately before death indicates no apparent reproductive senescence in these ant queens (Kramer et al. 2015). To test for signs of ageing in transcriptional regulation, we carried out a GCN analysis, in which we identified gene modules related to young mated (4 weeks) and old mated (18 weeks) queens and compared overall network connectivity. We also tested the hypothesis that, due to low extrinsic mortality, selection efficiency should not decline with age in queens. We found evidence for an array of antiageing mechanisms that are more tightly regulated in old queens. We could find no evidence for a selection shadow, indicating stable selection efficiency throughout an ant queen life.
Results and Discussion
Old-Biased Genes Are Not under Weaker Selection
Evolutionary theories of ageing predict weaker selection on genes which are expressed in old individuals due to low effective population size and reduced fecundity (Kirkwood and Austad 2000; Flatt and Partridge 2018). In ant queens, we may expect a reduction of this “selection shadow” as low extrinsic mortality and lifelong, high fertility should lead to a stable effective population size up to old age. We tested this by estimating and comparing selection strength between three groups of genes. These were 1) old-biased genes n = 46: significantly over-expressed in seven old (18 weeks) compared with seven young (4 weeks) C. obscurior queens; 2) young-biased genes (n = 96): significantly over-expressed in young compared with old queens; 3) unbiased genes (n = 2,616): no significant difference in expression between young and old queens. To estimate direction and strength of selection, we measured dN/dS (ratio of nonsynonymous to synonymous substitution rates) for one-to-one orthologs with a set of 10 ant species (see Materials and Methods). A dN/dS ratio 1 indicates neutral evolution, whereas values 1 signify purifying selection. We find no evidence for weaker purifying selection in old-aged queens, since dN/dS in old-biased genes (median: 0.084) is in fact significantly lower than in young-biased genes (median: 0.127; P value = 0.016; Mann–Whitney U test; fig. 1), indicating increased purifying selection with age. This is in contrast to published results for age-biased genes in humans, in which old-biased genes had a significantly higher dN/dS (median: 0.22) than young-biased genes (median: 0.09, P = 1.4 × 10– 50), as would be expected for a reduction in purifying selection with age (Jia et al. 2018). This was confirmed by a further study on several mammalian tissues, in which an adjusted dN/dS metric correlated more strongly with expression in young compared with old individuals (Turan et al. 2019). Interestingly, dN/dS in young-biased genes is also significantly higher than in unbiased genes (median: 0.100; P value = 2.2 × 10⁻⁴; Mann–Whitney U test), as has previously been reported for the ant, Lasius niger (Lucas et al. 2017). To further test the ability of this method to detect a selection shadow in insects, we repeated the analysis for D. melanogaster. Age-biased gene expression was measured for a novel data set containing expression data for young (10 days) and old (38 days) female flies across two tissues (head and fat body) and different feeding regimes. Evolutionary rates were obtained for these genes from published analyses based on alignments of 12 Drosophila species (Clark et al. 2007). In contrast to our results for ant queens but in agreement with expectations for a selection shadow, we find significantly higher dN/dS levels in old-biased fly genes (median: 0.060) compared with young-biased genes (median: 0.047; P = 5.1 × 10⁻⁸; Mann–Whitney U test).
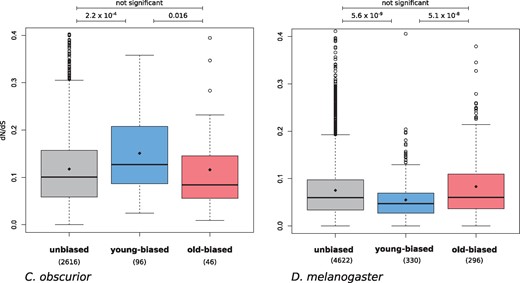
Evolutionary rates (dN/dS) in genes with unbiased expression, young-biased, and old-biased expression in C. obscurior queens and D. melanogaster adult females. Significance was tested with Mann–Whitney U test.
We also investigated the numbers of ant genes that are under significant positive selection within old-biased compared with young-biased and unbiased genes, using a site test of the codeml suite (Yang 1997). Contrary to expectations for weaker selection strength on old queens, we found no difference in the proportion of genes under positive selection between the three groups of genes (old biased: 21.7%; young-biased: 21.9%; unbiased: 16.0%; chi2 = 3.3; P = 0.19). The effect size of the observed difference in proportions of genes under positive selection between young- and old-biased genes is so low (Cohen’s h: 0.003), that we assume the lack of significance is not due to a lack of power. The genes under significant positive selection in old-biased genes contain two regulatory genes (transcription factor and methyltransferase), an electron transport protein, a member of the COPI coatomer complex (important for protein transport), and Notch (table 1). The latter is the central signaling protein within the Notch signaling pathway which is involved in tissue homeostasis and age-related diseases (Balistreri et al. 2016).
Old-Biased Genes under Significant Positive Selection
| Gene | Ortholog | Putative Function |
|---|---|---|
| Cobs_01221 | Uncharacterized | Unknown |
| Cobs_04278 | FBgn0002121 (l(2)gl) | Polarity of neuroblasts and oocytes |
| Cobs_06663 | FBgn0085424 (nub) | Transcription factor |
| Cobs_08231 | FBgn0004647 (Notch) | Tissue homeostasis |
| Cobs_08620 | FBgn0027607 (Dymeclin) | Organization of Golgi apparatus |
| Cobs_09212 | FBgn0033686 (Hen1) | Methyltransferase, methylates siRNA, and piRNA |
| Cobs_11651 | FBgn0036714 (CG7692) | Unknown function |
| Cobs_12452 | FBgn0008635 (βCOP) | Subunit of the COPI coatomer complex, transport from Golgi to ER |
| Cobs_16420 | FBgn0034745 (CG4329) | Unknown |
| Cobs_16765 | Cytochrome b561 domain-containing protein 1 (Q8N8Q1) | Electron transport protein |
Contrary to expectations based on evolutionary theories of ageing, these results suggest selection is not weaker on genes expressed mainly in old queens. We speculate that high fertility in old queens, coupled with an overall low extrinsic mortality, which is typical for social insects (Keller and Genoud 1997; Negroni et al. 2016), may reduce the selection shadow in C. obscurior queens, leading to stable selection strength throughout their fertile life.
Increased Connectivity in Old Ant Queens
In old queens, we expected to find little evidence for age-related transcriptional dysregulation in the form of reduced correlation of gene expression, as previously reported for ageing mouse brains (Southworth et al. 2009). We investigated this by measuring gene connectivity separately within old queens and within young queens, using the softConnectivity function of the WGCNA package (Langfelder and Horvath 2008). This connectivity describes the total strength of correlations that a gene possesses with all other genes in a GCN (Langfelder and Horvath 2008) and is thought to correlate positively with gene essentiality (Carlson et al. 2006). In fact, we find gene expression connectivity to be significantly higher in older queens (median: 145.3) than within young queens (median: 142.5; effect size: 0.255; P = 4.3 × 10⁻²⁹; Wilcoxon signed-rank test), suggesting an increased regulation of gene networks in older queens.
Those genes which are more highly connected in older queens (1,471 genes with connectivity fold change > 2) are enriched for GO term functions (FDR < 0.1) related to protein synthesis, transcription, purine synthesis, cellular respiration, and ATP metabolism (supplementary table S1, Supplementary Material online). Most of the 20 genes with the strongest increase in connectivity in old queens (4.8–7.1-fold increase) compared with young queens are involved in transcriptional regulation (7 genes) or protein homeostasis (6 genes; supplementary table S2, Supplementary Material online). For example, a member of the 26S proteasome complex, important for the degradation of misfolded proteins, is the gene with the highest increase in connectivity in old queens. As has been shown for several organisms, including humans (Lee et al. 2010), yeast (Kruegel et al. 2011), and C. elegans (Vilchez et al. 2012), increased proteosome activity can extend lifespan by reducing proteotoxic stress (López-Otín et al. 2013). An increase in connectivity of fatty-acid synthase 3 may have implications for colony communication (Yan and Liebig 2021). Further highly connected genes include ribosomal proteins or genes involved in the correct folding, post-translational modification, or transport of proteins. The genes with highly increased connectivity in old ant queens, which are involved in transcriptional regulation, include two transcription factors, a transcritional coregulator (taranis), and four mRNA regulators. These results suggest that, contrary to expectations for ageing individuals, increased transcriptional regulation and protein homeostasis takes place in old queens.
Coexpression Modules Related to Age
We constructed a signed, weighted GCN (Langfelder and Horvath 2008) based on the correlation of normalized gene expression across all 14 samples (7 young queens and 7 old queens). Within the GCN, genes could be grouped into 27 modules, within which gene expression was especially strongly correlated (fig. 2). To determine the importance of these modules for old and young queens, we first calculated eigengene expression based on the first principal component of each module. We then correlated eigengene expression of each module with the binary trait “age” (young and old). Five of the modules were significantly, positively correlated with age (P < 0.05; FDR < 0.1), indicating an overall higher expression of these modules in old compared with young queens. Three modules were significantly, negatively correlated with young queens, indicating a downregulation in old queens. To validate these correlations, we analyzed difference in expression of genes between old and young queens (log2[expressionold/expressionyoung]) within each of these modules. Accordingly, the median log2-fold-change in expression was greater than zero in each of the old-biased modules (0.148–0.340) and less than zero within the young-biased modules (−0.376 to −0.249; supplementary fig. S1, Supplementary Material online). Four of the five old-biased modules (1, 2, 3, and 5) belonged to a larger cluster within the GCN, which is quite distant from the cluster containing the young-biased modules (6, 7, 8; fig. 2). Module_4 (old biased), on the other hand, forms a more distinct cluster, adjacent to the young-biased cluster. The old-biased modules contained several genes that had previously been identified as upregulated in old queens via standard differential expression analysis (von Wyschetzki et al. 2015) but contained no genes that were upregulated in young queens. The opposite was true for young-biased modules, thus confirming the validity and compatibility of both methods (fig. 2b).
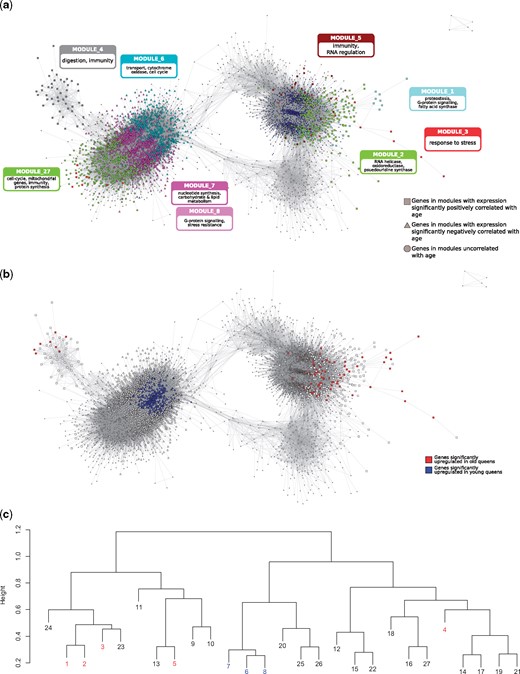
Gene coexpression network. (a and b) Graphical representation of the GCN, containing only the most strongly connected genes (n = 5442). In (a) genes are colored according to the modules to which they belong. The main enriched functions (based on hubs and GO terms) of the nine discussed modules are labeled (see text for more details). In (b) genes are colored according to their differential expression; red: overexpressed in old queens; blue: overexpressed in young queens; white: not differentially expressed. In both representations, genes in modules significantly related to old queen expression are depicted as squares, and those significantly related to young queens are triangles; all other genes are represented by circles. (c) Clustering dendogram of modules; height represents dissimilarity based on topological overlap. Modules significantly related to age are highlighted in red (positive correlation) and blue (negative correlation).
However, importantly, the GCN analysis also allowed the identification of many additional age-related genes that cannot be identified by standard differential expression analyses. For example, module_1, which has the strongest association with old queens (ρ = 0.96; P = 5.3 × 10– 8; FDR = 1.4 × 10– 6; Pearson correlation), contains 109 genes, of which only 41 are individually significantly differentially expressed between old and young queens. Similarly, module_6, which is strongly negatively associated with old queens (ρ = −0.90; P = 9.4 × 10– 6; FDR = 1.3 × 10– 4; Pearson correlation), contains 970 genes, of which 240 were identified as individually significantly upregulated in young queens (von Wyschetzki et al. 2015). In the following section, we describe these eight age-biased modules in terms of their functional enrichment and detail the top hub genes (genes with the highest intramodular connectivity) within these modules.
Old-Biased Modules
The most highly connected hub genes in module_1, the module most strongly upregulated with age (ρ = 0.96; P = 5.3 × 10⁻⁸; FDR = 1.4 × 10⁻⁶; 109 genes; fig. 3), include three genes with functions related to maintaining and restoring proteostasis in old queens (supplementary table S3, Supplementary Material online), the loss of which has been described as one of the hallmarks of ageing (López-Otín et al. 2013). These are: a member of the TRAPP complex, important for protein transport, Socs44A, a gene involved in ubiquitination and GRXCR1, responsible for the post-transcriptional S-glutathionylation of proteins, a modification which is often triggered as a defence against oxidative stress (Dalle-Donne et al. 2009). The top hubs of this module also include two genes which encode integral members of the G-protein signaling pathway, namely, a Rho guanine nucleotide exchange factor and a G-protein α-subunit. The most connected gene within this hub is a fatty-acid synthase which may play an important role in colony communication. This module is enriched for a GO term related to the regulation of transcription (supplementary table S4, Supplementary Material online).
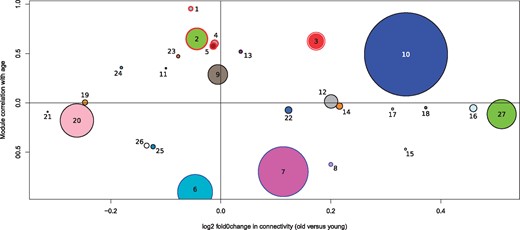
Correlation of GCN modules with age and their change in connectivity between old and young queens. A positive correlation with age (y axis) signifies an upregulation of a module in old queens. A positive log2-fold change in connectivity (x axis) represents a higher connectivity in old queens. Modules are labeled with their assigned module numbers. Sizes of dots represent relative number of genes within modules. Modules with red outlines are significantly upregulated and modules with blue outlines are significantly downregulated in old queens compared with young queens.
Module_2 (596 genes; upregulated with age: ρ = 0.65; P = 0.012; FDR = 0.080) contains hub genes coding for proteins with diverse functions, including an RNA helicase, a maternal protein, a protein with oxidoreductase activity and a pseudouridine synthase (supplementary table S3, Supplementary Material online).
Module_3 (433 genes; upregulated with age; ρ = 0.63; P = 0.017; FDR = 0.080) is particularly interesting since it is not only upregulated with age but, on average, gene members of the module are more strongly connected within old than in young queens (fig. 3). Hub genes indicate this module is important for responses to age-related stress, especially processes related to a maintenance of proteostasis (supplementary table S3, Supplementary Material online). For instance, the top 10 hubs contain the endoplasmic reticulum (ER) stress protein, disulfide-isomerase, which reacts to protein misfolding and oxidative stress (Laurindo et al. 2012), as well as fringe, which modulates Notch signaling, a pathway important for regulating tissue homeostasis and implicated in ageing related diseases (Balistreri et al. 2016). A further hub is a trehalose transporter, orthologous to tret1-2, indicating that the transport of trehalose (the main haemolymph sugar in insects) from fat body to other tissues is well regulated in old queens (Kanamori et al. 2010). This may have a positive effect on survival, since trehalose treatment increases longevity in C. elegans (Honda et al. 2010).
The top 10 hub genes in module_4 (186 genes; ρ = 0.61; P = 0.021; FDR = 0.080) fulfil various functions, such as the digestive enzymes alpha glucosidase and chymotrypsin-1, indicating a possible modification in diet with age (supplementary table S3, Supplementary Material online). The third most connected gene within this module is orthologous to pirk in D. melanogaster (involved in the negative regulation of the immune response; Kleino et al. 2008), indicating the immune system may be downregulated with age in C. obscurior. Interestingly, long-lived flies also tend to downregulate the induction of immune effector genes (Loch et al. 2017; Fabian et al. 2018). This module is enriched for the GO term “transmembrane transport” (supplementary table S4, Supplementary Material online).
Module_5 (169 genes; ρ = 0.58; P = 0.028; FDR = 0.095) may be important for controlling the immune system since two hub genes (supplementary table S3, Supplementary Material online), coding for the COMM domain containing protein 8 (COMMD8) and the WD40 domain containing angio-associated migratory cell protein, are both known to inhibit the transcription factor NF-κ-B (Burstein et al. 2005; Bielig et al. 2009). An upregulation of NF-κ-B occurs with ageing and its inhibition, as apparently occurs within this module, can reduce the effects of senescence (Tilstra et al. 2012). Interestingly, COMMD8 is also characterized by a strong increase in connectivity (1.68-fold change), indicating its heightened importance in old queens. Further functions of this module may be related to RNA regulation, as evidenced by the hub gene eyes_absent, a transcription factor with importance in embryonal eye development in D. melanogaster (Bonini et al. 1998). Based on the 10 nearest neighbours in the C. obscurior GCN, eyes_absent may regulate several enzymes involved in post-transcriptional processes, such as mRNA export from the nucleus (sbr, Cobs_03187), and tRNA modification (Tgt: Cobs_16650; HisRS: Cobs_01013; CG3808: Cobs_18201).
Modules Downregulated with Age
Module_6 (970 genes) is the module most strongly downregulated with age (ρ = −0.9; P = 9.4 × 10⁻⁶; FDR = 1.3 × 10⁻⁴) and is enriched for the GO terms “transmembrane transport” and “potassium ion transport” (supplementary table S4, Supplementary Material online). Interestingly, the top 10 hubs contain three genes with no detectable homology to any protein in the uniprot arthropod database (supplementary table S3, Supplementary Material online). Otherwise, the functions of hub genes in this module span various functions, such as cell–cell interactions, cytochrome oxidase, an odorant receptor and a negative regulator of the cell cycle.
Module_7 (1385 genes; ρ = −0.7; P = 0.006; FDR = 0.050) has several enriched functions in the nucleotide synthetic process, oxidoreductase activity, carbohydrate and lipid metabolism, ATP metabolic processes, cofactor, and coenzyme binding (supplementary table S4, Supplementary Material online). Accordingly the top hubs in this module contain a thioredoxin, a proteasome subunit (α6) and two genes involved in ubiquitination (STUB1 and Ubc6; supplementary table S3, Supplementary Material online).
Module_8 (103 genes; ρ = −0.62; P = 0.018; FDR = 0.080) is enriched for the function “G-protein coupled receptor activity” (supplementary table S4, Supplementary Material online). The top hub gene in this module (intraconectivity 0.90), Cobs_08138, is orthologous to the methuselah-like receptors in D. melanogaster (Friedrich and Jones 2016). Interestingly, mutant flies, carrying P-element insertions in one of these methuselah genes, live 35% longer and are significantly more resistant to stresses than wild-types (Lin et al. 1998). There are indications that these effects on lifespan and stress response may represent the ancestral function of methuselah receptors in Drosophila (Araújo et al. 2013). A similar function of the methuselah ortholog in C. obscurior would explain how a reduction in expression within older queens may facilitate life extension and greater stress resistance.
We also examined module_27 (808 genes) in more detail since it shows the strongest increase in connectivity in old compared with young queens (1.47 fold) of all modules (fig. 3), suggesting an increased regulation of this module with age. The functions connected to this module, based on hubs (supplementary table S3, Supplementary Material online), increases in connectivity (supplementary table S5, Supplementary Material online) and GO terms (supplementary table S4, Supplementary Material online), indicate that in old queens an increased regulation of cell cycle, mitochondrial genes, immunity genes, transcriptional genes, and members of the protein synthesis machinery takes place, which is in stark contrast to the expected gene expression hallmarks of ageing in multicellular eukaryotes (Frenk and Houseley 2018).
Robustness of GCN
Since our sample size of 14 is one lower than the recommended minimum of 15, we confirmed the robustness of our results by adding further samples from the same study (von Wyschetzki et al. 2015). For this, we incorporated expression data from seven old queen samples that had mated with sterile males (“sham-mated”) and then created eight further GCNs, seven of which contained one sham-mated queen (total n = 15) and one GCN containing all seven sham-mated queens (n = 21). We used preservation statistics (Langfelder et al. 2011) to compare the modules of our GCN with these larger GCNs. Within each module, correlation, adjacency, connectivity, and variance explained by the eigennode are compared between all nodes, and for each statistic a z-score is calculated based on 200 permutations. A composite z-summary of these statistics is calculated, whereby a threshold of 2 is deemed as necessary for classing a module as preserved, whereas a score greater than 10 offers strong evidence for module preservation. In each comparison against the 8 additional, larger GCNs, our age-biased modules scored at least 10, offering strong support that our GCN is not affected by a limited sample size.
Old-Biased Module Hubs Are Highly Conserved
We investigated evolutionary rates of the most connected genes within the old- and young-biased modules. Hub genes (intraconnectivity > 50%) of the five old-biased modules have significantly lower rates of protein evolution (dN/dS median: 0.081) than hubs in young-biased modules (median: 0.118; P = 6.0 × 10⁻⁴) or compared with all lowly connected genes (intraconnectivity < 50%; median: 0.101; P = 0.017; fig. 4). We investigated the influence of expression levels on these results, since highly expressed genes are often found to be under stronger purifying selection (Drummond et al. 2005). However, expression levels, based on mean normalized read counts among all 14 samples, do not differ between hub genes of old-biased (mean: 291.5) and young-biased genes (mean: 326.8; W = 3160, P value = 0.18). These results suggest the hub genes of old-biased modules are highly constrained by strong purifying selection.
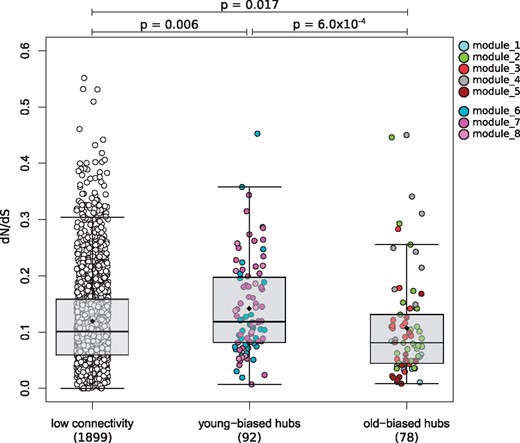
dN/dS rates in hub genes within young- and old-biased modules compared with lowly connected genes. Each dot represents a gene, which are colored by the module membership. Whiskers of the boxplots represent up to 1.5 times the interquartile range. Black diamonds are means, and horizontal bars within the boxes are medians. Hub genes have an intraconnectivity > 50%; lowly connected: <50%.
Conclusions
Evolutionary theory of ageing predicts a selection shadow on genes expressed late in life due to a reduction in effective population size with increasing age caused by extrinsic mortality (Kirkwood and Austad 2000). We expected to find a reduced selection shadow in C. obscurior queens, as ant queens generally experience low extrinsic mortality. In support, we find compelling evidence for strong purifying selection on old-biased genes (significantly upregulated in seven old compared with seven young queens), for which evolutionary rates (dN/dS) are significantly lower than young-biased genes. In contrast, we find evidence of a selection shadow in D. melanogaster where dN/dS is significantly higher for old-biased genes. Our results suggest, therefore, that C. obscurior queens are not affected by a selection shadow, so that genes important at old age cannot be expected to accumulate deleterious mutations at an increased rate compared with early-acting genes. This offers an explanation for the apparent lack of ageing and the high reproductive output of old ant queens.
Furthermore, we were interested in understanding whether C. obscurior queens show signs of ageing, especially within transcriptional regulation. This is a particularly intriguing question since the reproductive fitness of these ant queens remains high until old age, although they outlive their sterile siblings (Oettler and Schrempf 2016). In fact, our analysis of coexpression networks in C. obscurior queens uncovers a significant increase in gene connectivity in old queens. This result offers evidence for an increased transcriptional regulation, especially in genes that are themselves involved in transcriptional regulation, as well as several genes involved in protein synthesis and degradation, which are important mechanisms for counteracting symptoms of ageing (Frenk and Houseley 2018). Also, the analysis of old-biased modules (clusters of highly correlated genes, upregulated with age) within the GCN revealed an increase in expression and connectivity of genes involved in proteostasis, stress response, and transcriptional regulation (fig. 2a), offering further support for well-regulated antiageing mechanisms. The hub genes within these old-biased modules are more highly conserved than hubs of young-biased modules, indicating strong purifying selection acting on these important central regulators.
In summary, we find no evidence of ageing in transcriptional regulation in C. obscurior queens. Low extrinsic mortality may allow selection to shape genes important at old age, which is evident in low divergence rates (dN/dS) of the hubs of old-biased modules. Well regulated molecular mechanisms likely allow the ant queens to counteract any symptoms of ageing, thus maintaining high reproductive fitness throughout life. We suggest further transcriptional studies into the short period directly before death when the reproductive output of C. obscurior queens decreases (Heinze and Schrempf 2012; Kramer et al. 2015), which we expect to illuminate processes of transcriptional ageing. Transcriptional studies of other ant species are necessary to investigate the generality of our findings. In monogynous ants, for example, in which individual queens are less dispensible, we would expect to observe an even weaker selection shadow. Also, C. obscurior queens are relatively short lived compared with other ant species. Selection strength on age-biased genes of extremely long-lived queens may be less affected by reductions in effective population sizes due to longer generation times. Further detailed research on individual pathways is important to understand how an upregulation of antiageing mechanisms occurs; especially proteomic analyses may reveal the true relationships between pathway members.
Materials and Methods
Data Set
Genome and proteome sequences of the C. obscurior genome, version 1.4, were obtained from the hymenopteragenome.org website (Elsik et al. 2016; accessed July 2018). We estimated gene functions based on orthology, primarily to D. melanogaster, as well as PFAM domains and GO terms. Putative protein functions were based on descriptions in the flybase (Thurmond et al. 2019) and UniProt (The UnitProt Consortium 2018) databases, unless otherwise stated. We calculated orthology to D. melanogaster with the method of reciprocal best BLAST hit (Rivera et al. 1998). For this, the proteomes of C. obscurior and D. melanogaster (v. 6.21; obtained from ftp://ftp.flybase.net/releases/current/dmel_r6.21/fasta/, accessed June 2018) were blasted against each other using BLASTp (BLAST 2.7.1+; Camacho et al. 2009) and an e-value threshold of 1e–5. Reciprocal best BLAST hits were extracted from the output files using a custom perl script. Where no orthology could be detected using this method, protein sequences were blasted against the swissprot database with BLASTp (version 2.7.1+; Altschul et al. 1990) and the best hit was retained with an e-value < 0.05. Protein sequences were annotated with PFAM domains using pfamscan (Mistry et al. 2007), to which GO terms were mapped with pfam2GO (Mitchell et al. 2015).
Published RNAseq data were obtained for seven old (18 weeks) and seven young (4 weeks) ant queens from NCBI (von Wyschetzki et al. 2015). These queens had each been individually reared from pupal stage in separate experimental colonies, each containing 20 workers and 10 larvae, originating from the genome reference population in Bahia, Brazil (Schrader et al. 2014; von Wyschetzki et al. 2015). Fastq files were mapped to the C. obscurior genome (version 1.4) with hisat2 (Kim et al. 2019) using default parameters. We then indexed and sorted sam files using samtools (version 1.7; Li et al. 2009) and generated counts per gene using htseq-count (Anders et al. 2015). All statistical analyses on these counts were carried out in R (version 3.5.1; R Core Team 2018). Where necessary, we corrected for multiple testing with the p.adjust function, using the fdr method (Benjamini and Hochberg 1995). A total of 10,339 genes were expressed in at least two individuals with a read count of at least 10. This subset of genes was used for all analyses.
Determining Age-Biased Expression
Within this subset of 10,339 genes, we identified genes with age-biased expression by comparing expression in the seven old to the seven young samples. This was carried out with the R package DESeq2 at default settings (Love et al. 2014). Genes with an adjusted P value < 0.05 were deemed either old or young biased. All other genes were classified as unbiased.
Molecular Evolution and Selection Analyses
In order to carry out evolutionary analyses, we first determined orthology between the proteomes of C. obscurior and nine further ant species, which we either downloaded from the hymenopteragenome.org website (Elsik et al. 2016; accessed August 2020): Atta cephalotes, Pogonomyrmex barbatus, Solonopsis invicta and Wasmannia auropunctata; or NCBI (accessed August 2020): Monomorium pharaonis, Temnothorax curvispinosus, Temnothorax longispinosus, Vollenhovia emery. Data for Crematogaster levior were obtained from the authors of the genome publication upon request (Hartke et al. 2019). Orthology was determined with OrthoFinder (Emms and Kelly 2015) at default settings. We chose orthologous groups that contained single gene copies within each of the 10 species. Protein sequences of each ortholog set were aligned with prank (version 170427; Löytynoja 2014) at default settings. The corresponding CDS sequences were aligned using pal2nal (Suyama et al. 2006). CDS alignments were trimmed for poorly aligned codon positions with Gblocks (version 0.91b) with the following parameters: -t = c -b2 = 6 -b3 = 100000 -b4 = 1 -b5 = h. We calculated dN/dS ratios using the null model of codeml in the PAML suite (Yang 1997), using the following tree based on a published ant phylogeny (Ward et al. 2015):
dN/dS ratios were used for analyses only if dS < 3. dN/dS ratios were compared between old-biased, young-biased, and unbiased genes using the Mann–Whitney test with the R function wilcox.test.(((((((Tlon,Tcur),Clev),Veme),Cobs),(Waur,Acep)),(Mpha,Sinv)),Pbar)
In order to detect genes that contain codon sites under positive selection, we performed a likelihood-ratio test between models 7 (null hypothesis; dN/dS limited between 0 and 1) and 8 (alternative hypothesis; additional parameter allows dN/dS > 1) of the codeml program within the PAML suite (Yang 1997). For this we used runmode 0, model 0, and set “NSsites” to 7 and 8.
Gene Coexpression Analysis
The expression counts data were normalized using the built-in median of ratios method implemented by default in DESeq2 (version 1.22.2; Love et al. 2014) and then transposed to a matrix containing genes in columns and samples in rows. With the reduced set of 10,339 genes, we created a signed weighted GCN using the WGCNA package (version 1.68; Langfelder and Horvath 2008) that incorporated expression values from all 14 queen samples (7 young and 7 old). We followed the standard stepwise protocol(https://horvath.genetics.ucla.edu/html/CoexpressionNetwork/Rpackages/WGCNA/Tutorials/; last accessed March 2021), using a soft power of 14 and the biweight midcorrelation function for calculating coexpression similarity. Minimum module size was set at 30 and resulting modules with a correlation of at least 0.75 were merged. Hub genes within modules were determined based on the intramodular connectivity, which we calculated with the intramodularConnectivity function on the adjacency matrix, that was produced during the WGCNA pipeline. Age-biased modules were identified by correlating (Pearson) the eigengene of each module with the binary trait young/old. FDRs were calculated with the p.adjust function, and modules with an FDR < 0.1 were considered significantly related to age.
To compare connectivity between young and old queens, we calculated connectivity with the softConnectivity function separately within the young and the old queen expression data. We used the same soft power value of 14 and the biweight midcorrelation function.
To create a visualization of the GCN, the topological overlap matrix was reduced to only contain genes with a topological overlap of at least 0.1 to at least one other gene. Edge and node files were created with the WGCNA function exportNetworkToCytoscape, using a threshold of 0.1. All further visualizations of the network were conducted in Cytoscape (v. 3.7.2, Shannon et al. 2003).
To test the robustness of our GCN, we created seven additional GCNs each with one extra sample taken from the sham-mated queens previously published within the same data set as our main data used here (von Wyschetzki et al. 2015). We also created one larger GCN containing all 7 sham-mated queens, therefore containing 21 samples. Each additional GCN was created with the same parameters as our original GCN and then compared with our original GCN with the built-in WGCNA function, modulePreservation and the Zsummary statistic was calculated. This composite z-score combines several comparative statistics, such as adjacency, connectivity, and proportion of variance explained, with a score of 10 suggested as a threshold for strong evidence of module preservation (Langfelder et al. 2011).
GO Enrichment
GO term enrichment analyses were carried out with topGO (version 2.34.0; Alexa and Rahnenfuhrer 2018) on the “biological process” category, using the classic algorithm. Node size was set to 5, Fisher statistic was implemented and we only kept GO terms that matched at least three genes and with a P value < 0.05. An FDR was added using the R function p.adjust and the method “fdr” (Benjamini and Hochberg 1995); GO terms with an FDR < 0.1 were described in the text.
Drosophila melanogaster Data Set
To estimate evidence of a selection shadow in D. melanogaster, we accessed a recently compiled, but so far unpublished, RNAseq data set (SRA accession: PRJNA615318). This data set comprised RNAseq of 34 samples of five pooled flies. We used y1, w1118 mutant flies (full genotype: yw; +/+; +/+). These flies were maintained in laboratory conditions at 25 °C, 12 h:12 h light:dark and 60% relative humidity.
Experimental Setup
Adult virgin females and males were collected separately, and 3 days later they were pooled together to freely mate. Eggs were laid in a controlled density (50–100 eggs per bottle) and developed until the adult stage in the same conditions as mentioned above. After eclosion, the offspring adult flies matured for one day. On the second day after eclosion, female and male flies were collected and transfered to a demographic cage. Each cage contained 130 females and 70 males. Once cages were set up, they were divided into four groups, which consisted of four different diet treatments. The diet treatments differed only in the content of yeast (20, 40, 80 or 120 g) present in the fly food; the other ingredients were added in the same quantities in all diets (1 l water, 7 g agar, 50 g sugar, 10 ml 20% nipagin, and 6 ml propionic acid). All cages were maintained in the same conditions as described above.
Sampling and RNA Extractions
Female flies were sampled at two time points: 10 days (young) and 38 days (old). For each time point, sampling and dissections were done between 1 and 6 PM. Two groups of five females each (two replicates) were anesthetized in the fridge (approximately 4 °C), and afterwards fat bodies were dissected in ice-cold 1× PBS. To guarantee that we sampled the entire fat body, we decided to use in this experiment fat bodies still attached to the cuticle—usually referred to as fat body enriched samples—because the cuticle is transcriptionally inactive. In ice-cold PBS, the female fly abdomens were opened, and the organs were carefully removed. Once the fat body tissue was clean, the abdomen cuticle was separated from the thorax. The fat body-enriched tissues were transferred into Eppendorf with 200 μl of homogenization buffer from the RNA isolation kit (MagMAXTM-96 Total RNA Isolation Kit from Thermo Fisher). The tissues were homogenized and stored at −80 °C until RNA extraction. To sample head transcriptomes, flies were transferred to Eppendorfs and snap frozen with liquid nitrogen. Then the Eppendorfs were vigorously shaken to separate the heads from the bodies. The heads were then transferred into an Eppendorf containing 200 μl of homogenization buffer, from the RNA isolation kit. As described above, tissues were homogenized in the solution and kept at −80 °C until RNA extraction. All extractions were done using the MagMax robot from Thermo Fisher and the MagMAXTM-96 Total RNA Isolation Kit. In this experiment there is a total of 34 samples: 2 time points × 4 diet treatments × 2 tissues = 16 groups, for each group we have 2–3 replicates (all groups have 2 replicates except for the second time point for 2% yeast diet, where we have 3 replicates). The sequencing of the RNA samples was done in BGI, Hong Kong, China. The samples were sequenced (paired end, 100 bp) on an Illumina HiSeq 4000 platform. Gene counts were generated in the same manner as for C. obscurior using genome version 6.21 (obtained from ftp://ftp.flybase.net/releases/current/dmel_r6.21/fasta/, accessed June 2018).
Supplementary Material
Supplementary data are available at Genome Biology and Evolution online.
Acknowledgments
This article was written as part of the research carried out by the DFG Collaborative Research Unit (RU) “Sociality and the Reversal of the Fecundity-longevity Trade-off” (DFG FOR2281, www.so-long.org), and we thank the members of the RU for stimulating discussions. M.C.H. was supported by a DFG grant BO2544/11-1 to E.B.B. J.O. and L.M.J.N. were supported by DFG grant OE549. M.R. and T.F. were supported by the Swiss National Science Foundation (SNSF) (grants 310030E-164207 and 31003A_182262 to T.F.) and the Novartis Foundation for Medical-Biological Research (grant 19B149 to T.F.).
Author Contributions
M.C.H., E.B.B. conceived and initiated the project. M.C.H., E.B.B., and J.O. designed the study. M.C.H. wrote the manuscript and carried out most analyses. J.R. assisted with dN/dS analyses. M.C.H. and J.O. interpreted ant data, all authors interpreted comparative data. L.M.J. assisted in the interpretation of GO term enrichment analyses. T.F. and M.A.R. generated fly data and helped analyze them. M.C.H. wrote the manuscript which was revised and approved by all the authors.
Data Availability
Ant queen data are already published (von Wyschetzki et al. 2015) and available at SRA under accessions: PRJNA293450 and PRJNA284224. Drosophila data are deposited on SRA under accession: PRJNA615318. Scripts are available on the github: https://github.com/MCH74/AgeingInCardiocondyla.
