


Abstract
The spotted scat, Scatophagus argus is a member of the family Scatophagidae found in Indo-Pacific coastal waters. It is an emerging commercial aquaculture species, particularly in East and Southeast Asia. In this study, the first chromosome-level genome of S. argus was constructed using PacBio and Hi-C sequencing technologies. The genome is 572.42 Mb, with a scaffold N50 of 24.67 Mb. Using Hi-C data, 563.28 Mb (98.67% of the genome) sequences were anchored and oriented in 24 chromosomes, ranging from 12.57 Mb to 30.38 Mb. The assembly is of high integrity, containing 94.26% conserved single-copy orthologues, based on BUSCO analysis. A total of 24,256 protein-coding genes were predicted in the genome, and 96.30% of the predicted genes were functionally annotated. Evolutionary analysis showed that S. argus diverged from the common ancestor of Japanese puffer (Takifugu rubripes) approximately 114.8 Ma. The chromosomes of S. argus showed significant correlation to T. rubripes chromosomes. A comparative genomic analysis identified 49 unique and 90 expanded gene families. These genomic resources provide a solid foundation for functional genomics studies to decipher the economic traits of this species.
Introduction
The spotted scat, Scatophagus argus (fig. 1A) (family Scatophagidae; order Perciformes) is a euryhaline teleost fish, widely distributed in fresh, brackish, and marine waters of the Indo-Pacific (Gandhi et al. 2013; Gupta 2016). Juveniles generally live in muddy coastal areas, including estuaries, mangroves, harbors, and the lower courses of rivers, whereas adults migrate to marine environments. There are only two genera and three species in the family Scatophagidae: Spotted scat, banded scat (Scatophagus tetracanthus), and spot-banded scat (Selenotoca multifasciata) (Froese and Pauly 1995). Scatophagusargus is an economically important aquaculture species in East and Southeast Asia due to its easy cultivation, low feeding cost, and high market price (Cai et al. 2010; Yang et al. 2020). It also is a popular food, with a low fat and high-protein content (Shao et al. 2004; Gupta 2016) and is a popular aquarium species due to its colorful appearance and calm behavior (Amarasinghe et al. 2002). Considering its importance, S. argus has been intensively studied on its reproductive biology (Mandal et al. 2020; Mustapha et al. 2018; He et al. 2019), population genetics (Liu et al. 2013; Yan et al. 2020; Yang et al. 2020), and osmoregulation (Mu et al. 2015; Su et al. 2020). With advances in genomics, the genetic basis of significant traits, molecular markers for important economic traits, and genome-assisted breeding in this species are being investigated. However, a large-scale genomic analysis at the chromosome level has not been carried out in S. argus.
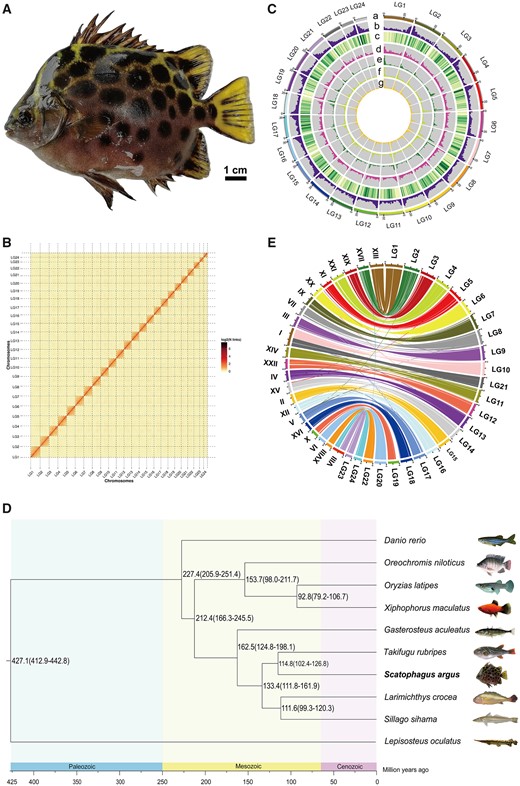
Characteristics of spotted scat genome assembly. (A) A spotted scat (Scatophagus argus). (B) Spotted scat genome contig contact matrix using Hi-C data. LGs 1–24 are the abbreviations of Lachesis group 1–24, representing the 24 chromosomes. The color bar illuminates the logarithm of the contact density from red (high) to white (low) in the plot. Only sequences anchored on chromosomes are shown. (C) Features of spotted scat genome. (a) Chromosome length; (b) GC content; (c) gene density; (d) repeat sequence; (e) long terminal repeated (LTE); (f) long interspersed nuclear elements (LINE); and (g) simple sequence repeat (SSR). (D) Phylogenetic tree of 10 teleost species genomes, which was constructed using 3,473 single-copy orthologous genes. Divergence times of spotted gar and yellow crocker, zebrafish and Japanese puffer, Japanese medaka and three-spined stickleback, yellow crocker and Japanese puffer from the TimeTree database were used for calibration. The numbers on the branches indicate the estimated diverge times in millions of years ago. (E) Genome comparison between spotted scat and Japanese puffer. Each colored arc represents the best match between the two species. LG1–24 represents chromosomes 1–24 of the spotted scat genome, and roman numerals represent chromosomes 1–22 of the Japanese puffer genome.
The rapid development of high-throughput sequencing techniques has significantly reduced sequencing costs, enabling genome projects to be carried out by individual laboratories. PacBio's single-molecule real-time (SMRT) sequencing technology and the high-throughput chromosome conformation capture (Hi-C) assisted genome assembly technique have been used to obtain chromosome-level genome for many teleost species. A hybrid PacBio/Hi-C method generated high-quality chromosome-level reference genomes for nemachilus tibetan (Triplophysa tibetana) and largemouth bass (Micropterus salmoides), with a scaffold N50 length of 24.9 Mb and 36.5 Mb, respectively (Yang et al. 2019; Sun et al. 2021). In this study, the first chromosome-level genome assembly of S. argus was generated, using a combination of PacBio sequencing with Hi-C technology. This genome will be useful for functional gene mapping of economic traits and breeding management of this species, as well as for genome comparisons in broader evolutionary research among teleost fish.
Materials and Methods
Sample Collection and DNA Extraction
An adult female spotted scat (weight: 100.80 g; length: 12.00 cm, fig. 1A) reared in the breeding center of Guangdong Ocean University, Zhanjiang, Guangdong, China, was used for genome sequencing and assembly. The fish was immediately dissected after treatment with anesthetic tricaine methanesulfonate (MS‐222, Sigma, Saint Louis, MO, USA). Fresh muscle tissue was used for DNA extraction using the phenol/chloroform extraction method (Sambrook and Russell 2006). Tissue from the brain, heart, liver, spleen, kidney, muscle, and gonad (ovary) of the same fish were used for transcriptome sequencing. Animal experiments followed the guidelines of the Animal Research and Ethics Committee of the Institute of Aquatic Economic Animals, Guangdong Ocean University, China (201903004).
Library Construction and Genome Sequencing
Genomic DNA libraries were prepared according to the manufacturer’s instructions: 10 μg genomic DNA was sheared using g-Tube for PacBio long-read sequencing, and an SMRT bell library was constructed using a DNA Template Prep Kit 1.0 (Pacific Biosciences, Menlo Park, CA, USA). The SMRT bell-polymerase complex was created and loaded onto SMRT cells using a Binding Binding Kit 2.0 (Pacific Biosciences). SMRT cells were run on the Sequel platform at Biomarker Technologies Corporation (Beijing, China) for whole-genome sequencing. Adaptors, low-quality reads, and short fragments were filtered to obtain high-quality subreads.
The Hi-C library (350 bp insert size) was constructed for sequencing to obtain the chromosome-level genome assembly. Muscle cells were fixed by formaldehyde, and a restriction enzyme was added to digest DNA, followed by repair of 5′ overhangs of DNA by biotin residues. Sequencing was done using the Illumina HiSeq X Ten platform. Raw reads were filtered using the HTQC package to avoid the potential influence of low-quality reads in subsequent analyses (Yang et al. 2013).
RNA was extracted from seven tissues (brain, heart, liver, spleen, ovary, kidney, and muscle) of the same fish using TRNzol Universal Reagent (TIANGEN Biotech, Beijing, China). Two micrograms of total RNA from each tissue were pooled for RNA sequencing. The pooled sample was sequenced on the Illumina HiSeq X Ten platform (Illumina, USA).
Genome Assembly
Subreads of the SMRT bell library were corrected by CANU v1.5 (Koren et al. 2017), then WTDBG v1.0 (https://github.com/ruanjue/wtdbg, last accessed May 9, 2021) was used for primary genome assembly. After completing the primary assembly, PE reads of Hi-C data were aligned to the primary genome assembly using BWA v0.7.10-r789 (Li and Durbin 2009). HIC-PRO v2.10.0 was performed to find the valid reads from unique mapped read pairs (Servant et al. 2015). The contigs of the primary genome assembly were corrected by breaking them into segments (average 50 kb) and reassembled with Hi-C data. The corrected contigs and valid Hi-C reads were used for chromosomal-level genome assembly, using Lachesis (Burton et al. 2013) with the following parameters: cluster min re sites = 52; cluster max link density = 2; cluster noninformative ratio = 2; order min n res in trunk = 46; and order min n res in shreds = 42. A genome-wide Hi-C heatmap was built and visualized with Juicebox (Durand et al. 2016) to evaluate the chromosomal-level genome assembly quality.
Assessment of Genome Assemblies
Core eukaryotic genes were searched against the genome using CEGMA v2.5 (Parra et al. 2007) with the parameter set as identity >70%, and the core genes of the Actinopterygii database were searched against the genome using BUSCO v2.0 (Simao et al. 2015) with default parameters.
Repeat Sequence Annotation
A de novo repeat library was constructed by Repeatscout v1.0.5 (Price et al. 2005), LTRfinder v1.05 (Xu and Wang 2007), and Piler-DF v2.4 (Edgar and Myers 2005) with default settings. The predicted repetitive sequences were classified by Paste classifier v1.0 (Hoede et al. 2014) and combined with the Repbase v22.11 database (Bao et al. 2015) to build the ultimate repeat library. RepeatMasker v4.0.6 (Tarailo-Graovac and Chen 2009) was used to identify the nonredundant repetitive sequences in the ultimate repeat library.
Gene Prediction and Functional Annotation
Homolog, RNA-seq, and ab initio methods were used to predict protein-coding genes. For the homolog-based method, the protein data of zebrafish (Danio rerio), yellow croaker (Larimichthys crocea), Nile tilapia (Oreochromis niloticus), and Japanese medaka (Oryzias latipes) were downloaded from GenBank (http://www.ncbi.nlm.nih.gov, last accessed May 9, 2021) to conduct gene annotation by Gemoma v1.3.1 (Keilwagen et al. 2016). For the RNA-seq-based method, the retained high-quality clean reads of transcripts were aligned to the genome using Hisat v2.0.4 (Kim et al. 2015) and assembled by Stringtie v1.2.3 (Pertea et al. 2015). The genes were predicted with Pasa v2.0.2 (Haas 2003), Genemarks-T v5.1 (Tang et al. 2015), and Transdecoder v2.0 (https://github.com/TransDecoder, last accessed May 9, 2021). For the ab initio-based method, Genscan v3.1 (Burge and Karlin 1997), Augustus v2.4 (Stanke and Waack 2003), Glimmerhmm v3.0.4 (Majoros et al. 2004), Geneid v1.4 (Blanco et al. 2007), and Snap v2006-07-28 (Korf 2004) were used for gene prediction, with default parameters. These programs were trained using the zebrafish gene model. Finally, EVM v1.1.1 (Haas et al. 2008) and Pasa were used to integrate the above three methods' prediction results.
The predicted genes were aligned to the nonredundant protein sequences (NRs) (Aron et al. 2011), eukaryotic orthologous groups of proteins (KOG) (Tatusov et al. 2003), Kyoto encyclopedia of genes and genomes (KEGG) (Kanehisa and Goto 2000), and Translation of European Molecular Biology Laboratory EMBL (Tr EMBL) (Boeckmann 2003) databases using BLAST v2.2.31 (Altschul et al. 1990) with a cutoff e-value of 1e−5 for functionally annotating predicted genes. Gene ontology (GO) (Consortium 2004) annotation was performed with BLAST2GO v4.1 (Conesa et al. 2005).
For noncoding RNA prediction, tRNASCAN-SE v1.3.1 (Lowe and Eddy 1997) was used to annotate tRNAs. Infernal v1.1 (Nawrocki and Eddy 2013) was applied to search for rRNAs, and microRNAs based on the RFAM v13.0 (Daub et al. 2015) and miRBASE v21.0 (Griffiths-Jones et al. 2006) databases.
Gene Family Identification and Phylogenetic Analysis
Orthomcl v2.0.9 (Li et al. 2003) was used to detect ortholog groups by retrieving the protein data of nine teleost species, including T. rubripes (GCA_901000725.2), southern platyfish (Xiphophorus maculatus, GCA_002775205.2), O. latipes (GCA_004347445.1), D. rerio (GCA_008692375.1), three-spined stickleback (Gasterosteus aculeatus, GCA_006229165.1), O. niloticus (GCA_001858045.3), L. crocea (GCA_004352675.1), silver sillago (Sillago sihama, GWHAOSB00000000), and spotted gar (Lepisosteus oculatus, GCA_000242695.1). Genes were classified into orthologues groups, including orthologues and paralogues. The single-copy orthologous shared by all 10 teleost species were aligned using Muscle v3.8.31 (Edgar 2004), and an ML phylogenetic tree was constructed with PHYML v3.0 (Guindon et al. 2010). The divergence time among species was estimated by the Mcmctree program of the PAML package v4.7a (Yang 2007). Divergence times from the TimeTree database (http://timetree.org/, last accessed May 9,2021) were used for calibration. CAFÉ v4.2 (De Bie et al. 2006) was used to identify expanded and contracted gene families with P < 0.05.
According to the phylogenetic analysis, the T. rubripes is closely related to S. argus. To visualize the concordance between the genomes, the 24 S. argus chromosomes were aligned with T. rubripes chromosomes by Mcscanx (Wang et al. 2012). Scatophagusargus chromosomes were named as Lachesis group 1–24.
Results and Discussion
Genome Sequencing and Assembly
After quality filtering, 69.52 Gb (121× sequence coverage) subread data were generated from the SMRT bell library. The average length and N50 of the subread were 12.67 kb and 19.04 kb, respectively (supplementary table S1, Supplementary Material online). The primary genome assembly size was 572.54 Mb, with a long contig N50 of 21.05 Mb (table 1). This genome size is close to that estimated by 17-mer analysis (598.73 Mb; Huang et al. 2019), indicating that an appropriate assembly size was obtained from the PacBio data.
Summary of the Spotted Scat Scatophagus argus Genome Assembly and Annotation
| Chromosome-Level Genome Assembly | |
|---|---|
| Genome Assembly and Chromosomes Construction | |
| Contig N50 size (bp) | 21,048,838 |
| Contig N90 size (bp) | 4,427,241 |
| Maximum contig size (bp) | 30,132,598 |
| Scaffold N50 (bp) | 24,670,690 |
| Scaffold N90 (bp) | 19,600,000 |
| Maximum scaffold size (bp) | 30,379,288 |
| Number of chromosomes | 24 |
| Total length of chromosomes (bp) | 572,536,915 |
| Genome Quality Evaluation | |
| Proportion of CEG orthologs (%) | 98.91 |
| Proportion of highly conserved CEG orthologs (%) | 99.19 |
| Proportion of complete BUSCO orthologs (%) | 96.97 |
| Proportion of complete and single-copy BUSCO orthologs (%) | 94.26 |
| Proportion of complete and duplicated BUSCO orthologs (%) | 2.71 |
| Proportion of fragmented BUSCO orthologs (%) | 0.98 |
| Proportion of missing BUSCO orthologs (%) | 2.05 |
| Gene Annotation | |
| Number of GO annotation | 12,515 |
| Number of KEGG annotation | 14,651 |
| Number of KOG annotation | 16,017 |
| Number of TrEMBL annotation | 23,176 |
| Number of NR annotation | 23,335 |
| Number of all annotated | 23,359 |
For Hi-C sequencing, 69.50 Gb (121× sequence coverage) clean reads were obtained from the Hi-C sequencing library (supplementary table S1, Supplementary Material online). The efficiency of Hi-C sequence data compared with the primary assembled genome was 92.79%, and 83.64% of the read pairs were uniquely detected in the assembly (supplementary table S2, Supplementary Material online). HIC-PRO detected 109,389,408 valid read pairs (supplementary table S3, Supplementary Material online). The chromosome-level genome assembly was 572.42 Mb, with scaffold N50 of 24.67 Mb (table 1). Using Hi-C data, 185 contigs were mapped to 24 chromosomes by agglomerative hierarchical clustering: 87 of these contigs were successfully ordered and oriented (supplementary table S4, Supplementary Material online). A genome-wide Hi-C heatmap was generated to evaluate the quality of the chromosomal-level genome assembly: 24 chromosomes could be easily distinguished, consistent with the chromosome numbers in previous karyotype analyses (Suzuki et al. 1988). The interaction signal strength around the diagonal was considerably stronger than that of other positions within each pseudochromosome (fig. 1B).
Genome Assembly Completeness
The Core Eukaryotic Genes Mapping Approach (CEGMA) and Benchmarking Universal Single-Copy Orthologs (BUSCO) assessments show that the chromosomal-level genome contained 99.19% of the 248 core eukaryotic genes, and 96.97% complete genes of the 4,584 core genes in the Actinopterygii database (table 1). This indicates that the genome assembly was complete and of high quality.
Repeat Annotation and Gene Prediction and Annotation
According to de novo prediction and the Repbase database, 90.42 Mb of repetitive sequences were identified, occupying 15.80% of the whole genome assembly. The predominant repeat types were DNA transposons (7.90%), long interspersed elements (LINEs, 4.80%), and large retrotransposon derivatives (LARDs, 1.88%) (supplementary table S5, Supplementary Material online and fig. 1C).
The combination of homologous prediction, ab initio prediction, and RNAseq prediction methods yielded a final set of 24,256 protein-coding genes, with an average gene length of 12,279.36 bp (supplementary tables S6 and S7, Supplementary Material online). Of these, 23,359 (96.30%) genes were annotated with at least one related functional assignment (table 1). Noncoding RNA prediction identified 793 transfer RNAs (tRNAs), 481 ribosomal RNAs (rRNAs), and 491 microRNAs (miRNAs) (supplementary table S8, Supplementary Material online).
Genome Evolution
To investigate the phylogenetic relationship of S. argus with other species, the genomes of 10 teleost species were compared: 20,020 gene families and 3,473 single-copy orthologues were identified (supplementary table S9, Supplementary Material online). The maximum likelihood (ML) phylogenetic tree showed that Japanese puffer (Takifugu rubripes) was closely related to S. argus, with divergence approximately 114.8 (102.4–126.8) Ma (fig. 1D). The genomes of S. argus and T. rubripes were compared with examine the chromosome evolution events after speciation. Twenty chromosomes of S. argus could be aligned to single chromosomes of T. rubripes. The Lachesis group (LG) 10 and LG21, and LG23 and LG24 of S. argus were mapped to chromosomes I and VIII of T. rubripes, resulting from chromosome fission and fusion events of ancestral chromosomes during species evolution (fig. 1E).
Gene Family Comparison
The expansion and contraction of gene families are one of the most important factors in the evolution of phenotypic diversity and environmental adaptation (Rayna and Hans 2015). The gene families of 10 teleost species were compared: 49 unique gene families, consisting of 158 genes were identified in S. argus, which are mainly immune-related gene families (immunoglobulin V-set domain, immunoglobulin domain, and immunoglobulin C1-set domain) (supplementary table S10, Supplementary Material online). In addition, there are 90 expanded gene families (P < 0.05) and 38 contracted gene families (P < 0.05) (supplementary table S11 and fig. S1, Supplementary Material online). The expanded genes were enriched in 24 KEGG pathways (P < 0.05) (supplementary table S12 and fig. S2, Supplementary Material online). The expanded gene families were overrepresented in immune system pathways, such as intestinal immune network for immunoglobulin A (IgA) production, herpes simplex infection, and nucleotide-binding oligomerization domain (NOD)-like receptor signaling pathway. Of these, the major histocompatibility complex (MHC) class I showed the greatest degree of gene family expansion, followed by immunoglobulin heavy chain, and MHC class II.
Conclusion
In this study, the first high-quality chromosome-level genome of Scatophagidae was produced. With the powerful sequencing ability of PacBio and Hi-C, the scaffold N50 of the assembled genome was 24.67 Mb, and the longest scaffold was 30.38 Mb. The completeness and continuity of this genome is comparable with that of other model teleost species. The reference genome generated in this work will facilitate research on functional gene identification of important economic traits for S. argus and improve the artificial breeding industry for this economically important fish species.
Supplementary Material
Supplementary data are available at Genome Biology and Evolution online.
Acknowledgments
This study was supported by grants from the Key Project of “Blue Granary Science and Technology Innovation” of the Ministry of Science and Technology (2018YFD0901203); Natural Science Foundation of Guangdong Province (2018B030311050); Guangdong Basic and Applied Basic Research Foundation (2019A1515012042 and 2021A1515010430); Independent Project of Guangdong Province Laboratory (ZJW-2019-06); grant from the Guangdong Provincial Special Fund For Modern Agriculture Industry Technology Innovation Teams (2019KJ149); Department of Education of Guangdong Province (2018KTSCX090); Program for Scientific Research Start-Up Funds of Guangdong Ocean University.
Author Contributions
D.J. and G.L. conceived and designed the research; Y.H. (Yuanqing Huang), U.F.M., Y.H., C.Z., and W.Y. collected the sample and performed the experiment; Y.H. (Yuanqing Huang), C.T., H.C., and S.D. analyzed the data; Y.H. (Yuanqing Huang) and D.J. wrote the manuscript. All authors read and approved the final manuscript.
Data Availability
The raw genome and RNA sequencing data have been submitted to the Sequence Read Archive (SRA) database under Bioproject number PRJNA637812. The whole-genome sequence data have been deposited in the Genome Warehouse in National Genomics Data Center, Beijing Institute of Genomics (China National Center for Bioinformation), Chinese Academy of Sciences, under accession number GWHAOSK00000000.1. It is publicly accessible at https://bigd.big.ac.cn/gwh (last accessed May 9, 2021).
Literature Cited
Author notes
Yuanqing Huang, Umar Farouk Mustapha, contributed equally to this work.
