


Abstract
In biotechnological industry, increased expression cassette stability and copy number serve as important means of maintaining consistently high production levels of heterologous proteins in Saccharomyces cerevisiae. In this study, we combined δ sequences for site-specific integration with TPI1 gene from Schizosaccharomyces pombe (POT1) as a selection marker to realize high-copy integration and stable expression of heterologous proteins in S. cerevisiae. With the newly developed POT1 platform, a 32-copy integration of enhanced green fluorescent protein (EGFP) expression cassette was obtained in a single round and was stably maintained after 100 generations of growth in a rich complex medium. Talaromyces emersonii cellobiohydrolase I gene was synthesized with S. cerevisiae codon bias and expressed under the control of TPI1 promoter and terminator via POT1-mediated δ-integration; the highest specific activity yielded 238 mU g−1 of dry cell weight when p-nitrophenyl-β-D-cellobioside was used as substrate, whereas the highest activity in cellulose hydrolysis reached 67% Avicel conversion. POT1-mediated δ-integration produces high protein levels over a wide dynamic range and enables broad applications in metabolic engineering and synthetic biology.
INTRODUCTION
As an expression host, the eukaryotic yeast Saccharomyces cerevisiae offers advantages of post-translational modifications, tolerance to harsh environment conditions and ease of genetic manipulation (Hasunuma and Kondo 2012; Liu et al.2012; Bae et al.2015). Thus, S. cerevisiae is widely applied in the production of various medically and industrially valuable heterologous proteins (den Haan et al.2013; Nielsen 2013).
For heterologous gene expression in yeast, the primary concern is the selection of desirable expression vector. In S. cerevisiae, 2μ-based episomal plasmids are maintained at around 5–30 copies per cell; these plasmids facilitate strong gene expression (Kim, Yoo and Kang 2015) but are usually unstable and possibly irretrievable after prolonged cultivation under non-selective conditions (Shi et al.2014). A common strategy for increasing integrated copy number of desired genes is by using δ sequences as target sites in yeast genome for homologous recombination (Oliveira et al.2007; Yamada et al.2010; Shi et al.2014). δ sequences are long terminal repeats in yeast retrotransposon Ty1, and they are essential for transposon insertion in genomic DNA. Yeast genome contains 425 copies of δ sequences, which are all associated with Ty1 transposon or act as independent elements (Liu et al.2013). Appropriate selection markers, such as antibiotic resistance gene (neor) (Wang, Wang and Da Silva 1995) and auxotrophic markers (LEU2-d, HIS3, TRP1 and URA3), (Lee and Da Silva 1997; Moon et al.2016) exhibit superiority in systems for selecting multicopy integrants. For instance, KanMX4 gene modified by error-prone polymerase chain reaction (PCR) was used as a selective marker for multicopy integration, and the developed system enables integration of 3–10 copies of the module in S. cerevisiae genome (Semkiv, Dmytruk and Sibirny 2016). Another integration construct was designed and integrated into chromosomal δ sequences by repetitive transformation, which resulted in 1–6 copies of the integration construct per genome (Shi et al.2014). False positive of G418 selection and low integration efficiency of auxotrophic markers disfavor generation of high-copy integrations (Wang, Wang and Da Silva 1995; Liu et al.2013). Recently, the Cas9/CRISPR system was applied to multiple integration of expression cassettes without the use of any selection markers in S. cerevisiae. In the present study, an 18-copy integration of a 24-kb pathway was achieved in a single round, which was shown to be particularly efficient in construction of integrants carrying several different expression cassettes at multiple target sites (Shi et al.2016). However, combining high-copy integration and stable expression remains a challenge. Recent studies discovered that POT1 can be used as a gene marker in episomal plasmids to promote heterologous protein expression in S. cerevisiae (Hou et al.2012; Liu et al.2012; Tang et al.2013). This discovery inspired the use of POT1 as a selective marker to generate powerful selection pressure in δ sites of S. cerevisiae chromosome to increase integration efficiency and integrated copy number of heterologous genes. The TPI1 gene codes for triose phosphate isomerase of the glycolytic pathway; deletion of this gene impairs cell growth with glucose as the only carbon source. Foreign POT1 gene from Schizosaccharomyces pombe may not function well in an alien host cells and therefore may necessitate higher copy numbers in δ sites to complement host cell defects. The POT1 gene on an integration cassette allows the use of endogenous TPI1 promoter and TPI1 terminator (control regions showing no homology with POT1) for the expression of commercially important genes on the same vector. TPI1 promoter and terminator may be triggered more often in tpi1▵ strain. Thus, other events regarding post-transcriptional regulation may be involved and therefore affect protein production.
According to recent developments in cellulosic biofuel research, S. cerevisiae, a traditional ethanol-producing microorganism, is a potential host for consolidated bioprocessing (van Zyl et al.2007). Cellulose degradation requires three enzymes, namely, endoglucanases (EC 3.2.1.4), cellobiohydrolases (CBHs) (EC 3.2.1.91) and β-glucosidases (EC 3.2.1.21) (den Haan et al.2013). Among these enzymes, expression levels of CBHs in S. cerevisiae are relatively lower compared with the other two enzyme types (Ilmen et al.2011). Therefore, relatively high productivity of CBH is required for the construction of yeast strains that converts cellulose to ethanol. By functional expression in S. cerevisiae, Ilmén et al. screened 14 cbh1 (Cel7A) and 10 cbh2 (Cel6A) encoding genes that are of ascomycetous origin. The most successful combination, Sc [TeCBH1-TrCBM-C and C.l.cbh2b], resulted in 23% Avicel conversion (Ilmen et al.2011). Bao et al. enhanced the secretion of Talaromyces emersonii CBHI by secretory pathway engineering, and the highest activity obtained in quadruple-modified strain vps10▵/pmr1▵/SSO1/PDI1/cel7AF totaled 78.5 mU g−1 (Xu et al.2014).
In this study, an integration construct was designed and integrated into chromosomal δ sites by transforming TPI1 deletion strain; this construct contained a selectable marker (POT1 gene) and a target gene controlled by TPI1 promoter. To demonstrate the performance of this system in overproduction of biochemical products from renewable resources, T. emersonii CBHI gene (Ito et al.2015) was efficiently integrated into the yeast genome by using POT1 system. With high efficiency and simplicity of POT1 platform, we envision the usefulness of this platform for high-copy and stable heterologous states of medically and industrially valuable proteins in S. cerevisiae.
MATERIALS AND METHODS
Strains and culture conditions
Table 1 lists strains and main plasmids used in this study. TPI1 gene in Saccharomyces cerevisiae BY4741 was deleted by short flanking homology method (Hegemann and Heick 2011) to generate S. cerevisiae SK1, which was cultivated in yeast–peptone–ethanol medium (10 g L−1 yeast extract, 20 g L−1 peptone, 10 mL L−1 ethanol and 0.5 g L−1 glucose). Yeast was cultivated in synthetic complete (SC) medium (6.7 g L−1 yeast nitrogen base without amino acids, 20 g L−1 glucose and 1.3 g L−1 amino acid mixture) and yeast extract–peptone–dextrose (YPD) medium (10 g L−1 yeast extract, 20 g L−1 peptone and 20 g L−1 glucose). SC medium and SC medium without uracil (SC-Ura medium) were used to select transformants. Escherichia coli DH5α was used for amplification of recombinant plasmids in Luria–Bertani medium supplemented with 100 μg mL−1 ampicillin (Liu et al.2014).
Characteristics of yeast strains and main plasmids used in this study.
| Plasmids and strains | Relevant features | Origin |
|---|---|---|
| S. cerevisiae strains | ||
| BY4741 | MATa his3Δ1 leu2Δ0 met15Δ0 ura3Δ0 | EUROSCARF, Frankfurt, Germany |
| SK1 | MATa his3Δ1 leu2Δ0 met15Δ0 ura3Δ0 tpi1::loxP | In this study |
| SK3 | SK1 strain with linearized pBS5 δ-integrated | In this study |
| SK4 | BY4741 strain with linearized pBS6 δ-integrated | In this study |
| SK5 | SK1 strain with CBHI expression cassette δ-integrated | In this study |
| SK6 | SK1 strain with POT1 δ-integrated, as the control strain | In this study |
| S. pombe strains | ||
| FY7507 | − | EUROSCARF, Frankfurt, Germany |
| Plasmids | ||
| pBS5 | TPI1 promoter, EGFP, TPI1 terminator, pBluescript II SK (+) plasmid with POT1 gene from S. pombe as a selection marker by δ-integration | In this study |
| pBS6 | TPI1 promoter, EGFP, TPI1 terminator, pBluescript II SK (+) plasmid with URA3 gene as a selection marker by δ-integration | In this study |
| pBS9 | pUC19 with ALG9, EGFP genes used for qPCR standard curve analysis | In this study |
| pBS12 | pBluescript II SK (+) plasmid with POT1 gene from S. pombe as a selection marker by δ-integration | In this study |
| pBS17 | TPI1 promoter, CBHI, TPI1 terminator, pBluescript II SK (+) plasmid with POT1 gene from S. pombe as a selection marker by δ-integration | In this study |
| pBS20 | pUC19 with ALG9, CBHI genes used for qPCR standard curve analysis | In this study |
Plasmid construction
Table S1, Supporting Information, shows primers for PCR, corresponding template sources for amplification and restriction sites. Plasmid pBluescript II SK (+) was used as backbone of δ-integration vector. δ-integration plasmids pBS5 and pBS6 were constructed, as shown in Fig. 1B. The unique XhoI site within the δ sequence was used for plasmid linearization prior to transformation. Biotech company (Genewiz, SuZhou, China) was used to synthesize synthetic and non-glycosylated leader Yap3-TA57 (Liu et al.2012) fused with codon-optimized Talaromyces emersonii CBHI (GenBank AAL89553) and carried by pUC57-Yap3CBHI plasmid (Table S2, Supporting Information). Considering the rapid decline in integration efficiencies and integrated copy number with integrated donor DNA size (Shi et al.2016), the fundamental vector for CBHI gene δ-integration was designed as follows. Three DNA fragments (δ1, POT1 gene and δ2) amplified from pBS5 with primer pairs delta1-F/delta1-R, POT1-F/POT1-R and delta2-F/delta2-R, respectively, were fused together by fusion PCR (Zhou et al.2012); the fused fragment was then ligated into SacI/XhoI-digested pBluescript II SK (+) to generate pBS12. The CBHI gene amplified from plasmid pUC57-Yap3CBHI was ligated into SacII/PstI-digested pBS5 to generate pBS11. PCR products containing TPI1 promoter and terminator controlling CBHI expression were obtained by PCR from pBS11 with the primer pair E-CBH1-F/E-CBH1-R and ligated into NdeI/NcoI-digested pBS12 to generate pBS17 (Fig. 1B). CBHI expression cassette for chromosomal integration was amplified from pBS17 with primer pair deltaF-2/deltaR-2 and adopted as donor DNA.
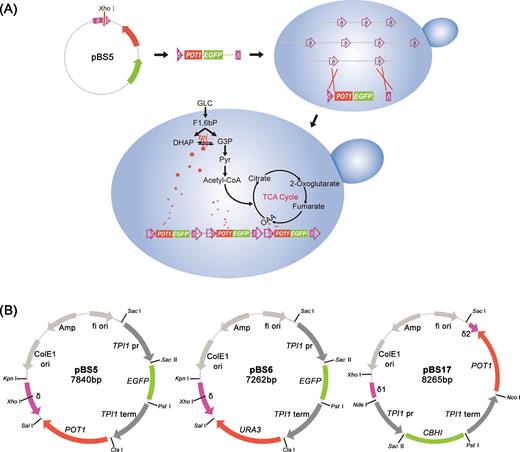
Integration and construction of integration plasmids. (A) Schematic representation of POT1-mediated δ-integration strategy. (B) δ-based multicopy integration plasmids combined with POT1 or URA3 selection markers.
Fluorescence microscopy and flow cytometry analysis
For fluorescence microscopy, transformed yeast cells were observed on selective plates with a Carl Zeiss microscope (Zeiss, Hallbergmoos, Germany). Fluorescence intensity of enhanced green fluorescent protein (EGFP) was measured by flow cytometry using FACSCalibur flow cytometer (BD Biosciences, Franklin Lakes, USA). Briefly, all fluorescent colonies expressing EGFP on selective plates were co-cultivated either in SC medium (POT1-derived strains) or SC-Ura medium (URA3-derived strains) at 30°C in a test tube and shaken at 220 rpm for 48 h. Cells were washed and resuspended in phosphate-buffered saline at an optical density of 0.1. Cells devoid of EGFP were used as non-fluorescent control.
Measurement of fluorescence intensity of EGFP
After 24 h culture at 220 rpm, 250 μL of culture broth was transferred to a 96-well analysis plate for detection. Using a Multi-Detection Microplate Reader (PerkinElmer, Waltham, USA), fluorescence intensity of EGFP was measured at 509 nm after excitation at 395 nm. Cell growth was monitored at 600 nm with 752 UV/Vis Spectrophotometer (Jinghua, Shanghai, China) to calculate specific fluorescence from OD600.
Quantitative PCR
Copy number was quantified by comparing Ct values of target and reference genes using a previously described method (Shi et al.2014). Plasmid pBS9 containing one copy each of EGFP and ALG9 was adopted as template for EGFP/ALG9 quantitative polymerase chain reaction (qPCR) standard curve analysis. Target EGFP gene was amplified using the primer pair QEGFP-F/QEGFP-R, whereas reference ALG9 gene was amplified using the primer pair QALG9-F/QALG9-R (Table S1, Supporting Information). Similarly, plasmid pBS20 containing one copy each of CBHI and ALG9 was adopted as template for CBHI/ALG9 qPCR standard curve analysis. Target CBHI gene was amplified using the primer pair QCBH1-F/QCBH1-R. Cycling conditions were set at an initial step of 95°C for 30 s, followed by 40 cycles of 5 s at 95°C, 30 s at 55°C and 30 s at 72°C. A CFX Connect Real-Time PCR Detection System (Bio-Rad, Hercules, USA) was used for melting curve analysis and qPCR analysis.
Stability analysis
The strains with different copy numbers were subcultured to confirm integration and expression stability of the proposed novel strategy. For start-up of subculture, strains were incubated at an initial OD600 of 0.1, and 1% culture was transferred to 5 mL of YPD medium when cells reached late log phase to prevent growth of undesirable ethanol-consuming mutants. Subsequently, 100 generations of subculture were prepared. Strains of primary, 50 and 100 generations were used as seeds for cultivation and analysis.
Enzyme assay
Yeast cells were incubated in 40 mL YPD medium or SC medium for 48 h at 30°C. Cells were centrifuged at 3000× g for 5 min at 4°C, and supernatants were used as crude enzymes for activity assay. p-Nitrophenyl-β-D-cellobioside (pNPC) was used for CBHI activity assay as previously described (Xu et al.2014). One unit of CBHI activity was defined as the amount of enzyme required for the production of 1 μmoL p-nitrophenol in 1 min at 50°C. Dry cell weight (DCW) was measured by filtering a known volume of culture broth through a 0.45 mm nitrocellulose filter and weighing the dry filter afterward.
For CBHI protein analysis, yeast cells were incubated in 40 mL YPD medium or SC medium for 72 h at 30°C. Supernatants of YPD fermentation broth were directly used as protein samples, whereas the concentrations of SC supernatants were doubled, then used for protein analysis. Protein samples were separated by electrophoresis on precast 10% Tris glycine sodium dodecyl sulfate polyacrylamide gel electrophoresis (SDS-PAGE) gels and visualized with silver staining.
The amount of CBHI activity on a polymeric insoluble substrate was expressed as the percentage of Avicel hydrolyzed, as previously described (Ilmen et al.2011). Amounts of glucose released at 24 and 48 h incubations were determined using Glucose Assay Kit II (Eton Bioscience, USA).
RESULTS
POT1 system enables explicit selection of high-copy integrations
In the present study, the reporter EGFP gene, which is controlled by TPI1 promoter, enabled readout of heterologous protein expression for the evaluation of integration efficiency and expression stability. We observed from preliminary assay that improving levels of linearized donor DNA promoted integration efficiency (data not shown). To this end, integrations with three different amounts of donor DNA (1-fold (300 ng), 5-fold and 10-fold) were carried out in this study. Transformation and integration efficiencies between new and conventional strategies were compared, and results are presented in Table 2. A large number of transformants from conventional δ-integration were obtained in three plates with different amounts of linearized donor DNA. However, few extremely large transformants were obtained in plates containing the POT1 system. To verify EGFP expression in Saccharomyces cerevisiae, transformed yeast cells on selective plates were observed with a fluorescence microscope. Interestingly, higher fluorescence level was detected in POT1-derived strains than in URA3 (Fig. S1A, Supporting Information). In further investigation, parallel integration efficiencies were observed for POT1 and URA3 systems during chromosomal integration. All fluorescent colonies per condition were further selected for co-cultivation and were inspected by flow cytometry. Fluorescence intensity of EGFP was markedly higher in POT1 populations compared with that in conventional δ-integration (Fig. S1B, Supporting Information).
Comparison of transformation and integration efficiencies between new and conventional strategies.
| Donor DNAa | Total clone no. | Frequency (×10−7)b | Clones with expected integration (%) | |
|---|---|---|---|---|
| URA3 | 1× | 71 | 44.4 | 97 (29/30) |
| 5× | 159 | 99.4 | 93 (28/30) | |
| 10× | 873 | 545.6 | 93 (28/30) | |
| POT1 | 1× | 5 | 3.1 | 100 (5/5) |
| 5× | 14 | 8.8 | 100 (10/10) | |
| 10× | 36 | 22.5 | 97 (29/30) |
Conventional URA3-mediated and POT1-mediated δ-integrations were carried out with 1-fold (300 ng), 5-fold and 10-fold linearized donor DNA.
Frequency is defined as the ration of the number of appeared clones of each plate to the number of cells initially spread onto agar plates and 1.6 × 10⁷ cells were used.
To demonstrate superiority of the POT1 system in integration of copy number and its explicit selection for high-copy integration, copy numbers of five random fluorescent colonies from POT1- and URA3-processed plates (10-fold) were determined using qPCR. As shown in Fig. 2B, the highest copy numbers obtained with POT1 and URA3 systems reached 32 and 6, respectively, with the former presenting a significantly higher average copy number. Specific fluorescence intensity of EGFP and growth curve analysis of fluorescent colonies were also determined. Specific fluorescence intensity of EGFP was significantly higher in POT1-processed strains in comparison with that in URA3 (Fig. 2A).
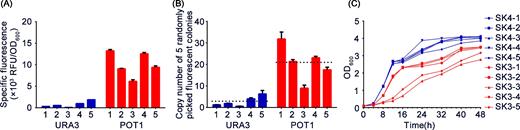
Comparison of POT1 system with conventional URA3-mediated δ-integration. (A) EGFP-specific fluorescence intensity. (B) Copy numbers of five random fluorescent colonies were determined by qPCR, and average copy number is depicted by the black dotted line. (C) Growth curve analysis of five random fluorescent colonies. Data are presented as means and standard deviations of triplicate measurements.
POT1 system exhibits superior integration stability
With high integration efficiency and copy number achieved by POT1 platform, we postulated that with available donor DNA and with POT1 as a selection marker, the rich complex medium may be a powerful selection pressure for cells that process δ-integration by homologous recombination. To test this postulate, structural stability of POT1-processed strains was analyzed in three different clones with different copy numbers: SK3-1 with 32 copies, SK3-2 with 21 copies and SK3-3 with 9 copies. Gene copy numbers of strains subcultured in rich complex medium for 50 and 100 generations were confirmed using qPCR. Figure 3A shows the unchanged copy numbers. Both EGFP-specific fluorescence intensity (Fig. 3B) and growth rate (Fig. 3C) were slightly higher in strains after serial subculture.
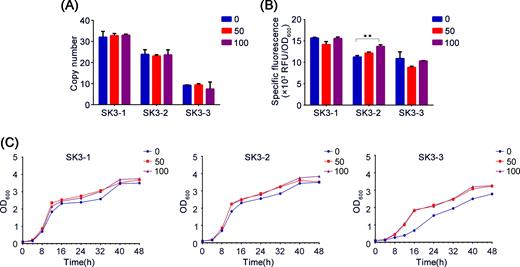
Integration stability analysis of EGFP expression strains. Copy number, EGFP-specific fluorescence and growth curve analysis of 0 (primary strains), 50 (strains after 50 generations) and 100 (strains after 100 generations) strains were evaluated. ‘*’ indicates statistically significant differences between primary strains and strains after serial subculture (n = 3, *P < 0.05, **P < 0.01, Student's t test).
High-copy, stable expression of CBHI via POT1-mediated δ-integration
To demonstrate utility and generality of the POT1 system in heterologous protein expression, Talaromyces emersonii CBHI gene was efficiently integrated into the yeast genome by using POT1 system. The SK5-3 strain displayed the highest specific activity of 238 mU g−1 DCW toward pNPC substrate (Fig. 4A), which also showed the highest copy number of 35 (Fig. 4B). As shown in Fig. 4A, YPD medium was also highly preferred in enhancing CBHI activity compared with the SC medium. SDS-PAGE analyses also confirmed that CBHI enzyme was abundantly produced in YPD medium relative to SC medium (Fig. 4C). Gene copy number, enzyme activity and growth rate of the strains subcultured in rich complex medium for 50 and 100 generations did not decreased similarly (Fig. 5).
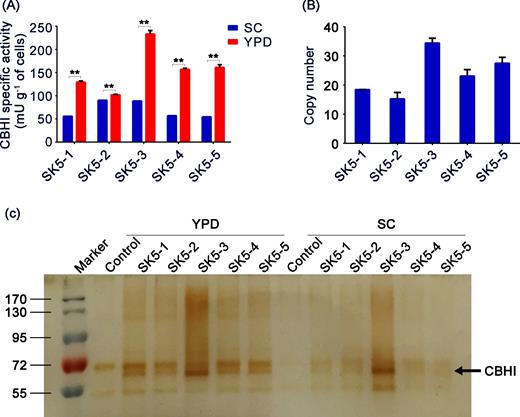
Enhanced secretion of CBHI via POT1-mediated δ-integration strategy. (A) Secreted CBHI-specific activities produced by recombinant strains expressing CBHI gene cultured in YPD medium and SC medium for 48 h. ‘*’ indicates statistically significant differences between strains cultured in YPD medium and SC medium (n = 3, *P < 0.05, **P < 0.01, Student's t test). (B) Copy numbers of recombinant strains expressing CBHI gene were determined by qPCR. (C) Reduced 10% Tris glycine SDS-PAGE of cell-free yeast culture supernatants (10 μL) visualized by silver staining. Molecular weight markers (170, 130, 95, 72 and 55 kDa) are shown on the left.
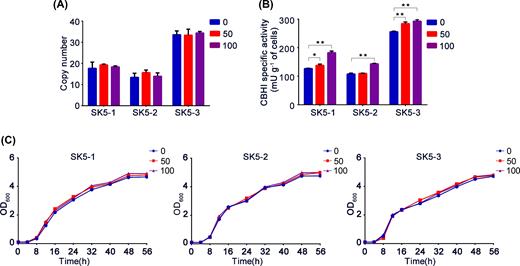
Integration stability analysis of CBHI expression strains. Copy number, CBHI-specific activities and growth curve analysis of 0 (primary strains), 50 (strains after 50 generations) and 100 (strains after 100 generations) strains were evaluated. ‘*’ indicates statistically significant differences between primary strains and strains after serial subculture (n = 3, *P < 0.05, **P < 0.01, Student's t test).
Efficient cellulose hydrolysis by CBHI-expressing yeast
To assess enzymatic hydrolysis of polymeric insoluble cellulose, secreted CBHI activity was measured by incubating the cell-free yeast culture supernatants with Avicel PH101 (Sigma-Aldrich, Milwaukee, USA) cellulose in the presence of β-glucosidases (Novozyme 188) to hydrolyze the cellobiose released from cellulose to glucose, followed by determination of the resulting reducing sugars formed. The most successfully integrated strain, SK5-3, resulted in 67% Avicel conversion (Fig. 6), and also showed the highest CBHI activity and protein yield (Fig. 4A and C).
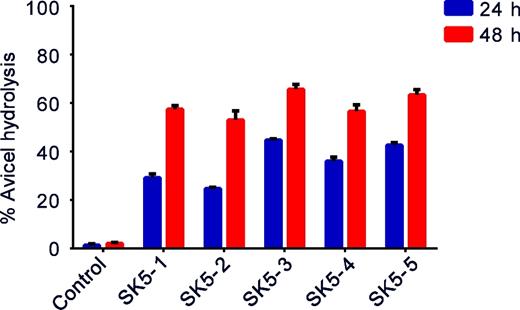
Percentage of Avicel hydrolysis by supernatants of recombinant strains expressing CBHI gene cultured in YPD medium for 24 and 48 h. The values shown are mean values of three repeats ± standard deviation.
DISCUSSION
Chromosomal engineering method based on δ-integration is widely used in yeast; however, combining high-copy integration and stable expression poses challenges (Kim, Rhee and Seo 2001; Yamada et al.2010; Shi et al.2014). In the present study, we demonstrated the ability of POT1-mediated integration in achieving such purpose with simplicity (Fig. 1A).
The benefits of our work are notable for significantly improving integration efficiency and integration copy number of heterologous genes. The reported integrated gene copy numbers from different systems are relatively variable (Liu et al.2013; Shi et al.2014; Moon et al.2016; Semkiv, Dmytruk and Sibirny 2016). In this study, a 32-copy integration of 7.8 kb donor DNA was achieved in a single round by the POT1 system (Fig. 2B). This integration was 5-fold higher than that achieved in URA3 method, thus highlighting simplicity and advantages of our system. Specific fluorescence intensities of EGFP were significantly higher in POT1-processed strains, indicating a positive correlation between copy number and heterologous protein expression in a certain range (Fig. 2A and B). Using high-copy integration vector is feasible in introducing optimal copy numbers for high-level expressions of recombinant proteins. Slower growth of POT1-processed strains shown in Fig. 2C possibly resulted from strong gene expression on yeast cells.
δ-integrated strains were highly stable even in nonselective medium (Kim et al.2001). However, copy number of genes integrated at δ sites may decrease by gene loop-out events owing to homologous recombination during long-term nonselective cultivation (Oliveira et al.2007; Shi et al.2014). To circumvent this disadvantage, improvements may be accomplished by changing culture conditions or using antibiotics for genetic selection; however, such conditions are not feasible in industrial applications and present biosafety concerns. Shi et al. deleted the RAD52 gene to prevent homologous recombination in Saccharomyces cerevisiae at the expense of poor growth and low final biomass for mutant strains (Shi et al.2014). This observation suggests the major problem of genetic instability in prolonged continuous fermentations for recombinant microorganisms. In this study, copy numbers of genes integrated at δ sites were stably maintained after 100 generations using the proposed novel integration method (Fig. 3A). Such high genetic stability is typical of integration strains and is important for industrial applications. Increased EGFP fluorescence intensity and growth rate of strains after serial subculture (Fig. 3B and C) may be a result of laboratory evolution, that is, the POT1 gene from alien hosts is more suitable in S. cerevisiae during long-term cultivation.
To demonstrate usefulness and generality of POT1 system in metabolic engineering, Talaromyces emersonii CBHI gene was integrated into BY4741 tpi1▵ strain by POT1-mediated δ-integration. The strain integrated with the highest copy number (up to 35) also showed the highest specific activity (238 mU g−1 DCW) and the highest protein yield. This observation strongly supports capability of POT1-mediated δ-integration to express high protein levels over a wide dynamic range. Maximum specific growth rate in YPD medium was higher than in SC medium (Hahn-Hagerdal et al.2005). Heterologous protein production also dramatically increased in recombinant S. cerevisiae cultivated in YPD medium compared with proteins obtained in a synthetic medium supplemented with auxotrophic requirements (Corbacho et al.2011); this phenomenon was also observed in our study (Fig. 4A and C). Unchanged gene copy number and growth rate of strains subcultured in rich complex medium for 50 and 100 generations indicated the remarkable stability with the novel integration strategy (Fig. 5A and C, respectively). In the POT1 system, the conventional rich complex medium posed selection pressure for stable expression of high-copy heterologous genes, increasing cell numbers and protein production. Increased CBHI-specific activity after serial subculture (Fig. 5B) may be a result of laboratory evolution, similar to that in EGFP-expressing strains.
High-level functional expression and secretion of CBHs enable non-cellulolytic organisms such as S. cerevisiae to utilize crystalline cellulose substrates. The difficulty of producing CBHs in sufficient quantities is considered a major obstacle in the development of yeast as a CBP organism. In this study, T. emersonii CBHI (Table S2, Supporting Information) was synthesized with S. cerevisiae codon bias and was expressed under the control of the TPI1 promoter and terminator via POT1-mediated δ-integration strategy. The highest activity in Avicel hydrolysis reached 67% (Fig. 6), thus highlighting the usefulness and generality of POT1-mediated δ-integration strategy in metabolic engineering.
In conclusion, we combined δ sequences for site-specific integration with an essential POT1 gene as selection marker to attain high-copy and stable expression of heterologous proteins in S. cerevisiae. We envision that our integration method will become an invaluable genome editing toolbox and a promising valuable tool for introduction and stable expression of heterologous proteins in S. cerevisiae for medical and industrial applications.
SUPPLEMENTARY DATA
Supplementary data are available at FEMSYR online.
Acknowledgements
We would like to thank Juan Qin from College of Life Sciences, Nankai University, for her excellent technical assistance.
FUNDING
This work was supported by the Tianjin Key Research Program of Application Foundation and Advanced Technology [17JCZDJC32200]; the Sino-Swiss Scientific and Technological Cooperation Project supported by the Ministry of Science and Technology of China [2015DFG32140] and the Research Program of Application Foundation and Advanced Technology of Tianjin [14JCYBJC43800].
Conflict of interest. None declared.
