


Abstract
We aimed to verify whether CD4+/CD25+ T cells suppress CD4+ T cells and secrete Granzyme B (GZB) during acute and chronic hepatitis C (CHC) infection. We enrolled 50 subjects: 20 patients with CHC (Group A), 15 healthy individuals (Group B), 10 patients with acute hepatitis C later evolved to persistent infection (Group C) and five patients who resolved hepatitis C virus infection during acute phase (Group D). We analysed, on enrolled subjects CD4+/CD25+ T cells and related GZB production as well as Annexin V activity. Patients from Groups A and C had higher frequency and function of peripheral Treg cells than healthy individuals. Groups A and C showed an increase in spot forming colonies (SFCs) of GZB compared with Group B (P < 0.01, Mann–Whitney U test). CD4+/CD25+ T cells in Group D had a lower number of GZB SFCs compared with Groups A and C but higher number than Group B (P < 0.01 Mann–Whitney U test). Annexin V production was higher in Groups A and C than B or D. Patients having acute and chronic hepatitis C have a higher Treg frequency and function in peripheral blood than healthy controls or those resolving the infection in acute phase secreting GZB, probably inducing apoptosis.
To underline a new mechanism of hepatitis C virus to suppress immune response during acute and chronic phase of infection.
Introduction
Hepatitis C virus (HCV) chronically infects more than 170 million people worldwide. The lack of a vigorous and multispecific Th1 network coupled to a weak cell mediated immune response have been addressed as important factors involved in the progression towards a persistent infection. In recent years several studies have highlighted the possible role of CD4+/CD25+ T regulatory (Treg) cells in controlling pathogenetic mechanisms implicated in the natural history of HCV related hepatitis (Cabrera et al., 2004; Perrella et al., 2006). In particular, it has been shown that elevated levels of CD4+/CD25+ T cells in peripheral blood characterize patients with chronic hepatitis C (CHC) and those with acute hepatitis who become chronic, dampening both the CD4+ and CD8+ autologous T cell immune response (Boettler et al., 2005; Rushbrook et al., 2005). Several mechanisms have been proposed to explain Treg cell activity: cytokine secretion [interleukin 10 (IL 10) and tumour growth factor β (TGF β)] or cell to cell mediated contact (Baecher Allan et al., 2001; Jonuleit et al., 2001). It has been found that Treg cells may also act through Granzyme B (GZB) secretion, suppressing autologous T cells (Gondek et al., 2005). GZB is a serine protease secreted mainly by natural killer cells and Cytotoxic Lymphocytes and is able to induce apoptosis of the target cell by cell to cell mediated contact (Lord et al., 2003; Grossman et al., 2004). The recent evidence of Treg cells’ ability to secrete GZB suggests that this T lymphocyte subset might be able to induce apoptosis to control the autologous CD4+ T cell response (Shevach et al., 2006). Accordingly, we aimed to investigate whether CD4+/CD25+ T cells suppressing autologous CD4+ T cells were able to secrete GZB and whether this production could have a role in chronic hepatitis natural history during the first phase of the infection. To better assess the ability of CD4+/CD25+ T cells to induce apoptosis, we also evaluated Annexin V production.
Patients and methods
Patients
The study was approved by the local ethical committee. The research included 50 subjects: 20 with CHC (Group A) and 15 healthy individuals (Group B); we also performed all experiments on frozen peripheral blood mononuclear cells (PBMCs, taken 1 week after the onset of jaundice) from 10 patients with acute hepatitis C later evolved to persistent infection (Group C) and five patients who resolved HCV infection after the acute phase (Group D, three males/two female; 38 ± 5 years). The inclusion and exclusion criteria for patients having CHC were as follows: (1) chronic liver disease histologically proven (at least 1 year before enrollment; Grading 6 and Staging 2; according to Ishack's score); (2) naïve for treatment with interferon (standard or pegylated) plus ribavirn or at least 1 year of washout from a previous therapy schedule without response; (3) negative clinical history of autoimmune disease or evidence of positive peripheral blood markers of autoimmune disorders (ANA, AMA, P ANCA, c ANCA); (4) absence of other chronic infections, such as hepatitis B virus or HIV; (5) absence of acute infection or reactivation of previous infections (hepatitis A virus, cytomegalovirus, Epstein–Barr virus, herpes simplex virus); (6) serum alanine aminotransferase (ALT) levels at least three times the upper limit of normal value (upper limit normal value < 40 IU mL−1); and (7) absence of alcohol or drug abuse. All healthy individuals enrolled in Group B were negative for autoimmune disorders or acute/chronic infection, according to blood donors centre screening. All virological assays were performed according to our previous experiences (Perrella et al., 2006). Inclusion criteria for patients in Groups C and D were according to our previous data (Perrella et al., 2006).
Biochemical and virological assay
ALT, aspartate aminotransferase (AST) and HCV RNA were evaluated in all patients. Liver function tests were performed in our centralized laboratory. HCV RNA qualitative and quantitative assays were executed using the Roche Diagnostic TaqMan RT PCR, with 20 IU mL−1 cut off according to the manufacturer's instructions.
Immunological assay
Treg cells
Enumeration of Treg lymphocytes was performed on freshly isolated PBMCs in Groups A and B and on frozen PBMCs in Groups C and D. T cells were studied by flow cytometry analysis (anti CD3+, anti CD4+, anti CD25+, anti CD45RO+−, anti CD62L, anti PD 1, CD8+; Beckman Coulter kit) labelled to the following fluorochromes [PE (R Phycoerythrin), fluorescein isothiocyante (FITC), APC (allophycocyanin), ECD (PE Texas Red), FITC, FITC] on a Beckman Coulter Profile flow cytometer system, according to literature evidence and our previous data (Demirkiran et al., 2006; Perrella et al., 2006; Longhi 2007). Anti CD25 was the FITC conjugated and the highest CD25 expression was established by gating on the fluorescence histogram on the basis of the maximum λ emission (525 nm), also according to the literature and our recent data (Demirkiran et al., 2006; Perrella et al., 2007). CD4+/CD25+ Treg cells were gated on CD3+ T cells to select only T lymphocytes and successively, in five patients randomly selected in Groups A and B and in two from Groups C and D, stained for forkhead/winged helix transcription factor (FoxP3) PE Cy5 (eBioscience) according to previous data (Perrella et al., 2006; Shevach et al., 2006). Although FOXP3 has been associated with activated Treg cells, we nonetheless performed a functional study, as it would not have been clear to identify CD25 subsets with suppressing activity based only on flow cytometry. We mainly assessed Treg cells’ ability to inhibit proliferation of autologous CD4+/CD25− T cells (anti CD3/CD28 stimulation – 1 : 2, 1 : 20 ratio) after immunomagnetic sorting (Dynal Biotech CD4+/CD25+ Treg Isolation Kit; Perrella et al., 2006). The purity and intensity of CD25 expression in positively selected lymphocytes used in functional studies were assessed by cytometry.
Briefly, CD4+/CD25+ T cells were isolated from PBMCs (at least 40 mL of blood in two separate samples within 24 h) in 20 randomized patients and healthy donors (10 Group A and 10 Group B) by using immunomagnetic beads CD4 negative selection followed by CD25 positive selection and CD45RA+ depletion, according to manufacturer's instructions (Dynal Biotech) and previous evidence to ensure the highest purity (Perrella et al., 2006, 2007). In particular, the purity reached by using this procedure was ≥ 95% when assessed by flow cytometry. We then performed three different set of experiments: (1) GZB ELispot assay; (2) Treg functional assay; and (3) Annexin assay under flow cytometry to evaluate apoptosis after HCV core antigen stimulation.
ELISPot assay
GZB assay in Groups A and B was performed on freshly isolated Treg cells (0.10–0.15 × 10⁴ per well) cultured with nonspecific stimulation with leukocyte phytohaemagglutinin (PHA L) (AID) and with a pool of HCV core antigens (AID) for 48 h, according to the manufacturer's instructions and previous evidence (Bolacchi et al., 2006). Briefly, 100 μL of both PHL A and HCV core antigens was added to 100 μL of suspended cells (0.10–0.15 × 10⁴ cells in RPMI plus fetal calf serum 10%; Bolacchi et al., 2006). The results were measured as spot forming colonies (SFCs). The same experiments were performed on patients from Groups C and D. Preliminary experiments were managed to set the optimal incubation period for ELISpot experiments. The plates were incubated at 37 °C, 5% CO2 for 40–48 h, after which the nonspecific antigen stimulation was stopped. The reaction was stopped by washing with tap water and the plates were dried and then video imaged to enumerate the number of spots per well using a BioReader 3000 (BioRad) according to previous experience (Perrella et al., 2010). We also evaluated IL 10 and TGF β production by isolated Treg cells to assess possible production of inhibitory cytokines as previously reported (Baecher Allan et al., 2001; Jonuleit et al., 2001), according to our previous experience (Perrella et al., 2008).
Treg cell purification and assay
To assay the activity of a purified cell subset, Treg cells (at least 0.25–0.5 × 10⁴ per well) were added to autologous CD4+/CD25− T lymphocytes at different ratios (CD25+/CD25− 1 : 1; 1 : 20). The two T cell populations were co cultured for 4 days in RPMI medium (Invitrogen) supplemented with antibiotics with 10% heat inactivated fetal bovine serum, in the presence of a T cell expander. Particularly, T regulatory cells were stimulated with CD3/CD28 (Dynabeads; Dynal Biotech) to maintain the original T cell function according to previous research (Perrella et al., 2006, 2007, 2008). The minimum was 200 c.p.m. in the absence of stimulation while 20 000 ± 3000 was the maximum CD4+/CD25− proliferation in the absence of Treg cells, calculated as mean c.p.m. × 103 subtracting the c.p.m. obtained in the absence of stimulation. Cells were seeded in 96 well round bottom plates and cultured in a humidified incubator at 37 °C and 5% CO2. At day 4, 3H thymidine [1 μCi per well (0.037 MBq per well)] was added for 16 h before proliferation was assayed. The same procedures were used for the other two conditions; all experiments were performed in triplicate. The ability of CD4+/CD25+ T cells to suppress was expressed as the percentage of inhibition of proliferation, calculated on the basis of c.p.m. difference when Treg cells were added to CD4+/CD25− T cells compared with CD4+/CD25− T lymphocytes cultured alone. Briefly, 285 c.p.m. was the minimum in the absence of stimulation while 19 000 ± 3000 was the maximum proliferation of CD4+/CD25− in the absence of Treg cells, calculated as mean c.p.m. × 103 subtracting the c.p.m. obtained in the absence of stimulation. By using FITC conjugated Annexin V (BD Biosciences) we tried to identify and quantify apoptotic cells on a single cell basis by flow cytometry. Briefly, the role of CD4+CD25+ Treg cells on apoptosis of CD4+CD25− T cells was assessed on frozen PBMCs of patients from each group by determining the percentage of Annexin V positive cells on day 1 and after 72 h of culture with or without Treg cells added directly to the target cells (Longhi et al., 2006).
Statistical analysis
Nonparametric statistical analysis was used and all descriptive data are expressed as median and range, while to assess significant differences and correlations of our results we decided to use the Mann–Whitney U test and Spearman's test. All tests were two tailed and significance was calculated using statistica–statasoft and graphpad prism 4.0 (Win32 system).
Results
Patients’ analysis
Patients in Group A showed an increase in their transaminase serum level, twice the normal upper limit. When we evaluated HCV RNA both qualitatively and quantitatively, positive results were seen (descriptive analysis of the demographic and standard laboratory assay of patients in Groups A–C is given in Table 1).
Patient data
| Group A | Group B | Group C | Group D | |
| Age (years, mean ± SD) | 45 ± 3 | 35 ± 4 | 41 ± 3 | 38 ± 5 |
| Gender | ||||
| Male | 12/19 | 10/15 | 7/10 | 3/5 |
| Female | 7/19 | 5/15 | 3/10 | 2/5 |
| HCV RNA (basal value) (U L−1 < 10) | 59.9 × 10³ | n.a | 55.3 × 10³ | 46 × 103 |
| Genotype | ||||
| 1a/1b | 15/20 | n.a. | 10/10 | 5/5 |
| Non 1a/1b | 5/20 | n.a. | ||
| Mode of infection | ||||
| Needle stick | 0/20 | n.a. | 0/10 | 0/5 |
| Surgical procedure | 0/20 | n.a | 2/10 | 2/5 |
| Unclear | 20/20 | n.a | 8/10 | 3/5 |
Group A, patients with chronic hepatitis C; Group B, healthy donors; Group C, patients with acute hepatitis C evolved to persistent infection; Group D, patients with acute HCV who resolved the infection.
Treg frequency and function
The frequency of CD4+/CD25+Bright T cells as an absolute cell count and as a percentage of the whole CD4+ T cell subset was assessed using flow cytometry (Table 2).
Treg frequency
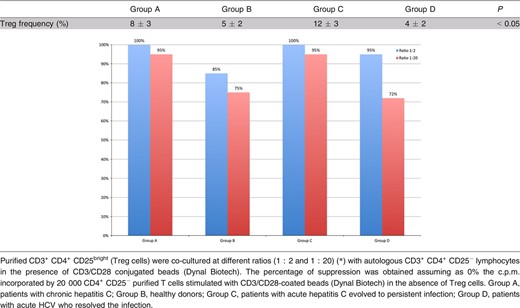
In all randomly selected subjects, CD4+/CD25+Bright T cells were FOXP3 positive. This was also observed when we stained frozen CD4+/CD25+Bright T cells in five randomly selected patients from Groups C and D, according to previous research (Fig. 1). When we compared the frequency of FOXP3+ with purified CD4+/CD25+Bright T cells, we did not find any statistically significant difference among Groups A, C and D while healthy individuals had a lower FOXP3+ frequency on T cells (Groups A, C and D had 90% CD4+/CD25+/FOXP3+ while in Group B this was just 25%, P < 0.001). CD25+/PD 1+ T cells were negative for Foxp3 staining and this subset did not show any statistically significant differences among the groups. Furthermore, CD8+/CD25+ T cells did not show any statistically significant differences in patients being infected or having been infected with disease resolution (Group A, 3.21 ± 0.2%; Group C, 2.9 ± 0.6%; Group D, 3.0 ± 0.5% of the gated cells). Nonetheless, they were significantly lower in those subjects in Group B (healthy donors) being 1.2 ± 0.4% of the gated cells (Mann–Whitney U test, P < 0.05). Patients having an evolving acute HCV infection or those with CHC had a higher frequency and function of peripheral Treg cells than healthy individuals and patients resolving hepatitis during the acute phase (Mann–Whitney U test, P < 0.05), according to previous evidence (Cabrera et al., 2004; Table 2). Although the number of patients in Group C was small for optimal statistical analysis, we tried to assess possible differences with respect to Groups A and B. Interestingly, we found that in those patients Treg cells were higher than in the other groups (Mann–Whitney U test, P < 0. 05; Table 2).
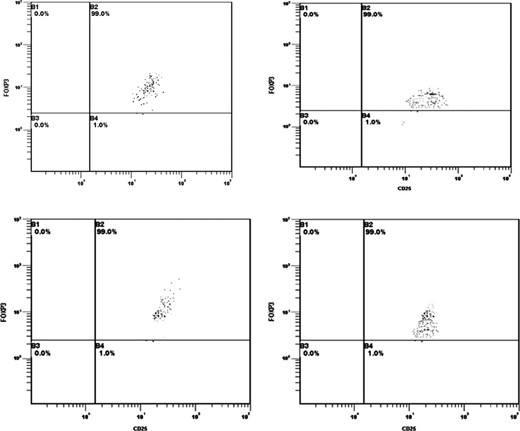
FOXP3 percentage of CD25+ cells after immunomagnetic sorting in Groups A–D.
Purified CD4+/CD25+ did not show any proliferation or had a low proliferation when stimulated with anti CD3/CD28 in all randomly selected patients, according to previous evidence, highlighting that these cells were not activated CD4+ T lymphocytes (Perrella et al., 2006; Longhi 2007). Furthermore, autologous CD4+/CD25− T cells when cocultured with purified CD4+/CD25+ T cells showed reduced proliferation, corroborating that our purified CD4+/CD25+ T cells were Treg cells. Nonetheless, patients suffering acute hepatitis C and evolving to persistent infection proved to have a stronger capacity to reduce the percentage of CD4+/CD25− T cells, as previously shown (Perrella et al., 2006).
ELISpot assay
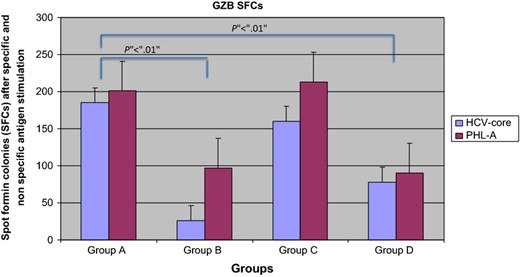
Purified Treg cells stimulated with HCV pool antigens (AID) and PHL A increases in GZB SFCs in the ELISpot assay compared with healthy individuals both for non specific (201 ± 63 vs. 97 ± 10 SFCs; z = 2.42; P < 0.01 Mann–Whitney U test) and for specific stimulation (87 ± 32 vs. 26 ± 10 SFCs; z = 2.42; P < 0.01 Mann–Whitney U test; Fig. 2). Frozen Treg cells from patients of Group C also showed a higher number of GZB SFCs (213 ± 23 SFCs after nonspecific stimulation and 160 ± 15 SFCs after HCV core antigen stimulation) than healthy individuals (P < 0.01) while no differences were found with respect to patients in Group A. CD4+/CD25+ T cells from Group D had a lower number of GZB SFCs compared with Groups A and C but higher than healthy individuals (90 ± 18 SFCs after nonspecific stimulation and 78 ± 12 SFCs after HCV core antigen stimulation; Fig. 2). Interestingly, those CD4+/CD25+ T cells expressing GZB were not positive for TGF β or IL 10 staining and vice versa. Indeed, Treg cells producing IL 10 and TGF β were respectively as follows: Group A vs. Group B; TGF β nonspecific stimulation (164 ± 23 vs. 78 ± 18 SFCs; P < 0.05 Mann–Whitney U test) and specific stimulation (103 ± 12 vs. 67 ± 14 SFCs; P < 0.01 Mann–Whitney U test); Group A vs. Group B; IL 10 nonspecific stimulation (183 ± 31 vs. 97 ± 12 SFCs; P < 0.05 Mann–Whitney U test) and specific stimulation (46 ± 12 vs. 31 ± 8 SFCs; P < 0.05 Mann–Whitney U test). Finally, TGF β and IL 10 were higher in Group C than Group D (TGF β = 76 ± 14 SFCs after nonspecific stimulation and 87 ± 9 SFCs after HCV core antigen stimulation; IL 10 94 ± 6 SFCs after nonspecific stimulation and 59 ± 8 SFCs after HCV core antigen stimulation).
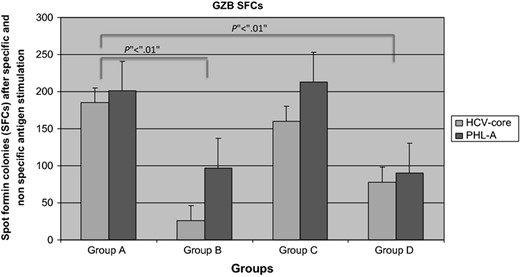
GZB SFCs in all studied Groups. Patients having (Group A) or evolving persistent HCV infection (Group C) had higher SFCs than those resolving (Group D) HCV infection in acute phase and healthy individuals (Group B).
Apoptosis
Flow cytometry results showed that the percentage Annexin V positive, after Tregs GZB addiction, was higher in patients with CHC and in those evolving to persistent infection than in resolved HCV infection in the acute phase and the control group (Fig. 3). These results were not confirmed in CD4+/CD25+ T cells producing IL 10 or TGF β.

Percentage of Annexin V+/CD4+/CD25− T cells before and after Treg addition. The percentage of Annexin V+/CD4+/CD25− T cells was determined by flow cytometry on days 1 and 3 of culturing with or without CD4+/CD25+ T cells in three patients, randomly selected, in each group. Results are expressed as mean ± SEM. Given the low number of samples, a correct statistical analysis, even nonparametric, was not possible. However, results showed that Annexin V positive CD4+/CD25− T cells increase when CD4+/CD25+ was added.
Conclusion
CD4+CD25+ T cells mainly function to control the strength of T cell immune responses in peripheral blood and at the infection site, particularly the T helper 1 (Th1) network (Sakaguchi, 2003; Belkaid & Rouse, 2005). Furthermore, this T cell subset also controls the magnitude of the immune response, suppressing pathological immune responses against microorganisms that may cause tissue damage (Oldenhove et al., 2003; Belkaid & Rouse, 2005; Raghavan & Holmgren, 2005). It has previously been shown that CD4+CD25+ T cells are early activated in patients with acute and chronic HCV (Cabrera et al., 2004; Boettler et al., 2005; Perrella et al., 2006), probably establishing a status of long lasting low activity of the Th1 network, critical to the survival of HCV (Cabrera et al., 2004; Boettler et al., 2005; Rushbrook et al., 2005). These Treg cells may act in several ways, including cytokines and cell to cell contact (Shevach et al., 2006). They may secrete GZB and this molecule is crucial for complete suppression of activity (Grossman et al., 2004; Gondek et al., 2005; Lieberman, 2003). Our study aimed to verify whether Treg cells secrete GZB and whether this production was altered in HCV infected patients. We found that purified CD4+/CD25+Bright had a suppressive function towards autologous CD4+/CD25− T cells and that they were GZB positive by ELISpot assay in a specific manner, in those patients evolving or having CHC according to previous evidence. However, even if an increased regulatory function has been found in patients in Groups A and C at proliferation assay, we found that FOXP3+ was expressed on CD4+/CD25+Bright T cells in all subset of patients but not in healthy donors. This might suggest that FOXP3 persists once activated during the first phase of infection. This suggests that this marker is not optimal to predict the evolution of the immune response or disease outcome. Another interesting finding was related to CD8+CD25+. This cell subset, although increased compared with healthy donors, did not seem to differ among infected groups or those having been infected and later resolved. These data suggest that CD8+/CD25+ even if activated during HCV infection may not have a detrimental role in the natural history of the infection. When we evaluated GZB expression on CD4+/CD25+ T cells we found that this cytokine might indicate inhibitory or regulatory function during HCV infection, also being related to disease evolution. In fact, these CD4+/CD25+Bright GZB positive T cells were lower or absent in healthy individuals than in HCV positive patients when stimulated with nonspecific and HCV specific antigen. Interestingly, we also observed a strong GZB production in those patients with acute hepatitis becoming chronically infected later but not in those who resolved the infection. We also found that those CD4+CD25+ T cells producing GZB were not positive for IL 10 or TGF β in the ELISpot assay. These data suggest that GZB might play a role in Treg function in the early phase of the infection, possibly suppressing the HCV specific immune response and persisting during chronic infection. In particular, it would seem that induced CD4+/CD25+ GZB positive T cells do not exert their function by cytokine activity as previously shown, but possibly directly throughout inhibitory/apoptotic mechanisms based on GZB. Indeed, to verify whether GZB was related to apoptosis we evaluated Annexin V expression and we found that it was higher in those patients having a higher GZB SFC count and evolving to CHC or having a persistent infection than in those resolving HCV infection in the acute phase, suggesting apoptosis as a possible mechanism by which CD4+/CD25+Bright/GZB+ T cells suppress the specific immune response.
The possible reason for this activation of Treg cells during acute and chronic HCV infection is not fully understood. It has been reported that Treg cells are triggered during several acute and chronic infections, probably due to the activation of the immune system. During HCV infection, several cell subsets are involved in the immune network and are influenced by the virus (Oldenhove et al., 2003; Belkaid & Rouse, 2005; Raghavan & Holmgren, 2005). In fact, we have recently shown that those patients not responding to antiviral treatment had an active replication of HCV in their PBMC subsets that show a reduced interferon γ production and function (Perrella et al., 2008). In the present paper, our results provide the first evidence, to our knowledge, of a possible role of GZB positive CD4+/CD25+ Treg cells in the natural history of chronic HCV infection. The sequence of events that may be related to our findings remains unknown. Nonetheless, we speculate that in those patients evolving and evolved to HCV persistent infection, Treg cells once triggered may secrete GZB, probably leading to uncontrolled apoptosis of activated CD4+ and CD8+ T cells, predisposing to chronic infection, coupled with a direct effect of the virus on the immune system. This hypothesis seems to be supported by our findings with Annexin V, being increased after culturing with CD4+/CD25+ T cells in those patients having an increase of GZB but not in those CD4+CD25+ T cells producing IL 10 or TGF β. The mechanisms underlying the delivery of GZB to the target cells might involve transmembrane pores made by Perforin and non specific charge interactions (Hori et al., 2002) but this requires further study. In conclusion, CD4+/CD25+Bright T cells with regulatory function secrete GZB during acute hepatitis in those patients who evolve to persistent infection, keeping this production also during CHC. The evidence of GZB positive Treg cells in these patients suggests that this T cell subset may take part in evolution of the persistent infection.
References
Perella et al. Studied the role of the activity of regulatory T cells (T regs) in the development of chronic hepatitis C in three unique sets of patients (acute, persistent, resolved). The authors have studied unique patients (acute, persistent and acute, resolved). Their results show increased T regs activity in acute and persistent infection, and increased apoptosis of T cells in presence of Granzyme B producing T regs, suggesting a mechanism of immune evasion by HCV.
Editor: Alfredo Garzino-Demo
