


Abstract
Chemical fertilization has a negative impact on the natural environment. Plant growth-promoting (PGP) rhizobacterial biofertilizers can be a safer alternative to synthetic agrochemicals. In this research, a culture-based method was used to assess the population size of rhizobacteria at the vegetative, flowering, and maturity stages of canola. Rhizobacteria were then isolated from each of the canola growth stages, and their seven PGP traits were determined. The highest abundance of culturable bacteria was found at the vegetative stage of the plants. Furthermore, four out of seven PGP traits were produced by the highest % of isolates at the vegetative stage. In the greenhouse experiment that included six rhizobacterial strains with best PGP traits, the greatest canola growth promotion ability under sterile conditions was observed after the introduction of Bacillus paralicheniformis 2R5. Moreover, under nonsterile conditions, 2R5 significantly increased canola growth. The presence of the trpA, B, C, D, E, F and pstA, and S genes in the 2R5 genome could be associated with canola growth promotion abilities. The chiA and mbtH genes could contribute to 2R5 antifungal activity against fungal pathogens. Moreover, the introduction of 2R5 significantly increased the abundance of the narG, nosZ, nifH, and nirS genes, which can prove that the 2R5 strain may be an important member of the soil bacterial community.
Introduction
Canola (Brassica napus L.) is one of the most significant oilseed crops and it is widely used as a source of oil for food and industrial applications (Raboanatahiry et al. 2021). Brassica napus L. is susceptible to many fungal diseases and insect pests, which results in its yield loss (Obermeier et al. 2022). It is well known that nitrogen (N) availability is a limiting factor in canola production (Riar et al. 2020). Low N use efficiency promotes excessive N chemical fertilization, which enhances crop production costs and has a negative effect on the environment (Calvo et al. 2019). Therefore, plant growth-promoting rhizobacteria (PGPR) improving plant development have been studied as biofertilizers to enhance crop productivity. The biofertilizers can promote plant growth through various mechanisms, e.g. phytohormone production, phosphate solubilization, siderophore sequestration, and atmospheric N fixation (Du et al. 2019, Chandran et al. 2021).
The genus Bacillus is one of the best-studied rhizobacteria for plant growth promotion (Hashmi et al. 2019). Bacillus sp. PG-8 was found to be an Arachis hypogea growth promoter (Gohil et al. 2022), while in another study, Bacillus subtilis L2 promoted the growth of Zingiber officinale Roscoe (Jabborova et al. 2021). There were reports where the application of Bacillus spp. inoculants increased plant growth through N fixation. For example, N2-fixing B. pumilus significantly increased maize dry biomass (Kuan et al. 2016). Furthermore, a consortium of Bacillus isolates increased plant growth and it was associated with the expression of nitrate (NO3−) and ammonium (NH4+) uptake genes in Arabidopsis thaliana (Calvo et al. 2019).
The aim of this study was to isolate and characterize the plant growth-promoting (PGP) properties of several rhizobacterial strains from three different stages of canola growth. Based on their biochemical traits, the strains were selected for a greenhouse experiment to assess their impact on canola growth. The strain showing the best performance, Bacillus paralicheniformis 2R5, was further subjected to whole-genome sequencing (WGS) to identify genes associated with its ability to promote canola growth and biologically control plant pathogens. Additionally, the effect of B. paralicheniformis 2R5 on the abundance of N-cycling genes in the rhizosphere of inoculated plants was investigated.
Materials and methods
Experimental site
Plant samples of canola (Brassica napus L. var. napus) were collected from the arable soil in Górsk (Poland 53°01′46.1′′N, 18°26′59.4′′E). Plants were sampled at the vegetative (R), flowering (2R), and maturity (3R) growth stages.
Isolation of canola rhizospheric bacteria
Canola roots were washed with sterile water to remove the adhering soil particles. The roots were cut into 2 cm pieces, macerated in sterile phosphate buffer (PBS), and subjected to a 10-fold serial dilution process. Each dilution was spread on nutrient agar (NA, BioMaxima, Warsaw, Poland) with 40 µg/ml antifungal agent amphotericin B for enumerating the culturable rhizospheric bacteria population. Plates were incubated for 3 days at 28°C. From each canola growth stage, 50 bacterial colonies were selected based on their different morphological parameters: shape, size, color, elevation, and capacity (Table S1), and were preserved in glycerol stocks at −80°C for further use.
PGP characteristics in vitro
Qualitative estimations
All the analyses were made in triplicate.
Phosphorus solubilization
Phosphorus solubilization ability was assessed using Pikovskaya’s agar plates (Pikovskaya 1948). Pikovskaya’s agar plates were incubated at 26 °C for 7 days for the observation of halo zones around the colonies. The solubilization index was evaluated as the ratio of total diameter (colony + halo zone) to colony diameter (Luziatelli et al. 2019).
Siderophore screening
Siderophore sequestration was estimated on chrome azurol sulphonate (CAS) medium (Alexander and Zuberer 1991). The CAS plates were incubated for 4 days at 26 °C for the observation of an orange halo zone around the colonies. The siderophore index (SI) was calculated as the ratio of the halo zone diameter to colony diameter.
Chitynolytic activity
To test the chitynolytic activity, bacteria were inoculated on a medium containing (g/l) peptone 1.0; FeSO4 . 7H2O 0.1; iron gluconate 0.1; yeast extract 0.1; colloidal chitin 7.0 g dry mass; and agar 15.0 (Swiontek Brzezinska et al. 2013). Plates were incubated for 14 days at 22°C to observe the clearing zone around the colonies. The colloidal chitin was prepared using the Lingappa and Lockwood method (1962).
Hydrogen cyanide test
Hydrogen cyanide (HCN) production was assessed using NA plates supplemented with glycine (0.44%) according to Lorck (1948). A sterile filter paper (Whatman No. 1) was soaked in a solution of picric acid (0.5%) and sodium carbonate (2%) and placed on the plate lid. After 4 days of incubation at 28°C, a color change of the filter paper from yellow to brown was considered a positive indicator for HCN production.
Ammonia production
Ammonia production was assessed by inoculating bacteria in nutrient broth (BioMaxima, Poland) for 3 days at 26°C. After adding the Nessler reagent (0.5 ml), the development of an orange color was considered as a positive result.
Quantitative estimations
All the analyses were made in triplicate.
Indole acetic acid production
Indole acetic acid (IAA) production was quantified using medium (g/l) peptone 5.0; yeast extract 3.0; and l-tryptophan 1.0 following the modified method of Ehmann (1977). After 4 days of incubation at 28°C, culture suspension was centrifuged at 10 080 g for 10 min. The supernatant was mixed with Salkowski reagent (2% 0.5 FeCl3 in 35% HClO4) and incubated for 30 min in the dark. Intensity of the color was measured at 530 nm using a Hitachi U-2500 spectrophotometer.
ACC deaminase activity
Quantitative estimation of ACC (1-aminocyclopropane-1-carboxylate) deaminase was carried out according to the modified method described by Honma and Shimomura (1978). Bacterial cultures were inoculated in a nutrient broth medium (BioMaxima, Warsaw, Poland) followed by incubation at 30°C for 24 h in a rotary shaker. Culture suspension (30 ml) was centrifuged at 6000 g for 10 min (4°C) and Dworkin and Foster (DF) salt minimal medium (5 ml) was added to the pellet (Dworkin and Foster 1958). Culture suspension was centrifuged again at 6000 g for 10 min (4°C) and DF salt minimal medium (5 ml) with 0.5 M ACC (30 µl) was added to the pellet. After incubation at 30°C for 24 h, culture suspension was centrifuged at 4032 g for 10 min (4°C) and bacterial cells were washed with 0.1 M Tris–HCl (5 ml; pH 7.6). After centrifugation at 10 000 g for 5 min, 0.1 M Tris–HCl (600 µl; pH 8.5), toluene (30 µl), and 0.5 M ACC substrate (20 μl) were added to the pellet followed by incubation at 30°C for 30 min. HCl at a concentration of 0.56 M (1 ml) was added and culture suspension was centrifuged at 10 000 g for 5 min. Centrifuged culture suspension supernatant (1 ml) was mixed with 0.56 M HCl (800 µl) and 0.2% 2,4-dinitrophenylhydrazine (300 µl). After a 30-min-long incubation at 30°C, 2 M NaCl (2 ml) was added and the absorbance was determined at 540 nm using a Hitachi U-2500 spectrophotometer. The ACC deaminase was expressed in terms of nanomoles of α-ketobutyrate produced per milligram protein per hour. Protein content was estimated according to the Bradford (1976) method.
16S rRNA gene sequencing
Genomic DNA of the six best-performing strains in the PGP tests was extracted using the GeneMATRIX Bacterial and Yeast Genomic DNA Purification Kit (EURx, Gdańsk, Poland) following the prescribed protocol. The 16S rRNA gene was amplified by PCR in a reaction mixture consisting of 1 U Taq DNA polymerase, 0.2 mM deoxynucleoside triphosphate mixture, Polbuffer B with 1.5 mM MgCl2, 0.25 µM of universal primers, and 1 µl of genomic DNA (total reaction volume of 20 µl). The following primers were used: 27F (5-AGAGTTTGATCCTGGCTCAG-3) and 1492R (5-TACGGTTACCTTGTTACGACTT-3; Kalwasińska et al. 2020). The thermocycling conditions were initial denaturation at 95°C for 3 min, 30 cycles of amplification (denaturation at 95°C for 30 s, annealing at 52°C for 20 s, and extension at 72°C for 1 min 40 s), and final extension at 72°C for 5 min. To check the PCR amplicons, 1% (w/v) agarose gel stained with Midori Green DNA Stain (Nippon Genetics Europe GmbH, Düren, Germany) was used. PCR products were sequenced using the BigDye Terminator v 3.1 Cycle Sequencing Kit (Applied Biosystems, Thermo Fisher Scientific, Waltham, MA, USA) with universal primers 27F and 1492R. This procedure was performed in accordance with the manufacturer’s procedure. Capillary electrophoresis was performed by the Sequencing and Oligonucleotides Synthesis Laboratory (IBB, Warsaw, Poland). The taxonomic affiliation of bacterial isolates was determined using the EzBioCloud online tool (Yoon et al. 2017).
In vivo pot experiment
Canola seeds (variety of Arazzo) were sterilized with 1% NaOCl for 30 min and were rinsed three times with sterile distilled water. The bacterial inocula were prepared in 10 ml of nutrient broth supplemented with 0.05 g carboxymethyl cellulose (CMC) to make a suspension of 108 CFU/ml. The disinfected seeds were added to the cell suspension and agitated for 30 min. Control seeds were treated with 10 ml of nutrient broth supplemented with 0.5% CMC without bacterial inocula (Rudolph et al. 2015).
The seeds were sowed in pots (four seeds per pot) in eight replicates for each treatment. The pots contained (i) sterile sand and vermiculite (1:1) or (ii) nonsterile soil taken from the field of Górsk (Poland 53°01′46.1′′N 18°26′59.4″E). The physicochemical soil parameters such as pH, the content of P2O5, K2O, Mg, N–NO3, N–NH4, and Corg were determined by the District Chemical and Agricultural Station in Bydgoszcz (Poland) (PN-ISO 10390: 1997, PN-R-04022: 1996, PN-R-04022: 1996/Az1: 2002, PN-R-04020: 1994/Az1: 2004, PN-R-04028: 1997, PN-ISO 14235: 2003). The plants were grown at 22°C with a photoperiod of 16/8 h (light/dark; 100 μmol/m2/s). The pots were moistened with an equal amount of water. The canola plants were harvested 44 days after planting.
After harvesting, the CCI of canola leaves was measured by a handheld meter (CCM-200 plus, Opti-Sciences, Inc, Hudson, NH, USA). Soil adhering to plant roots was washed with distilled water and canola morphological parameters, including roots, shoots, and epicotyl length, were measured. In the case of plants under nonsterile soil conditions, only length of roots and epicotyl were measured. Photosynthetic area of leaves was determined with the DigiShape 1.3 software (Moraczewski 2005). The plant roots, shoots, epicotyl, petioles, and leaves were dried at 85°C for 48 h to determine their dry weight. For nonsterile conditions, only the dry weight of plant roots, epicotyl, petioles, and leaves was determined. Two following plant growth indexes were calculated as follows: SLA (specific leaf area) = assimilation area (cm2) / dry biomass of leaves (g) and LWR (leaf weight ratio) = dry biomass of leaves (g) / total plant dry biomass (g) (Piernik et al. 2017).
The WGS of B. paralicheniformis 2R5
The whole genome of B. paralicheniformis 2R5 was sequenced at the University of Birmingham (UK) on Illumina HiSeq (Illumina Inc, San Diego, CA, USA) following the 250 bp paired-end protocol. Library preparation was carried out using the Nextera XT Library Prep Kit (Illumina, San Diego, USA) following the prescribed protocol with a slight modification (1 min PCR elongation time instead of 30 s long; 2 ng of genomic DNA instead of 1 ng). A microlab STAR automated liquid handling system (Hamilton, Switzerland) was used for DNA quantification and library preparation. Pooled libraries were quantified on a Roche LightCycler 96 qPCR machine (Roche, Basel, Switzerland) using the Kapa Biosystems Library Quantification Kit for Illumina platforms (Kapa Biosystems, Wilmington, MA, USA). Reads were adapter trimmed using the Trimmomatic 0.30 with a sliding window quality cutoff of Q15 (Bolger et al. 2014). De novo assembly was performed on samples using SPAdes version 3.7 (Bankevich et al. 2012), and contigs were annotated using the Prokka 1.11 (Seemann 2014). Further annotation was performed using the NCBI’s Prokaryotic Genome Annotation Pipeline (PGAP). KEGG (Kyoto Encyclopedia of Genes and Genomes) pathway analysis (https://www.kegg.jp/kegg/mapper/reconstruct.html) was used to predict the PGP genes. Biosynthesis gene clusters (BGCs) were detected using the antiSMASH (version 6.0; https://antismash.secondarymetabolites.org).
Biocontrol activities of B. paralicheniformis 2R5 against plant pathogens
Biocontrol activity of B. paralicheniformis 2R5 was assayed against seven plant pathogens, Alternaria alternata 783, Botrytis cinerea 873, Fusarium culmorum 2333, F. oxysporum 872, F. solani 25, Phytophthora cactorum 1925, and P. megasperma 404 all obtained from the Plant Pathogenic Bank of the Institute of Plant Protection in Poznan (Poland). Bacillus paralicheniformis 2R5 was grown on potato dextrose agar (PDA) for 24 h at 26°C. Fungi were grown on PDA for 5 days at 26°C and their 5 mm discs were placed in the center of PDA plates with a spread bacterial isolate. Diameter of fungal pathogens was estimated after incubating inoculated plates for 7 days at 26°C. Plates inoculated only with a fungi agar disc were used as control. Each experiment was performed in triplicate. The plant pathogen growth inhibition zone was calculated from the following equation: inhibition % = (diameter of fungi control − diameter of fungi that grew with bacteria) / diameter of fungi control × 100 (Wonglom et al. 2019).
Quantitative PCR
To quantify gene copies involved in N-cycle, including nitrogen fixing (based on nifH gene), nitrate reduction (narG), denitrification (nirS and nosZ), and ammonia oxidizing (amoA), quantitative PCR (qPCR) was performed. The qPCR reaction was carried out according to the method described in Kalwasińska et al. (2022) using 5.0 µl of SsoAdvanced Universal Inhibitor-Tolerant SYBR Green Supermix (2×), 2.8 µl of nuclease-free water, 0.6 µl of each primer (10 µM), and 1.0 µl of template DNA on a CFX Opus 96 Real-Time PCR System (Bio-Rad, Hemel Hempstead, UK).
DNA was extracted from samples of rhizosphere treated with B. paralicheniformis 2R5 and from samples of untreated rhizosphere from 0 to 44 days referred to as T0, T22, and T44 for days 0, 22, and 44, respectively (four replicates; 0.25 g of each) using a DNeasy Power Soil Kit (QIAGEN, Hilden, Germany) following the manufacturer’s instructions. The concentration of DNA was determined using the Qubit dsDNA HS Assay Kit (Thermo Fisher Scientific, Waltham, MA, USA). The soil DNA was further cloned into pCR4 TOPO vector (Invitrogen, Waltham, MA, USA) and was used as a control DNA for standard curve preparation. Target copy numbers were calculated from the standard curves, and the number of copies per gram of dry soil was determined. Standards, samples, and the negative control were amplified in triplicate. The efficiency of the qPCR assays was between 94% and 114%. The used primers and thermocycling conditions are present in the supplementary data (Table S2).
Statistical analysis
Differences between treatments in sterile conditions were tested with analysis of variance following the Tukey post-hoc test in Past v 3.25 (Hammer et al. 2001). The Shapiro–Wilk test was used to check the assumptions of normality, while Levene’s test was used to assess the homogeneity of variances. For non-normally distributed data, a test for equal medians (Kruskal–Wallis) was performed. To determine differences between noninoculated seedlings and seedlings inoculated with B. paralicheniformis 2R5 under nonsterile conditions, a t-test for equal means was applied.
Differences in copy numbers of genes involved in the N-cycle between plants treated with B. paralicheniformis 2R5 and nontreated plants at T0, T22, and T44 after bacterization were tested with a t-test for equal means in Past v 3.08. For non-normally distributed data, a test for equal medians (Mann–Whitney) was performed.
Results
Enumerating culturable rhizobacteria and characterization of PGP traits
The culturable rhizobacteria were enumerated at the vegetative, flowering, and maturity canola growth stages (Fig. S1). The highest population of culturable bacteria (P < .05) was found in vegetative stage (17.2 × 10³ CFU/ml) samples followed by samples at the maturity (15.9 × 10³ CFU/ml) and flowering (12.6 × 10³ CFU/ml) stages.
PGP traits of the rhizobacteria isolated from three different canola growth stages were determined (Table S3). At the vegetative stage, ACC deaminase, siderophores, HCN, and chitinases were produced by the highest % of isolates (96%, 72%, 9%, and 22%, respectively), whereas at the maturity stage, IAA (> 8 µg/ml), phosphates and ammonia were produced by the highest % of isolates (31%, 18%, and 47%, respectively; Fig. S2).
High values were observed in four out of seven tested PGP properties of the six strains: R27, R38, R44, 2R5, 3R27, and 3R43. Strain R27 produced a high concentration of IAA (24 µg/ml), solubilized phosphates (SI = 6), sequestrated siderophores (SI = 4.2), and was an HCN producer. Strain R38 showed high ACC deaminase activity (2174.2 nmol α-ketobutyrate/mg protein/h), IAA production (21.66 µg/ml), siderophore production (SI = 4.3), and HCN production. Strain R44 demonstrated a high concentration of ACC deaminase (1007.8 nmol α-ketobutyrate/mg protein/h) and IAA (12.01 µg/ml) and displayed high phosphate (SI = 7) and siderophore (SI = 4.3) production. Strain 2R5 had high ACC deaminase activity (2226.1 nmol α-ketobutyrate/mg protein/h), IAA (8.49 µg/ml), and siderophore (SI = 3.3) and chitinase (1 mm) production, whereas the 3R27 and 3R43 strains produced a high concentration of ACC deaminase (1314.4 and 1117.3 nmol α-ketobutyrate/mg protein/h), IAA (15.97 and 8.55 µg/ml), solubilized phosphates (SI = 4 and 4), and sequestrated siderophores (SI = 4.7 and 3.1), respectively.
Plant growth promotion in canola
Six rhizobacterial isolates were selected for molecular identification and a pot experiment under sterile conditions based on their PGP characteristics. These strains were identified as Pseudomonas sp. R27, P. atacamensis R38, Pseudomonas sp. R44, B. paralicheniformis 2R5, P. piscium 3R27, and P. brenneri 3R43. Under sterile conditions, canola plants inoculated with B. paralicheniformis 2R5 showed the highest shoot weight, leaf weight, and CCI with significant increases (P < .05) over the other inoculant treatments and uninoculated control (Fig. 1). Bacillus paralicheniformis 2R5 had a significant increase (P < .05) in leaf weight ratio compared to uninoculated control and other inoculant treatments, but not in the case of P. brenneri 3R43 (Fig. 1). No significant differences were observed for the following canola growth promotion parameters: weight (roots, epicotyl, petioles), length (roots, shoots), and specific leaf area (data not shown).
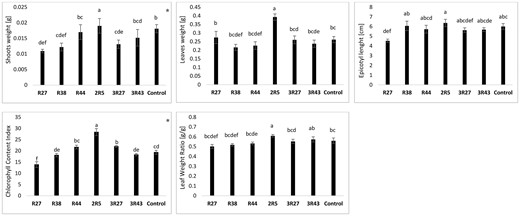
PGP effect of the selected isolates evaluated under sterile conditions. Different letters indicate significant differences (P < .05) between the means of the groups, determined using the Tukey HSD test as a post-hoc analysis; * denotes variables with a non-normal distribution (tested for equal medians using Mann–Whitney test). No significant differences were observed for the following canola growth promotion parameters: root weight, epicotyl weight, petiole weight, root length, shoot length, and specific leaf area.
Bacillus paralicheniformis 2R5 turned out to be the best-performing strain under sterile conditions. Therefore, 2R5 was chosen for a greenhouse experiment in nonsterile soil (Table 1) to check if it is still able to promote canola growth in the presence of native soil microorganisms. Under nonsterile conditions, seedlings inoculated with B. paralicheniformis 2R5 showed a significantly higher weight and length of roots, weight of leaves, and chlorophyll content index (CCI) compared to noninoculated seedlings. The physicochemical parameters of the nonsterile soil are shown in Table S4.
PGP effect under nonsterile conditions between seedlings inoculated with B. paralicheniformis 2R5 and those noninoculated seedlings.
| Parameter | Seedlings inoculated with B. paralicheniformis 2R5 | Noninoculated seedlings | t | P-value |
|---|---|---|---|---|
| Weight of roots [g] | 0.005 | 0.003 | 5.663 | .001** |
| Weight of epicotyl [g] | 0.005 | 0.004 | 2.237 | ns |
| Weight of petioles [g] | 0.005 | 0.003 | 2.413 | ns |
| Weight of leaves [g] | 0.011 | 0.008 | 2.935 | .026* |
| Length of roots [cm] | 14.15 | 9.15 | 8.771 | 1.23E-04*** |
| Length of epicotyl [cm] | 8.32 | 8.50 | −0.392 | ns |
| SLA (specific leaf area) [cm2/g] | 244.40 | 200.24 | 1.558 | ns |
| LWR (leaf weight ratio) [g/g] | 0.407 | 0.430 | −1.199 | ns |
| CCI (chlorophyll content index) | 13.80 | 10.42 | 6.352 | .001** |
ns—nonsignificant; significant differences (*P < .05, **P < .01, ***P < .001) according to the t-test; values for seedlings are expressed as mean (n = 8).
Ultimately, B. paralicheniformis 2R5 increased canola leaf weight and chlorophyll content as compared to uninoculated control both under sterile and nonsterile conditions. In addition, under sterile conditions, B. paralicheniformis 2R5 increased shoot weight and leaf weight ratio, while under nonsterile conditions, it increased the weight and length of roots. Bacillus paralicheniformis 2R5 effects on canola growth under sterile and nonsterile conditions are shown in Fig. S3.
Genome analysis and biocontrol activity
The WGS analysis of B. paralicheniformis 2R5 revealed a sequence read count of 491 153, a genome size of 4.55 Mb and GC content of 45.9%. The number of contigs was 78, while the N50 and L50 values were 456 496 and 4, respectively. The WGS analysis revealed 4749 genes and 94 pseudogenes. The genome assemblies and annotations are summarized in Table S5.
Bacillus paralicheniformis 2R5 harbored genes involved in IAA production, which include trpA, trpB, trpD, trpC, trpE, and trpF. Genes involved in phosphate solubilization (pstA, pstS), siderophore sequestration (mbtH), and chitinase production (chiA) were identified in the genome of B. paralicheniformis 2R5. Nitrogen fixation genes such as narG and nos were found in the 2R5 genome. The identified genes associated with plant growth promotion are present in Table 2.
Bacillus paralicheniformis 2R5 genes involved in plant growth promotion.
| Characteristics | 2R5 | Genes |
|---|---|---|
| IAA production | + | trpA, trpB, trpD, trpC, trpE, trpF |
| − | trpG, ipdC | |
| ACC deaminase production | − | acdS, acdA, rimM, dcyD |
| Phosphate solubilization | + | pstA, pstS |
| − | pstB, pstC, pqq | |
| Siderophore production | + | mbtH |
| − | pvd, fpvA, acrA, acrB, fhu, asbF, entD, fetB, fbpA, feoB | |
| HCN production | − | hcnA, hcn B, hcnC |
| Chitinase production | + | chiA |
| − | chiB, chiC, chiD | |
| Acetoin and butanediol synthesis | ||
| Nitrogen fixation | − | poxB, budA, budB, budC |
| + | narG, nosZ | |
| − | nirS, amoA, nifH |
+, positive result; −, negative result.
The BGCs nonribosomal peptide synthetases (NRPS; bacillibactin, fengycin, lichenysin, bacitracin), thiopeptides and RiPP-like (butirosin A / butirosin B), lanthipeptide-class-ii and cyclic-lactone-autoinducers (haloduracin β / haloduracin α), lassopeptide, CDPS, RiPP-like, terpene, and T3PKS were detected in the B. paralicheniformis 2R5 genome. Bacillus paralicheniformis 2R5 exhibited 100% similarity to gene type NRPS with the most similar known clusters of lichenysin and bacitracin. Bacillus paralicheniformis 2R5 inhibited growth of six plant pathogens with the highest inhibition rate of 24% and 20% against A. alternata and P. cactorum, respectively. The predicted secondary metabolite cluster genes of B. paralicheniformis 2R5 and its biocontrol activity are presented in Table 3.
Estimate of biosynthetic cluster genes and biocontrol activity of the B. paralicheniformis 2R5.
| Biosynthetic cluster genes | ||||||
|---|---|---|---|---|---|---|
| Region | From | To | Most similar known cluster | Type | Similarity | |
| Rg 1.1 | 217 680 | 240 141 | None | Lassopeptide | ||
| Rg 1.2 | 460 805 | 507 971 | Bacillibactin | NRP | NRPS | 53% |
| Rg 2.1 | 1 | 39 645 | Fengycin | NRP | NRPS | 66% |
| Rg 4.1 | 191 123 | 256 560 | Lichenysin | NRP | NRPS | 100% |
| Rg 5.1 | 237 721 | 258 470 | None | CDPS | ||
| Rg 6.1 | 112 577 | 122 921 | None | RiPP-like | ||
| Rg 6.2 | 217 154 | 300 043 | Bacitracin | NRP | NRPS | 100% |
| Rg 7.1 | 1 | 21 912 | Fengycin | NRP | NRPS | 20% |
| Rg 7.2 | 117 215 | 139 104 | None | terpene | ||
| Rg 7.3 | 192 252 | 233 349 | None | T3PKS | ||
| Rg 9.1 | 86 793 | 128 035 | Butirosin A / butirosin B | Saccharide | thiopeptide, RiPP-like | 7% |
| Rg 10.1 | 36 241 | 51 704 | None | siderophore | ||
| Rg 12.1 | 1 | 25 573 | Haloduracin β / haloduracin α | RiPP: lanthipeptide | Lanthipeptide-class-ii, cyclic-lactone-autoinducer | 40% |
| Rg 20.1 | 1 | 13 425 | Fengycin | NRP | NRPS | 20% |
| Inhibition of plant pathogens | ||||||
| A. alternata | B. cinerea | F. culmorum | F. oxysporum | F. solani | P. cactorum | P. megasperma |
| 24% | 13% | 18% | 19% | 17% | 20% | 0% |
Rg—region, NRPS—nonribosomal peptide synthetases, RiPP—ribosomally synthesized and post-translationally modified peptide, NRP—nonribosomal peptide.
Quantification of genes involved in the N-cycle
The copy number of N-cycle genes showed statistical differences between samples treated with B. paralicheniformis 2R5 and untreated samples (Table 4). Although there were no significant differences in the number of ammonia-oxidizing gene amoA, a significant increase in denitrifying nitrous oxide reductase gene nosZ at each time-point in the B. paralicheniformis 2R5-treated rhizosphere was observed. The copy number of nitrate-reducing gene narG and nitrite reductase gene nirS significantly increased at T0 and T44 in the treated rhizosphere, while N-fixing gene nifH was significantly higher than in untreated control at T22 and T44.
qPCR quantifications of genes involved in the N-cycle (copy number/gdry soil).
| Sample | nosZ | narG | nifH | amoA | nirS | ||||||||||
|---|---|---|---|---|---|---|---|---|---|---|---|---|---|---|---|
| Mean | P | t | Mean | P | t | Mean | P | t | Mean/Median | P | t/z | Mean | P | t | |
| CT0 | 3.79E+09 | 5.23E−05 | 18.31 | 1.39E+07 | .001 | 9.76 | 1.91E+06 | ns | 0.25 | 7.21E+05 | ns | 0.64 | 1.88E+06 | .006 | 5.42 |
| BpT0 | 6.88E+09 | 5.02E+07 | 2.02E+06 | 2.85E+06 | 5.24E+06 | ||||||||||
| CT22 | 7.53E+09 | .001 | 8.44 | 6.05E+07 | ns | 0.52 | 2.10E+06 | .026 | 3.45 | 1.08E+06nnd | ns | 1.57 | 1.40E+06 | ns | 0.06 |
| BpT22 | 1.25E+10 | 7.59E+07 | 4.76E+06 | 2.42E+06nnd | 1.42E+07 | ||||||||||
| CT44 | 8.23E+09 | .002 | 7.30 | 7.87E+07 | 2.26E-06 | 40.32 | 2.51E+06 | 3.43E-04 | 11.35 | 1.00E+06nnd | ns | 1.77 | 3.95E+06 | 4.42E-04 | 10.64 |
| BpT44 | 1.29E+10 | 1.04E+08 | 1.44E+07 | 2.50E+06nnd | 1.46E+07 | ||||||||||
ns—nonsignificant; nnd—not normal distribution (test for equal medians: Mann–Whitney); C—control, untreated plants; Bp—plants treated with Bacillus paralicheniformis 2R5; T0, T22, and T44—time after bacterization in days.
Discussion
A plant rhizosphere, an important ecological niche, teems with a rich tapestry of microorganisms, exerting a profound influence on plant physiology and morphology. These microbial communities hold the potential to stimulate plant growth and provide protection against harmful phytopathogens (Alawiye and Babalola 2019). Within the rhizosphere, microbial life thrives abundantly and exhibits heightened activity (Zhang et al. 2017).
Our research findings further shed light on the intricate dynamics of microbial communities within the rhizosphere, revealing variations in rhizobacteria density across different stages of plant growth. These disparities can be attributed to the differential production of secretions during various plant stages, thereby reshaping the structure of the rhizosphere microbiome. This remodeling process enhances the growth of specific community members while inhibiting others, as elucidated by the studies of Jacoby et al. (2020) and Vives-Peris et al. (2020). In a research conducted by Bashir et al. (2020), the endophytic population in sunflower (Helianthus annuus) was compared between its vegetative and reproductive stages. The researchers unveiled a decline in the culturable root endophytic bacteria during the reproductive stage, showcasing the intricate interplay between plant development and microbial inhabitants. Similarly, the work of Muñoz-Rojas and Caballero-Mellado (2003) highlighted a decrease in the population of Gluconacetobacter diazotrophicus with the aging of plants, potentially triggered by activation and intensification of plant defence mechanisms. In our research, the canola plants carried the largest population of culturable rhizobacteria at the vegetative stage (17.2 × 10³ CFU/ml) followed by the maturity (15.9 × 10³ CFU/ml) and flowering (12.6 × 10³ CFU/ml) stages. Marag and Suman (2018) enumerated culturable root endophytic bacteria from two different varieties of maize and at three different stages of the plant growth. A similar endophytic population size (× 103 CFU/ml) was observed; however, the highest size was observed at the flowering stage followed by the vegetative and then the maturity stage in both maize varieties (Marag and Suman 2018).
The remarkable microbial ecology of the rhizosphere is exemplified by the plant growth promoting abilities of some microbial species like phosphate-solubilization or indole-3-acetic acid (IAA) production by Bacillus spp. (Ribeiro et al. 2018). Among the diverse strains within the Bacillus genus, B. siamensis, B. cereus, and B. subtilis have emerged as notable producers of IAA, which is crucial for plant development, influencing cell elongation, and division (Wagi and Ahmed 2019; Widawati 2020). Intriguingly, the genomic analysis of B. paralicheniformis 2R5 unveiled the presence of trpA, trpB, trpC, trpD, trpE, trpF, and pstA and pstS genes, responsible for IAA biosynthesis and phosphate solubilization, respectively. The pst gene, encoding the phosphate transport pathway in bacterial genomes, assumes a pivotal role in enhancing phosphate bioavailability within phosphate-limited environments, thereby promoting plant growth (Nascimento et al. 2020). Świątczak et al. (2023) made a comparative genome analysis of the Brevibacillus laterosporus K75 genome and B. laterosporus MG64 genome published by Li et al. (2020). The analysis revealed that B. laterosporus K75 genome contained additional genes involved in phosphate transport pathways (pqq, pstA, B) and IAA production (trpA, B, C, D, E, F, S), suggesting that these genes were responsible for the B. laterosporus K75 stimulatory effect on maize plants (Świątczak et al. 2023). Our findings strongly support the notion that B. paralicheniformis 2R5 stmulates canola growth under both sterile and nonsterile conditions through its remarkable IAA and phosphate traits. The microbial ecology within the rhizosphere, with its diverse array of microorganisms and their intricate molecular interactions, continues to unveil the fascinating mechanisms underpinning plant–microbe interactions and holds immense potential for agricultural applications.
The microbial ecology aspect of B. paralicheniformis species becomes apparent in their remarkable ability to control pathogenic fungi through the production of secondary metabolites, as highlighted by Du et al. (2019). In our study, B. paralicheniformis 2R5 exhibited significant antifungal activity against a wide range of tested fungal pathogens, complemented by the identification of several biosynthetic gene clusters within its genome. These findings underscore the potential application of B. paralicheniformis 2R5 as a valuable tool for biological control of plant diseases. Our results align with another study where B. paralicheniformis MDJK30 emerged as a potential biocontrol agent. This strain displayed antifungal activity against F. solani, and similar gene clusters associated with secondary metabolites, such as lichenysin, fengycin, bacitracin, and bacillibactin, were identified in its genome (Du et al. 2019). As a member of PGPR, the 2R5 strain also exhibited the ability to produce chitinases and siderophores, as confirmed by the presence of the chiA and mbtH genes. These characteristics likely contribute to its heightened antifungal activity. In fact, previous research demonstrated that Bacillus subtilis F29-3, expressing the chiA gene, exhibited a larger inhibition zone against B. elliptica compared to a control strain of B. subtilis (Chen et al. 2004) that was lacking chitinase activity. Additionally, the mbtH protein is involved in siderophore mycobactin (Mbt) biosynthesis in Mycobacterium tuberculosis. This protein plays a crucial role in the functioning of nonribosomal peptide synthetases (NRPS), which are well known for their antimicrobial, immunosuppressant, cytostatic, and antiviral activities (Zwahlen et al. 2019). These discoveries reinforce the notion that B. paralicheniformis species possess robust capabilities in combating plant pathogens and providing further support for their application in disease management strategies.
The N dynamics in the context of plant growth and development is of paramount importance in microbial ecology (Anas et al. 2020). Studies have suggested that increased levels of N-cycle genes after soil inoculation with PGPR can have positive effects on plant growth and development by enhancing the availability of N (Bhattacharyya et al. 2018). Intriguingly, the introduction of B. paralicheniformis 2R5 resulted in a substantial increase in the copy number of genes such as narG, nifH, nosZ, and nirS. These findings align with the observations made by Bhattacharyya et al. (2018), who demonstrated that the PGPR Proteus vulgaris JBLS202 increased the abundance of N-cycle genes in the rhizosphere.
However, it is crucial to consider the specific actions of N-cycle genes. The nifH genes enable bacteria to fix atmospheric nitrogen (N2) into ammonia (NH3), which is readily assimilated by plants (Gresshoff et al. 2015, Dasgupta et al. 2021). On the other hand, the genes narG, nirS, and nosZ are involved in the denitrification process, which represents a significant nitrogen loss pathway in agricultural soils (Igiehon and Babalola 2018, Zhu et al. 2018). In our study, the presence of the nitrate-reducing gene narG and denitrification gene nosZ in the genome of B. paralicheniformis 2R5 was concurrent with notable changes in the abundance of N-cycle genes in the rhizosphere after treatment. It is noteworthy that the untreated samples also exhibited an increase in the abundance of N-cycle genes over time. Previous research has indicated that plants, through root exudates, shape the rhizosphere microbiome, thereby influencing the abundance and activity of N-cycle microbes, including nitrate reducers and denitrifiers (Henry et al. 2008, Weng et al. 2013). Furthermore, the rhizosphere environment can impact the copy number and relative abundance of functional genes. Wang et al. (2015) demonstrated that changes in the microbial community and network interactions within the rhizosphere contributed to alterations in functional genes responsible for nitrification efficiency in maize plants. Therefore, further research is warranted to elucidate the intricate interactions between the introduced B. paralicheniformis 2R5 and the native microbial communities. The modulation of N-cycle genes by B. paralicheniformis 2R5, along with the influence of the rhizosphere environment, holds significant implications for nutrient availability and plant growth promotion. Exploring these complex microbial interactions will provide valuable insights into optimizing plant–microbe interactions for sustainable agriculture.
Conclusion
This research paves the way for the development and implementation of innovative strategies harnessing the ecology of B. paralicheniformis for sustainable agriculture. The commercialization of preparations based on this species holds immense promise in promoting canola growth, boosting resistance to pathogens, and optimizing nutrient cycling dynamics. Further exploration of the intricate interactions between B. paralicheniformis 2R5 and the native microbial community will undoubtedly unveil new insights into the microbial ecology of canola-associated rhizobacteria and facilitate the development of effective bioformulations for agricultural applications.
Author contributions
Joanna Świątczak (Conceptualization, Data curation, Formal analysis, Investigation, Methodology, Project administration, Software, Validation, Visualization, Writing – original draft, Writing – review & editing), Agnieszka Kalwasińska (Methodology, Supervision, Validation, Writing – review & editing), Tamás Felföldi (Formal analysis, Investigation), and Maria Swiontek Brzezinska (Conceptualization, Project administration, Supervision, Validation)
Conflict of interest
The authors declare that they have no known competing financial interests or personal relationships that could have appeared to influence the work reported in this paper.
Funding
This research was supported by funds provided by Nicolaus Copernicus University (Toruń, Poland) to maintain research potential.
Data availability
The almost complete 16S rRNA gene sequences of R27, R38, R44, 2R5, 3R27, and 3R43 are available under the accession numbers MW599213, MW599214, MW599217, MW599219, MW599220, and MW599221, respectively. The whole-genome shotgun project of strain 2R5 has been deposited at DDBJ/ENA/GenBank under the accession JAOWAK000000000 (BioProject PRJNA876229, BioSample SAMN31236553).
