


Abstract
Primary succession and microtopography result in environmental changes and are important processes influencing the community assembly of soil fungi in the Arctic region. In glacier forefields that contain a series of moraine ridges, both processes contribute synchronously to fungal spatial diversity. To reveal the synergistic effects of succession and microtopography, we investigated the fungal community structure and environmental variables in the moraines of the Arklio Glacier, Ellesmere Island. The study sites were established at four locations from the top to the bottom of the ridge slope within each of the three moraine ridges of different post-glacial ages. The location-dependent community composition was equally diverse in both the initial and later stages of succession, suggesting that successional time could alter the effects of microtopography on the fungal community. Moreover, our results suggest that fungal communities at different locations follow different successional trajectories, even if they have passed through the same time lapse. Such a synergistic effect of succession and microtopography of moraines does not allow for parallel changes in fungal communities among moraines or among locations, suggesting that the moraine series contributes substantially to fungal spatial diversity in the glacier forefield.
Introduction
The most evident traces left behind by glaciers and ice sheets at mid- and high latitudes after deglaciation are the range of sediments and landforms, including corries, troughs, drumlins, and moraines (Benn and Evans 2010). Moraines are formed through the deposition of debris at the terminus of a glacier (Ottesen and Dowdeswell 2006), whereas large moraine ridges are formed through the accumulation of a large amount of debris when the terminal of a glacier remains stationary for a long period. Consequently, multiple moraine ridges formed during periods of colder climates (stadials) after the last glacial period are located similar to ripples, which is a common landscape in the glacier forefields of the Arctic. Therefore, a single glacier forefield can consist of heterogeneous local habitats depending on two different processes: (1) primary succession: each moraine is formed at a different age, and temporal changes affect the current biotic and abiotic components; and (2) microtopography: the shapes of the moraine ridges lead to differences in the microclimate of each location within a moraine, resulting in environmental and organismal heterogeneity.
Ecologists often establish a set of sites across different moraines as a representation of temporal sequences (chronosequences) to identify changes in the diversity and composition of plant and microbial communities along the line of primary succession (Chapin et al. 1994, Zumsteg et al. 2012, Brown and Jumpponen 2014). Studies using chronosequences have identified several successional trajectories that depend on the prevailing biotic and abiotic environmental factors (Svoboda and Henry 1987, Fastie 1995, Robbins and Matthews 2010). The most common trajectory is an increase in soil organic matter and vegetation development (Chapin et al. 1994, Mori et al. 2017, Mainetti et al. 2021), as well as changes in soil conditions such as water availability and pH, influencing the biological establishment (Sun et al. 2016, Dong et al. 2022). Soil microbial communities flourish and diversify in response to changes in soil properties and vegetation (Schipper et al. 2001, Rime et al. 2015, Jiang et al. 2018, Dong et al. 2022). This suggests a positive relationship between pedogenic processes and plant and microbial activities (Schipper et al. 2001, Bardgett et al. 2005).
The microtopography created by the shape of moraine ridges leads to differences in microclimate through soil freeze–thaw events or snow coverage (Williams and Smith 1989, Eichel et al. 2018), resulting in physiochemical heterogeneity of soil and biodiversity (Berry 1987, Vetaas 1997, Zumsteg et al. 2013). Conditions at the top of the ridge are harsh for organisms because of wind exposure and soil freeze–thaw events (Williams and Smith 1989, Vetaas 1994), whereas downslope, water flow creates a gradient of water and nutrient availability (Rastetter et al. 2004). Consequently, the concentrations of soil organic matter gradually decrease toward higher slopes (Berry 1987, Giblin et al. 1991, Sowiński and Lemkowska 2009). Such a soil sequence characterized by topography (toposequence) significantly alters not only the vegetation (Walker and Everett 1991, Kitagawa et al. 2022) but also the microbiota (Truong et al. 2019, Wojcik et al. 2020).
These facts imply that local ecosystem development in the Arctic glacier forefields is co-dependent on two different processes, succession and microtopography, which produce similar environmental gradients represented by the development of soil organic matter along the chronosequence and toposequence, respectively. The effect of each individual process on spatial biodiversity is well known; however, the effects of both horizontal and vertical gradients on spatial biodiversity are not well studied (Vetaas 1997, Wojcik et al. 2020), with no studies on the effects on fungal communities. To comprehend the contribution of moraines to spatial biodiversity in the ecosystem, a perspective on the synergistic effects of succession and microtopography is necessary. An integrated investigation using chronosequences and toposequences will help us address the following questions:
(i) Will variability in soil development within a moraine increase with moraine age? If so, do the fungal dissimilarities among locations increase within an older moraine than within a younger one?
(ii) Will the rate of soil development vary with location, and how will soil fungal communities respond to this variation? (i.e. will greater community successional changes occur in the location of the developed ground soil?)
(iii) Does the composition of fungi on chronosequence and toposequence show parallel trends along two similar soil organic gradients?
To answer these questions regarding the synergistic effects of succession and microtopography on spatial fungal diversity, we analyzed the changes in soil environment and fungal community diversity across moraines of different ages as well as across distinct locations within each moraine. In the forefield of the Arklio Glacier in Oobloyah Valley, Ellesmere Island, Canada, we selected the study sites at three different moraine ridges formed after the last glacial period (Okitsu et al. 2004) for chronosequence studies and at four different locations within each moraine ridge for toposequence studies.
Materials and methods
Study site and sampling design
The study area (area: 80.5°N, 82.5°W) is located in the proglacial area at the southern front of the Arklio Glacier in the Krieger Mountains near Oobloyah Bay, Ellesmere Island, Nunavut, Canada (Fig. 1A). According to climate data from the nearest weather station in Eureka (80.0°N, 85.5°W), the study region is characterized by a polar climate with low temperature and precipitation (Okitsu et al. 2004); mean temperatures of the warmest (July) and the coldest (February) months are 3.1 and −38.4°C, respectively. Mean annual temperature and mean annual precipitation are −18.4°C and 74.2 mm, respectively (from 2011 to 2015). Geographically, the site is characterized by a shallow valley with gentle slopes formed by permafrost and/or periglacial processes resulting from a long development time (Barsch 1981). The Arklio Glacier has glacial moraines that developed over different periods since the last glacial period (King 1981).
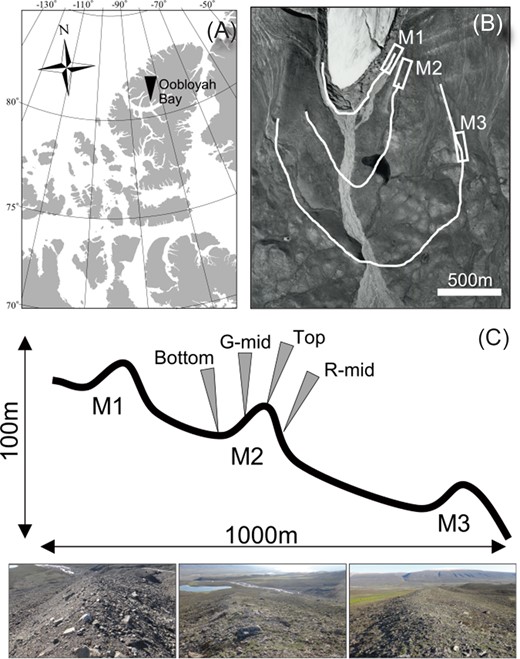
Map of study location. Location of study site in Ellesmere Island (A), map of the three moraines assessed in this study (B), and sampling designs and each moraine’s view (C).
In July 2022, line transects were established to collect samples from three moraine ridges (henceforth referred to as moraines) and four different locations within each moraine ridge (henceforth referred to as locations). Three moraines that formed after the last glacial period were selected (Fig. 1B). The moraines formed on the side of the glacier tended to be relatively smaller than the end moraines; however, the side moraines maintained their sharpness over time owing to little disturbance from the glacier-fed rivers (see Fig. 1B). The highest number of moraine ridges was almost 10–15 m from the bottom to the top. Okitsu et al. (2004) estimated that the youngest moraine (M1) was established during the Little Ice Age (400–250 years ago), whereas the middle moraine (M2) and the oldest moraine (M3) were established during the colder period after the Holocene (8000 years ago). Comparing the appearance of these moraines (Fig. 1C), the older moraines showed greater vegetation development. Gradients in vegetation development were also observed along the slopes of each moraine (i.e. a higher proportion of bare ground at the moraine-top site and increasing vegetation development toward the bottom). The line transects were located on the top, middle of the glacial side and outside (G-mid and R-mid, respectively), and bottom of the glacial side in each moraine (Fig. 1C). All transects ran parallel to the topographic contour lines, and we established sampling plots at at least 30-m intervals for a total of 36 quadrats (3 plots × 4 transects × 3 moraines).
Field and laboratory measurements
From each plot, we collected ∼20 g of soil samples from the O–A horizons (1–2 cm depth at this site) after removing slightly decomposed litter, including the Oi horizon (the top of the organic surface layer with subdivisions of fresh, undecomposed plant debris). Approximately 20 g of soil obtained using a trowel was passed through a sieve (<2 mm) to eliminate root tissue and homogenized. In some sites with little or no vegetation or organic deposition (e.g. the youngest moraine site), we collected soil from the surface layer and sieved it similarly to others. Soil (0.5 g) from the sieved samples was used to estimate the fungal community structure through DNA analysis. The soil samples for DNA analysis were collected into 2 ml tubes containing DNA/RNA Shield (Zymo Research, Irvine, CA, USA) using a sterile spoon and were stored below 5°C until DNA extraction. We determined the presence/absence of vascular plant species and measured the plant coverage (total vascular plants and moss) using visual estimation methods within a 50 × 50 cm quadrat placed directly on the sampling points.
The remaining samples from each quadrat were transported to the laboratory to measure abiotic environmental factors. We measured soil pH, electrical conductivity (EC), and the ratio of soil carbon (C) to nitrogen (N); the weight ratio of dried soil to sampled soil was used as a proxy for the water content of the soil. Approximately 15 g of sampled soil was weighed before and after oven drying at 60°C for 48 h. The dried soil samples were sieved to eliminate root tissue and then homogenized before pH and EC measurements. The pH and EC values of the dry soil sampled in water (soil:water weight ratio of 1:5) were measured using pH and EC meters (Twin pH and Twin Ec, HORIBA Ltd, Kyoto, Japan), respectively. The C and N concentrations in the sampled soil were measured using a CN analyzer (JM1000CN, J-Science Lab Co., Ltd, Kyoto, Japan). These samples were imported under post-entry quarantine at the Yokohama Plant Protection Station, with permission (Permit No. 4Y-272) from the Japanese Ministry of Agriculture, Forestry and Fisheries.
DNA extraction, polymerase chain reaction, and DNA sequencing
To characterize the fungal community structure, we analyzed the fungal DNA sequences in the soil samples collected from all quadrats by sequencing the internal transcribed spacer (ITS) region of ribosomal RNA using a MiSeq sequencer (Illumina, San Diego, CA, USA). Genomic DNA was extracted using a FastDNA SPIN Kit for Soil (MP Biomedicals, Santa Ana, CA, USA). We amplified the partial ITS regions using the primers ITS1F-KYO2 and ITS2-KYO2 (Toju et al. 2012), with Illumina overhang adaptor sequences attached to their 5′ ends. As per the manufacturer’s protocols (Illumina 2019), we performed polymerase chain reaction (PCR) amplification of the ITS region with the following thermal cycling program: an initial denaturation for 10 min at 94°C, followed by 35 cycles of denaturation for 20 s at 94°C, annealing for 30 s at 55°C, elongation for 20 s at 72°C, and a final extension for 7 min at 72°C. The PCR amplification was performed in triplicate, and the amplicons were pooled before performing index PCR using the Nextera XT Index Kit (Illumina). PCR products were purified using Agencourt AMPure XP (Beckman Coulter Genomics, CA, USA). The resulting DNA was mixed with PhiX control DNA at a ratio of 75:25, and this mixture was used as a template for paired-end sequencing using the MiSeq Reagent Kit v3 (600 cycles, 300 bp pair end) in a MiSeq desktop sequencer.
Data processing of ITS regions
Bioinformatics and data analyses were performed as described by Matsuoka et al. (2021). For all sequences, low-quality ends with quality values <30 were trimmed. Forward and reverse sequences with overlaps were concatenated using the default settings of VSEARCH (Rognes et al. 2016). If the sequence contained >10% bases with a quality of <30, it was excluded. The sequence was assembled using the Claident pipeline v 0.9.2022.04.28 (Tanabe and Toju 2013). Potential chimeric sequences and sequencing errors were removed using the default settings of UCHIME (Edgar et al. 2011) and DADA2 (Callahan et al. 2016), respectively. The remaining sequences [2 420 778 reads; mean 67 244 ± 33 150 (s.d.) reads per sample, n = 36] were assembled at a threshold similarity of 97% (Mueller et al. 2016) using the VSEARCH, and the resulting consensus sequences represented the molecular operational taxonomic units (OTUs; i.e. OTUs were defined at 97% sequence similarity). After removing singletons, we generated an OTU table (i.e. a matrix of OTUs and samples with sequence reads for each cell entry). For this OTU matrix, cell entries with reads <0.01% of the total reads in each sample were removed, because these rare entries could represent contamination. The OTUs were taxonomically identified employing the query-centric auto-k-nearest-neighbor (QCauto) method (Tanabe and Toju 2013) using the National Center for Biotechnology Information (NCBI) database and the lowest common ancestor algorithm (Huson et al. 2007) with the Claident software. For the statistical analyses described below, we used only the presence/absence (more than one sequence was defined as presence) data of the OTUs that belonged to the kingdom “fungi.” The presence or absence of fungal OTUs was used for the statistical analyses. We also estimated the functional guilds of each fungal OTU based on the FUNGuild database (Nguyen et al. 2016). Datasets from high-throughput sequencing of the ITS regions were submitted to the NCBI Sequence Read Archive under the accession number DRR457542-DRR457709 (http://trace.ddbj.nig.ac.jp/dra/index.html).
Statistical analysis
The following analyses were performed in R v 3.6.1 (R Core Team 2019).
Principal component analysis of soil environmental features
Principal component analysis (PCA) was performed to summarize soil environmental factors and their changes across sampled quadrats. Five abiotic environmental variables (water content, EC, pH, carbon content, and nitrogen content) were standardized for the analysis. The synthetic axes obtained were used in subsequent analyses as factors explaining fungal diversity. PC1 and PC2 within the same moraines or locations significantly correlated (simple linear regression, P < .05) within the moraines of M1 and M3, and within the locations of the top and bottom (see Fig. 3A). Thus, PCA was performed again for each moraine and at each location, and these synthetic axes were used for subsequent analyses (Supplementary Fig. S1).
Generalized linear model analysis of fungal OTU richness
We established a generalized linear model (GLM) for the three types of datasets to explain the fungal OTU richness with respect to soil conditions, using a dataset from all sites, each moraine, and each location. In the first model, for all sites, we used PC1s, PC2s, moraine names, and plot locations within each moraine as explanatory variables. In the first model for each moraine, we used PC1s and PC2s that were obtained from the PCA analysis for each moraine (see Supplementary Fig. S1) and location names. In the first model for each location, we used PC1s and PC2s, which were obtained by PCA analysis for each location, but not moraine names because PC1 and moraine names had multicollinearity (variance inflation factor > 10 is considered to indicate the existence of multicollinearity). The best models were selected by stepwise model selection using the Akaike information criterion (AIC) as the variable selection criterion. These analyses were conducted using the R functions glm() and stepAIC() in the MASS package of R.
Community composition of fungal OTUs
To evaluate the fungal composition dissimilarity, the Jaccard dissimilarity indices between all the samples were calculated and visualized using principal coordinate analysis (PCoA). To test the differences in fungal composition among the three moraines or the four locations, we conducted a nonparametric permutational multivariate analysis (PERMANOVA; Anderson 2001) with 999 permutations using the adonis2() function. The homogeneity of multivariate dispersion (PERMDISP) was also tested using the betadisper() function to determine whether the group differences indicated by PERMANOVA were the result of group dispersion or a shift in composition among the groups (Anderson 2006). These analyses were conducted using the R packages “vegan” (Okansen et al. 2022) and “stats” (R Core Team 2019).
To investigate the association of each predictor variable with the Jaccard dissimilarity index of fungal OTUs, we performed multiple regression analysis on distance matrices (MRM). The Euclidean distance of PC1 and PC2 and geographical distance were used as predictors, and MRM was conducted for the dataset of all sites, each moraine, and each location similar to the GLM analysis. These analyses were conducted using the R package “ecodist” (Goslee and Urban 2007). To prevent data overfitting, all variables were subjected to forward selection until P < .10.
Family function of OTUs and its replacement across moraine
We summarized and visualized the richness of fungal OTUs’ function in each moraine and location at the “family” taxonomic level. We identified the functional guild of each fungal OTU according to the data of the “Family Function” of the FUNGuild database, and totaled these numbers in each moraine and location. We also visualized the fungal families of OTUs that were shared or not shared between the different moraines to evaluate successional changes in fungal communities. Fungal OTUs shared between younger and older moraines were defined as common species. In contrast, the replacement of species between younger and older moraines was interpreted as species replacement along succession from a chronosequence perspective. Non-shared fungal OTUs present in the younger moraine, but not in the older moraine, were assumed to be the species lost during succession. In contrast, non-shared fungal OTUs present in older moraines, but not in younger moraines, were assumed to be the recruited species. Note that we only showed the richness of functional guilds that had >10 OTUs across all samples.
Results
Soil environment
The soil environmental factors and plant coverage at each site are shown in Fig. 2. In the PCA across all plots, PC1 exhibited high positive loadings for water content, soil EC, and soil C and N contents, and accounted for 88.8% of the total variance (Fig. 3A). Therefore, this component represents the formation of organic soil with higher enrichment of these abiotic variables as the moraine ages. PC2 accounted for 8.9% of the total variation in soil physicochemistry and had high loadings for pH. The results of the PCA for each moraine and each individual location showed different trends (Supplementary Fig. S1). In the youngest moraine (M1) or at the top location, PC1M1 and PC1top composed of water content and pH, accounting for 95.1% and 87.7% of the total variance, respectively. The environmental heterogeneity at other moraines or locations, similar to the PCA results for all sites, can be largely explained by PC1, which represents the development of organic soil. We additionally provide plant compositions in each moraine and location in Supplementary Table S1, and the richness increased with the moraine age, showing a similar trend of the soil and vegetation development.
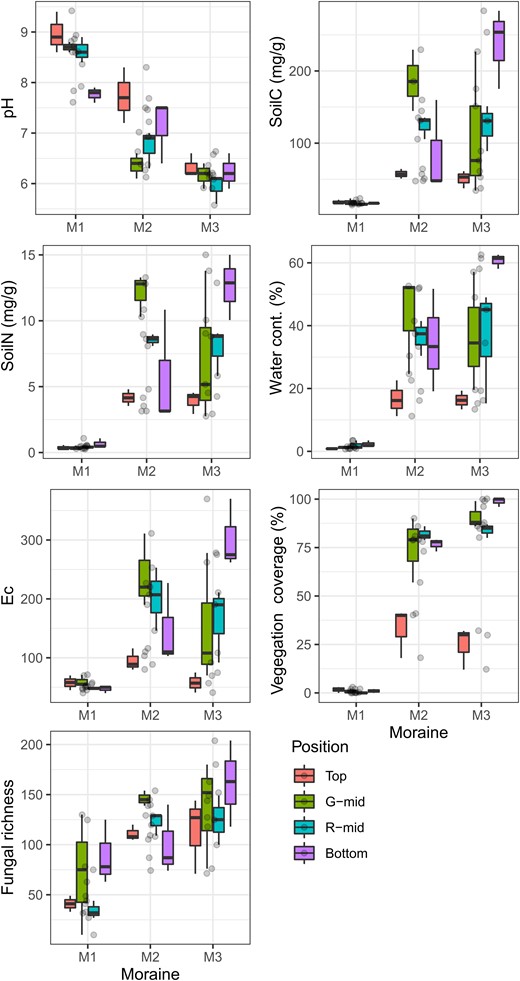
Soil environment factors, plant coverage, and fungal OTU richness in different moraines and locations.
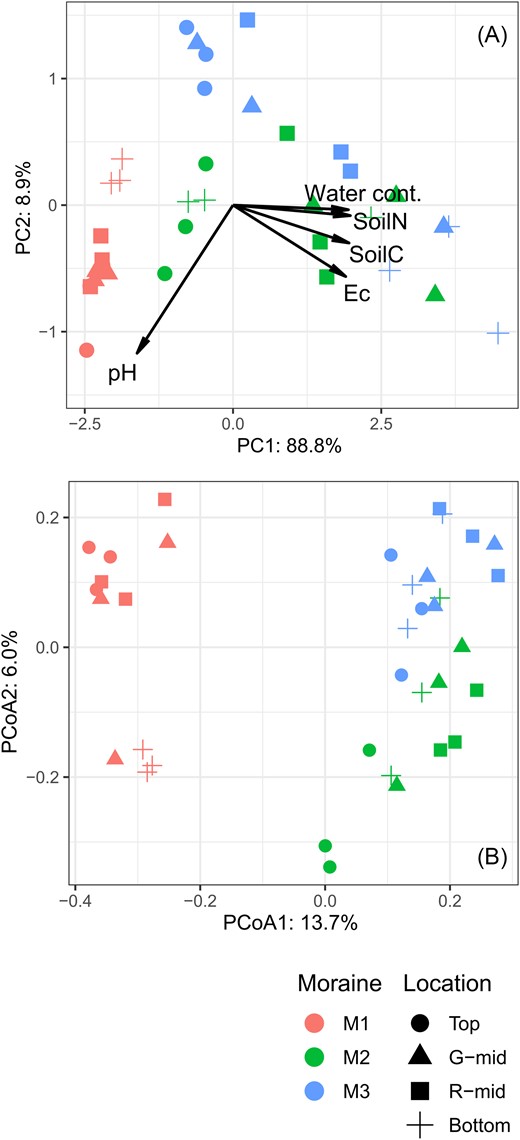
(A) Principal component analysis (PCA) of soil environmental factors. (B) Ordination plot of fungal communities based on OTU data. Principal coordinate analysis was performed using the Jaccard dissimilarity index and the results for principal coordinates 1 and 2 are shown. The color and shape of the points refer to moraine and location, respectively.
Fungal richness and composition
A total of 1248 fungal OTUs were identified across all samples, with 508 OTUs assigned to different families. Of these, 442 OTUs belonged to the top eight functional guilds and contained >10 OTUs across all samples. We also show the main families in each guild in Supplementary Table S2. The fungal richness in each plot increased with increasing moraine age (Fig. 2).
PCoA (Fig. 3B) and PERMANOVA analyses showed that the fungal community composition differed significantly between moraines and locations. The first and second dimensions of PCoA explained 13.7% and 6.0% of the variance in fungal dissimilarity across the samples, respectively. PERMANOVA revealed significant differences in species composition among moraines (R2 = 0.18, P < .001) and locations (R2 = 0.11, P < .001), and species composition was influenced by the interactions between moraines and locations (R2 = 0.18, P = .003). Because the PERMDISP results for samples collected from moraines or among locations were insignificant (P > .05), it can be concluded that the differences in fungal composition among moraines or among locations were due to compositional shifts, and not dispersion differences among groups.
Predictable factors of fungal richness and composition
The results of the GLM analysis are presented in Table 1. Fungal richness can mostly be explained by PC1, which represents soil development in the GLM of the total site. Although the selected predictors were different in each model, all GLM analyses showed that the soil development components (PC2s of M1 and top models, PC1s of M2, M3, bottom, G-mid, and R-mid models in Table 1) were always significant predictors.
Results of GLM testing for significant impact of environmental variables effect on soil fungal OTU richness.
| Effects on species richness | ||||||||
|---|---|---|---|---|---|---|---|---|
| In each moraine | In each location | |||||||
| Plot | All site | M1 | M2 | M3 | Bottom | G-mid | R-mid | Top |
| PC1 | 0.77*** | 0.49+ | 0.9* | 0.55+ | 0.73* | 0.7* | 0.98*** | 0.78** |
| PC2 | 0.17 | −0.57* | / | / | / | / | / | −0.5* |
| Moraine | / | − | − | − | − | − | − | − |
| Location | / | / | B>R>G>T | / | − | − | − | − |
For each response variable, the significant parameter estimates (/, not included in the final model: –, not applicable) and their significance levels (∗∗∗P < .001; ∗P < .05; +P < .1) are shown.
Fungal dissimilarity in the total site could be significantly explained by all predictors (PC1, PC2, and geographical distance), as shown in the MRM model (Table 2). In the models for each moraine or location, PC1s were the main predictors of individual dissimilarity. It was suggested that water content and pH determined the fungal composition in the M1 and top samples. In contrast, soil development determined the fungal composition in the M2, M3, bottom, G-mid, and R-mid samples.
Stepwise multiple regressions of fungal community composition with environmental variables.
| Dataset | Variable retained in the model | Model R2adj | Model P |
|---|---|---|---|
| All site | PC1, PC2, distance | 0.256 | 0.001 |
| M1 | PC1M1 | 0.093 | 0.039 |
| M2 | PC1M2, distance | 0.227 | 0.004 |
| M3 | PC1M3 | 0.185 | 0.002 |
| Bottom | PC1Bottom | 0.295 | 0.021 |
| G-mid | PC1G-mid | 0.247 | 0.009 |
| R-mid | PC1R-mid | 0.758 | 0.004 |
| Top | PC1top, PC2top | 0.800 | 0.001 |
Fungal functional difference in each moraine and location
The results for the OTU richness of each function at the family level for each moraine and location are shown in Fig. 4A. We could see that “lichenized” fungi were rich in M1, especially in G-mid and bottom samples, wherein their richness subsequently declined with moraine age. Conversely, “saprotrophic” or “root endophyte” fungi were rich in M2 and M3 moraines. The detailed family names included in each guild are shown in Supplementary Table S2.
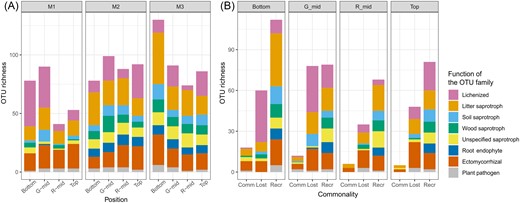
(A) The fungal OTU richness at the functional level in different moraines and locations. (B) The richness of common and unique fungal OTUs at the functional level between moraines M1 and M3. Left bars (Comm) show the richness of common (shared) OTUs between the two moraines. Middle bars (Lost) show the richness of OTUs that are unique to the younger moraine. Right bars (Recr) show the richness of OTUs that are unique to the older moraine.
Fungal richness of the common, lost, and recruited species between M1 and M3 is shown in Fig 4B. The results of the same analyses between M1 and M2, or M2 and M3, are also shown in Supplementary Fig S2. Variables of richness are terms in the formula of the Jaccard dissimilarity index used in this study (i.e. lower richness of common species or larger richness of lost and recruited species increases the dissimilarity of fungal composition between the two sites). Thus, guilds involved in the increase or decrease of these species could be considered as factors that cause changes in fungal community composition. The fungal replacement trend with succession differed at each location. The lichenized fungi decreased, and saprotrophic fungi increased with moraine age in the bottom and G-mid samples, indicating not only that the species were replaced, but also that the functional guild had shifted. However, in the top or R-mid samples, such drastic functional replacement was not observed, although the common species richness between M1 and M3 was similar to that at other locations.
Discussion
For the three moraines in this study, the concept of succession using chronosequences can be attributed because they were formed by the retreat of the same glacier. Therefore, we discuss the results of the M1 moraine as an initial situation, and M2 and M3 moraines as a successional consequence of the M1 moraine. The differences among locations within the moraines can be interpreted as being due to the influence of microtopography on succession.
Soil environments along chronosequence and toposequence
Soil environmental factors varied considerably across different moraines; in the M1 moraine in particular, PC1M1 representing pH change was the main explanatory factor for differences in plots, and other environmental variables showed low variability at all sampling locations in the moraine (see Fig. 2). As the M1 moraine was estimated to be a few hundred years old (Okitsu et al. 2004), the bare bedrock could strongly influence soil alkalinity and dryness. Moreover, the soil at a relatively new moraine is usually unstable and susceptible to mass movements, such as rockfalls and debris flows (Matthews 1992), resulting in unfavorable conditions for vegetation establishment and organic matter deposition (Heilbronn and Walton 1984, Jumpponen et al. 1999, Mori et al. 2006).
In the M2 and M3 moraines, pH decreased, and other environmental variables increased compared with M1 (Fig. 2), indicating that organic soil developed with the age of the moraines (Fig. 3A). Soil environmental changes typically occur during primary succession associated with glacial retreat (Wardle et al. 2004). However, the environmental variability among different locations in the moraines was larger than that in M1, suggesting that microtopography strongly controls the degree of soil development. Even though we captured the same lapse of time in the lower locations of a moraine, distinctive development in soil organic matter and vegetation coverage was observed, whereas this pattern was less evident at the top of the moraine (Fig. 2). In tundra areas, a toposequence with the development of soil or vegetation is often observed along the ridge or hillslope of a moraine (Vetaas 1997, Masumoto et al. 2023) because each location within a terrain could experience different environmental harshness, such as wind exposure or downslope water and nutrient fluxes (Vetaas 1994, Rastetter et al. 2004). Such processes maintained for a long time would lead to a larger variation in organic soil development in the older moraine such as the dispersion of PC1 in Fig. 3A.
In addition, our results showed a notable correlation between soil gradient, succession, and microtopography. Specifically, the PCA gradient along the toposequence of M1 (red points in Fig. 3A) showed a trend similar to that along the chronosequence at the top across the moraines (circles in Fig. 3A). The gradients along the toposequence of M3 (blue points) and along the chronosequence at the bottom across the moraines (cross points) also show parallel lines (Fig. 3A). Therefore, in the glacier forefield, there are similar gradients in the current soil properties owing to different processes.
Fungal richness and composition in the youngest moraine
In the M1 moraine, as an initial stage of succession, fungal richness was lower than other older moraines (Fig. 2) because the lower soil and vegetation development restricted fungal activities (Schipper et al. 2001). However, regardless of the low variability in soil environments with location, community richness and composition showed variability with location. As an explanation for this variation, our analysis of the fungal functional composition showed that total fungal richness was strongly influenced by the richness of the lichenized fungi (Fig. 4A), indicating that lichen colonization was easier at the bottom and G-mid locations than at other locations. The lichenized fungi mostly consisted of the family Verrucariaceae (see Supplementary Table S2), which use rocks and soil as the most common substrates to colonize (Cannon and Kirk 2007). Some species of this family have been collected from biological soil crusts (BSCs), which are communities of living organisms on soil surfaces in arid and semi-arid ecosystems (Zhang et al. 2022). In the harsh environment of the early successional stages, they are dominant and play an important functional role. Although the GLM and MRM analyses showed that the local heterogeneity of PC1M1, representing changes in pH and water content, affected the fungal community structure, the changes in these absolute values were small. These results would imply that the ground movement is relatively stable at the bottom and G-mid locations owing to the smaller slope angle in this region, facilitating good moisture retention and mitigation of strong alkalinity. Such a difference in the microenvironment based on microtopographic physical conditions is known to be an important factor for the establishment of organisms in poorly developed soil (Jumpponen et al. 1999, Rolli et al. 2022). The bottom and G-mid locations could provide microenvironments more suitable for facilitating lichen establishment than other locations.
Changes in fungal richness and composition with moraine age
Fungal richness increased significantly with PC1, which represented soil development (Table 1). This trend has been observed in periglacial ecosystems (Jiang et al. 2018, Garrido-Benavent et al. 2020) because of the positive relationships between pedogenic processes and plant and microbial activities (Schipper et al. 2001, Bardgett et al. 2005). Some studies showed a unimodal trend in which fungal diversity declined again in the later successional stages (Dong et al. 2016, Tian et al. 2017). Our study may have only captured the early stages of succession. From the PERMANOVA analyses, fungal composition showed heterogeneity depending on moraine age, suggesting that primary succession could affect fungal assembly, as in previous studies (Jiang et al. 2018, Dong et al. 2022). In addition, the compositions varied significantly with location, indicating that the fungal community assembled into different successional trajectories at each location.
Fungal functional analyses allowed us to interpret the variety of successions at each location (Fig. 4B). At the bottom and G-mid of a moraine, lichens were predominant at the initial moraine stage, and were replaced by fungal species with different life strategies (i.e. from lichens to saprotrophic or mycorrhizal fungi) at later stages. These guild fungi mainly consist of the families Thelephoraceae and Inocybaceae (see Supplementary Table S2) and are known to be associated with common Arctic plants (Milne et al. 2006, Ryberg et al. 2009). These relationships can change with primary succession (Fujiyoshi et al. 2011, Davey et al. 2015). The MRM analysis for these lower locations also showed that the community dissimilarity due to species replacement with functional exchange was driven by PC1s representing soil development, suggesting a positive relationship between fungal communities and vegetation development in primary succession, as previously reported (Bardgett et al. 2005, Rola et al. 2023).
At the top of the moraine, species replacements occurred without altering its functionality, suggesting that the environmental succession on the top of the moraine contributes to the fungal assembly process at the species level, even if dramatic functional exchange does not occur. OTU composition also changed with moraine age, and MRM analysis indicated that this dissimilarity was driven by changes in soil pH (PC1top) with succession, as well as soil development. At the top of the moraine void of the soil, and during vegetation successional stages, species richness also responded to changes in soil pH and moisture content (PC1top in Table 1). The high impact of soil pH on fungal diversity is well known (Rousk et al. 2010, Glassman et al. 2017, Tedersoo et al. 2020) because pH affects the availability of fungal nutrients (Tedersoo et al. 2020). In addition, in our analysis (Supplementary Fig. S3), the dissimilarity between the top of the moraine and other locations was smaller in older moraines than in newer ones. It might be suggested that, with succession, the community at the lower locations was more mature and plant invasion was closer to the top, which facilitated the frequency of fungal immigration from the lower to the top location. The importance of such stochastic processes for the community assembly of microbes is known in the Arctic (Zhou and Ning 2017, Bottos et al. 2018). Nevertheless, our studies on the top of moraines with poorly developed soils and vegetation suggest that successional changes other than soil development could control fungal community structure.
Conclusion
The results of our study corroborate the findings of previous studies on primary succession along a chronosequence and spatial biodiversity along a toposequence. Here, our integrated investigation using both chronosequences and toposequences suggests that the interaction between succession and microtopography provides various assembly processes for the fungal community. The differences in fungal composition among moraines or among locations were caused by compositional shifts but not dispersion differences among those groups, indicating that the heterogeneity of fungal communities with location was comparable in any moraine age, and that successional change of fungal communities with moraine age was comparable in any location. Therefore, this study provides the following responses to the questions posed in the introduction:
(i) Regardless of the lower variation in soil development of the younger moraine, the fungal communities within the moraine were equally diverse compared to those within the older moraines. For moraine, different processes (physical processes such as soil collapse) could drive fungal community heterogeneity.
(ii) Although the sedimentation rate of organic matter in primary succession differed significantly depending on the microtopography, successional changes in the fungal community did not follow this trend. Differences in the initial conditions and vegetation development among different locations affected the functional aspects of the fungus, leading to succession along different trajectories.
(iii) As a result of situations (i) and (ii), even if the gradients of the current soil properties are similar, different fungal communities are formed due to different processes, either through succession or through microtopography.
These results suggest that the effects of horizontal and vertical landforms caused by deglaciation could work synergistically to amplify the spatial diversity of fungi. Although 20 000 years have passed since the Last Glacial Maximum, their legacies are still evident and passed down through moraines created by the forward retreat of glaciers. These moraines play an important role in shaping the fungal community assembly and subsequently maintaining biological diversity in the Arctic ecosystem.
Author contributions
S.Masumoto conceived and designed the study. S.Masumoto, K.N., and M.N. conducted field research and experiments. S.Matsuoka contributed to DNA data processing. S.Masumoto analyzed the data and wrote the manuscript. All authors read and approved the manuscript.
Acknowledgment
We thank Robert Walker Howe and Centre d'études nordiques for providing logistical support for our field work. The Polar Continental Shelf Program for supporting the original sample collection, which was under research permits from the Nunavut Research Institute.
Conflicts of interest
All authors have no relevant financial or non-financial interests to disclose.
Funding
This work was supported by the Arctic Challenge for Sustainability II Project (JPMXD1420318865) of the Japanese Ministry of Education, Culture, Sports, Science, and Technology.
