


ABSTRACT
Despite the growing recognition regarding the carbon cycle in the rhizosphere of upland ecosystems, little is known regarding the rhizosphere effect on soil organic carbon (SOC) mineralization in tidal marsh soils. In the current study, in situ rhizobox experiments (including rhizosphere and inner and outer bulk soil) were conducted in an estuarine tidal marsh. Our results showed that a higher abundance of total bacteria, Geobacter, dsrA and mcrA and lower α-diversity were observed in the rhizosphere relative to the bulk soil. Rhizosphere effects shifted the partition of terminal metabolic pathways from sulfate reduction in the bulk soil to the co-dominance of microbial Fe(III) and sulfate reduction in the rhizosphere. Although the rhizosphere effect promoted the rates of three terminal metabolic pathways, it showed greater preference towards microbial Fe(III) reduction in the tidal marsh soils. Plant species had little impact on the partitioning of terminal metabolic pathways, but did affect the potential of total SOC mineralization together with the abundance and diversity of total bacteria. Both the rhizosphere effect and plant species influenced the bacterial community composition in the tidal marsh soils; however, plant species had a less pronounced impact on the bacterial community compared with that of the rhizosphere effect.
INTRODUCTION
Tidal marshes occur at the intersection of terrestrial and aquatic ecosystems and play an important role in the Earth's carbon cycle (Megonigal and Neubauer 2009). Globally, tidal marshes show high primary productivity (930−7600 g C m−2 yr−1; Mitsch and Gosselink 2015) and act as significant ‘blue carbon’ sinks (Kirwan and Mudd 2012). Mineralization of organic carbon in tidal marsh soils regulates both the amount of soil organic carbon (SOC) that remains stored and the amount of mineralized carbon that is released to the atmosphere as greenhouse gases (e.g., CO2 or CH4; Sutton-Grier et al. 2011). The rhizosphere is a hotspot for SOC mineralization in tidal marsh soils and also a critical ecological niche for complex and dynamic interactions between plants, microbes and soils (Hiltner 1904; Weiss et al. 2003; Berg and Smalla 2009; Tobias and Neubauer 2009; Mueller, Jensen and Megonigal 2016). Tidal marsh plants can transport substantial amounts of photosynthetically fixed C into the soil by releasing root exudates, which can serve as substrates for microbial terminal metabolism (Ström et al. 2003; Wolf et al. 2007). In addition, the survival and growth of marsh plant roots in anaerobic marsh soils are dependent on an adequate supply of O2 via the aerenchyma, a process known as root oxygen loss (ROL; Connell, Colmer and Walker 1999; Armstrong et al. 2000; Koop-Jakobsen et al. 2018). ROL can change the redox condition surrounding the roots and also reoxidize toxic substances, e.g., dissolved iron and sulfide in the root zone (Koretsky et al. 2003; Hyun et al. 2009).
Tidal marsh plants have been reported to stimulate faster SOC mineralization potential in the rhizosphere compared with that of bulk soil (Hines, Knollmeye and Tugel 1989; Hines et al. 1999; King and Garey 1999; Neubauer et al. 2005; Koretsky et al. 2008a, 2008b). SOC mineralization in tidal marsh ecosystems is accomplished via the reduction of several terminal electron acceptors (TEAs) along a cascade of decreasing free energy yields (Froelich et al. 1979). The order of energy yield is nitrate reduction, manganese reduction, ferric iron (Fe(III)) reduction, sulfate reduction and then methanogenesis (Sivan, Shusta and Valentine 2016). However, these terminal metabolic pathways are not exclusive and can coexist in tidal marsh soils because the traditional order is based on assuming an even TEA distribution (Sutton-Grier et al. 2011). In fact, microbial nitrate and manganese reduction are always negligible in tidal marsh ecosystems because of low TEA contents (Kostka, Roychoudhury and Cappellen 2002b; Neubauer et al. 2005; Luo et al. 2017, 2018). Microbial sulfate reduction has been reported as the majority (32–95%) of SOC mineralization in brackish and salt marsh soils (Hines, Knollmeye and Tugel 1989; Kostka, Roychoudhury and Cappellen 2002b; Neubauer et al. 2005; Luo et al. 2017, 2018). In freshwater tidal marsh soils, where SO42– concentrations are low, microbial Fe(III) reduction or methanogenesis become the dominant pathways of anaerobic SOC mineralization (e.g., Roden and Wetzel 1996; Neubauer et al. 2005). Moreover, the dominant terminal metabolic pathways change between vegetated and unvegetated habitats (Kostka, Roychoudhury and Cappellen 2002b; Gribsholt, Kostka and Kristensen 2003) under different inundation frequencies (Luo et al. 2016) or among different soil types (Sutton-Grier et al. 2011). From the rhizosphere to bulk soil, where rhizosphere effects can reallocate C substrates and O2, the partition of terminal metabolic pathways remains enigmatic.
Rhizosphere bacteria are important drivers of C cycling in tidal marsh soils (Yarwood 2018). Previous studies have suggested that the rhizosphere effect can significantly impact the bacterial community structure in the root zones of wetland plants (Ravit, Ehrenfeld and Haggblom 2003; Lu et al. 2004, 2006; Ravit et al. 2007; Rietl et al. 2016; Li et al. 2019). In the rhizosphere of Limoniu mvulgare, a higher relative abundance of Chlorofexi, Plantomycetes and δ-proteobacteria and a lower relative abundance of γ-proteobacteria were observed compared with bulk soil (Wang, Yang and Salles 2016). The rhizobiomes of the seagrasses Zostera marina, Zostera noltii and Cymodocea nodosa were dominated by members of the classes γ-, δ- and ε-proteobacteria and Bacteroidia, while communities from the bulk soils were predominantly composed of members from the α-, γ- and δ-proteobacteria classes (Cúcio et al. 2016). Based on the 16S rRNA technique, Li et al. (2019) found that the relative abundance of Oxobacter, Lachnospiraceae, Coprococcus, α-Proteobacteria, Rhodospirillales, Rhodospirillaceae and Magnetospirillum were much higher in rhizosphere soils compared with bulk soil. Breidenbach, Pump and Dumont (2016) suggested that numerous phyla were affected by the presence of rice roots, but the strongest effects were observed for Gemmatimonadetes, Proteobacteria and Verrucomicrobia. Furthermore, this study also suggested that, with respect to functional groups of microorganisms, potential iron reducers (e.g., Geobacter, Anaeromyxobacter) and fermenters (e.g., Clostridiaceae, Opitutaceae) were notably enriched in the rhizosphere environment compared with bulk soil. However, a few studies have also shown no significant difference between the rhizosphere and bulk soil (Ahn, Gillevet and Sikaroodi 2007). Nie et al. (2009) explained that the inundation or anaerobic condition in tidal marshes may mask the rhizosphere effect on bacterial community compositions. Plant species can also influence the rhizosphere microbial community composition in tidal marsh soils (Hines et al. 1999; Nielsen et al. 2001; Batten et al. 2006; Berg and Smalla 2009; Prasse, Baldwin and Yarwood 2015). Tidal marsh plants differ from each other in terms of morphology (size and relative abundance of rhizomes and roots), total biomass, O2 transport capability and root exudates (Howes and Teal 1994; Armstrong et al. 2000). Several cases in tidal marsh soils have demonstrated that the abundance of bacteria, fungi, actinomycetes, and denitrifiers, as well as microbial community composition, differs in rhizosphere soils of different plant species in wetland soils (Ravit, Ehrenfeld and Haggblom 2003; Berg and Smalla 2009).
According to the aforementioned analysis, soil bacteria of tidal marshes are sensitive to both the rhizosphere effect and plant species. Despite many existing studies in tidal marshes, most previous studies have considered that even though there is an impact of rhizosphere effect or plant species on bacterial community composition, it is reliant on the change in relative abundance between aerobic and anaerobic bacteria or acidophilic and non-acidophilic bacteria. Few have examined whether the change in bacterial community composition is significantly influenced by the shift in terminal metabolic pathways. To address this issue, we established a series of rhizoboxes to investigate the rates and pathways of the total SOC mineralization between the rhizosphere and bulk soil of two tidal marsh plants (Spartina alterniflora Loisel. and Phragmites australis (Cav.) Trin. ex. Steud) in the Min River Estuary, East China Sea.
The specific goal of this study was to (i) clarify the rates and pathways of SOC mineralization when transitioning from the rhizosphere to bulk soil; (ii) identify the abundance of iron-reducing bacteria (Geobacter), sulfate-reducing bacteria (dsrA gene) and methanogen (mcrA gene), and overall bacterial abundance and community composition (16S rRNA gene) in the rhizosphere and bulk soil; and (iii) explore the relationship between the rhizosphere effect or plant species and bacterial community composition across the rhizoboxes.
MATERIAL AND METHODS
Soil preparation
The soil utilized in this study was collected from the 0−20 cm layer of mudflat near the study site located on the barrier island of the Shanyu Tidal Marsh in the Min River Estuary, East China Sea (26°1′58″N, 119°37′50″E). The tidal marsh is brackish (mean salinity: 0.25± 0.04%) and flooded twice a day, with the inundation frequency ranging from 26 to 31% (Luo et al. 2017). The particle size composition of the soil was characterized as sandy clay loam (clay 21.9 ± 1.9%, silt 22.9 ± 2.8% and sand 55.2 ± 4.7%). The SOC content was 1.48 ± 0.33% and the in situ salinity was 0.27 ± 0.03% (the test method is detailed below).
Experimental setup
A specially designed acrylic plexiglass rhizobox (Fig. S1) was used during the experiment. The rhizobox was the mesocosm used for investigating the root-soil interactions (Li, Fan and Shen 2008; Neumann, George and Plassard 2009; Bengtson, Barker and Grayston 2012; Hafner et al. 2014; Li et al. 2016; Ma et al. 2018). The rhizobox could be separated as one root compartment (i.e. rhizosphere) and two side soil compartments (i.e. bulk soil). Mesh partitions between the compartments prevented the roots from entering the soil compartments and synchronously ensured the exchange between the rhizosphere and bulk soil (Luo et al. 2018; Wang et al. 2018). However, some fine root hairs and hyphae may still have penetrated into the adjacent bulk soil (Ma et al. 2018) and thus the rhizosphere effect may have somehow extended its impact into the special bulk soil zone (Wang et al. 2018). According to previous studies, the range of this special bulk zone was within 5 mm (Luo et al. 2018). In this study, we operationally defined the bulk soil zone 5 mm outward from the mesh partition as the ‘inner bulk soil’ and the remainder as the ‘outer bulk soil’.
Sextuplicate rhizoboxes for S. alterniflora and P. australis were established in the tidal flat on 12 March 2016. The cultivation soil was fully pooled, mixed, homogenized and subsequently passed through a 2 mm sieve. The S. alterniflora and P. australis seedlings were first rinsed in the tidal water to remove the attached soil and then carefully washed again using sterile deionized water. Afterwards, six seedlings of each plant were evenly planted in the root chambers.
After 130 days of cultivation, all the marsh plants in the rhizoboxes grew vigorously with roots full in the root chambers. The rhizoboxes were then taken out of the ground and wrapped with a plastic cloth. The rhizoboxes were stored in a portable refrigerator and taken back to the laboratory within 1 h. After transport to the laboratory, the rhizoboxes were placed into an anaerobic glove box (AtmosBag, Sigma-Aldrich, USA). Soil in the same zones was pooled and homogenized and then passed through a 2 mm mesh nylon screen for further chemical, incubation and extracellular enzyme analyses. The soil for the molecular genetic analyses was snap frozen in liquid nitrogen and stored at −80 °C. The porewater was extracted by centrifugation (4000 × g for 20 min) for the SO42– and dissolved organic carbon (DOC) analyses. The porewater samples were filtered through 0.45 µm syringe filters with hydrophilic GH Polypro membranes (Acrodisc, Pall Corporation, USA) and drained into 10 ml glass vials. The filters used for the DOC analyses were prewashed with diluted hydrochloric acid (HCl).
Soil and plant analysis
The SOC concentrations were determined using a dry combustion method on an Elementar analyzer (Vario MAX CN, Elementar, Germany; detection limit = 0.3%) following grinding and acidification of the samples using 10% HCl. The DOC concentrations were analyzed with an automatic total organic carbon analyzer (TOC-V CPH, Shimadzu, Japan; detection limit = 0.002 mg C L−1). The porewater SO42− concentrations were determined using ion chromatography (ICS-2000, Dionex, USA; detection limit = 0.09 mg L−1). The solid-phase Fe(II) and Fe(III) contents were extracted using 0.5 M HCl-extractable Fe(II) and citrate-bicarbonate-dithionite (0.35 M glacial acetic acid/0.2 M sodium citrate, buffered with 50 g·L−1 sodium dithionite), respectively (Kostka and Luther III 1994). The total reduced sulfur (TRS) samples were extracted by acid chromium chloride solution with the addition of zinc grains (the procedure developed by Burton et al. 2008). The extractions for the Fe and S species were performed by the 1, 10-phenanthroline colorimetric method (detection limit = 1 μM, SD = 1%; APHA 2005) and the methylene blue method (detection limit = 1 µM; SD = 1%; Cline 1969), respectively, using spectrophotometry (UV-2450, Shimadzu, Japan). The dissolved CH4 concentrations were analyzed using a headspace technique based on the vapor liquid equilibrium with a Shimadzu GC2010 gas chromatograph (Japan) with a flame ionization detector (FID) (detection limit = 10 ppm; Tong et al. 2012). For the root biomass, all remaining soil on the roots and rhizome was washed away. The washed roots were then oven-dried at 70 °C to a constant weight and the dry weight was recorded as the root biomass.
Anaerobic incubation
The measurements for rates of SOC mineralization, Fe(III) reduction, sulfate reduction and methanogenesis followed the method reported in previous studies (see Luo et al. 2017).
Briefly, approximately 5 g of soil sub-samples were prepared and loaded into 7 mL glass incubation bottles for the sulfate and Fe(III) reductions. For the microbial Fe(III) reduction, sodium molybdate at a final concentration of 20 mM was added to the bottles to inhibit microbial sulfate reduction because Fe(III) can also be chemically reduced by the newly yielded HS− (a product of the sulfate reduction; Hyun, Smith and Kostka 2007). The microbial Fe(III) and sulfate reduction rates were determined by the generation of solid-phase Fe(II) (Fe(III) reduction) and TRS (sulfate reduction), respectively, at 0, 24, 48, 72 and 96 h. The incubation times were linearly regressed to the rates of microbial Fe(III) reduction (r2 = 0.82, p < 0.05, n = 30) and microbial sulfate reduction (r2 = 0.81, p < 0.05, n = 30). The assays for Fe(II) and TRS were performed as described above. We acknowledge that the estimates of sulfate reduction rates in this study should be treated with some caution given that the method we chose may discount sulfide reoxidation and underestimate the actual rates.
For the SOC mineralization and methanogenesis rates, approximately 20 g of soil sub-samples were prepared and loaded into 150 mL glass incubation bottles. Deoxygenated and sterilized tide water was added to the bottles to create a slurry with a 2:1 ratio of water to soil by volume. The CH4(g) and CO2(g) values were determined (for total SOC mineralization) at 0, 24, 48, 72 and 96 h. Prior to sampling, each bottle was shaken on a rotary shaker at 240 rpm for 1 h to drive all the CO2 and CH4 that escaped the slurry into the headspaces. Subsequently, 4 mL sub-samples of the gas were collected for the CO2 and CH4 concentration analyses. After each gas sample was collected, the incubation bottles were backfilled with 4 mL of N2 to re-establish normal atmospheric pressure. The CO2 and CH4 concentrations were measured using a gas chromatograph fitted with a thermal conductivity detector to measure CO2 and a flame-ionization detector to measure CH4 (GC2014, Shimadzu, Japan). The CO2 and CH4 concentration measurements were corrected for standard pressure and temperature using the ideal gas law in which the concentrations were multiplied by the headspace volume (Tong et al. 2012). The incubation times were linearly regressed to the rates of total SOC mineralization (r2 = 0.96, p < 0.05, n = 30) and methanogenesis (r2 = 0.92, p < 0.05, n = 30).
Terminal metabolic pathway rates were unified in C units (μmol C·g−1·d−1) using Fe:C = 4:1, S:C = 1:2 and C–CH4:C = 1:2 theoretical stoichiometry (Kostka et al. 2002a; Neubauer et al. 2005). The relative contributions of Fe(III) reduction, sulfate reduction and methanogenesis were calculated from the ratios of the individual anaerobic terminal metabolic pathway rates versus the rates for the total SOC mineralization.
Extracellular enzymatic activity
The extracellular enzymatic activity (including β-glucosidase (βG) and cellobiohydrolase (CBH)) was measured using fluorometric and colorimetric microplate assays with 4-methylumbelliferone (MUB)-linked substrate as described in Saiya-Cork, Sinsabaugh and Zak (2002). Briefly, approximately 3 g of soil sub-samples were homogenized in 125 mL 50 mM acetate buffer (pH = 5.0) using a magnetic stirrer. Next, 200 μL aliquots of the sample suspension were dispensed into a 96-well black Optiplate microplate (PerkinElmer, MA, USA) by pipette. The microplate was incubated in the dark for 4 h at 20°C, then a 10 mL aliquot of 1 M NaOH was added to each well of the microplate to stop the reaction. The sample fluorescence was measured using a microplate fluorometer with 365 nm excitation and 450 nm emission filters on a Synergy H4 microplate reader (BioTek, Hybrid Technology, USA).
Molecular genetic analyses
The soil DNA extractions followed the procedures from the PowerSoil DNA Isolation Kit (MoBio Laboratories, CA, USA) using 0.8% agarose gels to check the purity and quality of the genomic DNA.
The microbial abundances were quantified by real-time quantitative PCR (qPCR) using SYBR® Premix Ex Taq II (Tli RNaseH Plus), ROX plus (Takara, Japan) and a Stepone plus thermocycler (Applied Biosystems, CA, USA). The bacteria (16S rRNA gene) were targeted with the primers Eub338 and Eub517 (Morrissey and Franklin 2015). The ME1 and mcrA-rev primers were used to target the methyl coenzyme-M reductase encoding the mcrA functional gene (Steinberg and Regan 2009). The dsrA_290F and dsrA_660R primers were employed to quantify the abundance of the dsrA gene (δ-proteobacteria clade; Pereyra et al. 2010), and the GM3 and 825R primers were used to quantify the Geobacter abundance (putative iron-reducing bacteria; Holmes et al. 2002). The reactions (20 μL) were performed with 6 ng of DNA template and 0.2 μM concentrations of each primer. The thermal cycling conditions included incubation at 94°C for 5 min, followed by 30 cycles of denaturing at 94°C for 30 s, annealing at 55°C for 30 s, extending at 72°C for 30 s and extending once again at 72°C for 10 min. The data were analyzed using Bio-Rad CFX Manager (Version 2.1).
The V3-4 hypervariable region of the bacterial 16S rRNA gene was amplified with the primers 338F (ACTCCTACGGGAGGCAGCAG) and 806R (GGACTACHVGGGTWTCTAAT) (Munyaka et al. 2015). For each soil sample, 10-digit barcode sequences were added to the 5′ end of the forward and reverse primers (provided by Allwegene Company, Beijing, China, http://tech.allwegene.com). The PCR reactions were conducted using a Mastercycler Gradient (Eppendorf, Germany) with 25 μL reaction volumes containing 12.5 μL 2 × Taq PCR MasterMix, 3 μL BSA (2 ng μL−1), 2 Primer (5 μM), 2 μL template DNA and 5.5 μL distilled deionized water (ddH2O). The cycling parameters were 95°C for 5 min, followed by 32 cycles of 95°C for 45 s, 55°C for 50 s and 72°C for 45 s with a final extension at 72°C for 10 min. Three PCR products per sample were pooled to mitigate reaction-level PCR biases. The PCR products were purified using a QIAquick Gel Extraction Kit (Qiagen, Hilden, Germany), quantified using real-time PCR and sequenced at the Allwegene Company. The deep sequencing was performed on a Miseq platform at the Allwegene Company. After the run, image analysis, base calling and error estimations were performed using Illumina Analysis Pipeline version 2.6.
Statistical analysis
All environmental, enzymatic activity and terminal metabolic pathways and total SOC mineralization rates were provided as the mean ± standard deviation (SD). The datasets were tested before meeting the assumptions of homogeneity and normality. If these assumptions were not met, the raw data was log10 transformed before further statistical analyses were performed. Most notably, all microbial abundances (bacteria, mcrA, dsrA and Geobacter) required a log10 transformation prior to statistical analysis.
Two-way analysis of variance (ANOVA) analyses were utilized to compare the indices (including soil geochemistry, enzymatic activities, total SOC mineralization rates, terminal metabolic pathways rates and microbial abundances) across the rhizoboxes. In some cases, ANOVA was followed by the Tukey post hoc test to resolve significant differences. Independent t-tests (two-tails) were performed to examine whether the root biomass differences between two plants were significant. The relationships between the aforementioned indices were assessed using Pearson correlations. For all the analyses, a significance level of α = 0.05 was used, and the difference was considered to be statistically significant when p < 0.05. The statistical analyses were performed using SPSS 22.0 software.
The raw data for the bacterial communities were first screened and sequences were removed from consideration if they were shorter than 200 bp, had a low-quality score (≤ 20), contained ambiguous bases, or did not exactly match the primer sequences and barcode tags. Qualified reads were separated using the sample-specific barcode sequences and trimmed using Illumina Analysis Pipeline version 2.6 and then the datasets were analyzed using QIIME 1.8 (Caporaso et al. 2010). The sequences were clustered into operational taxonomic units (OTUs) at a similarity level of 97% to generate rarefaction curves and to calculate the richness and diversity indices. OTUs accounting for less than 0.005% of the sequences were removed prior to the downstream analyses (Bokulich et al. 2013). The Ribosomal Database Project (RDP) Classifier tool was used to classify the sequences into different taxonomic groups. Taxonomy was assigned to the OTUs with reference to a subset of the SILVA 128 database (http://www.arb-silva.de). A total of 987 012 high-quality bacterial sequences (samples: 18; min: 19 278; max: 103 533; median: 49 848) were obtained after trimming via Illumina high-throughput sequencing. All of the statistics concerning bacterial communities were based on the rarefied OTUs table (total sequences of each sample were normalized to 19 278).
The alpha diversities (including the Shannon indices and Chao 1 index) were calculated to represent the OTU diversity for each sample using the ‘vegan’ package R × 64 (3.2.2). The beta diversity (weighted Bray-Curtis distances; Beals 1984) was visualized using clustering analyses and nonmetric multidimensional scaling analyses (NMDS) with the ‘hcluster’ and ‘ape’ package R × 64 (3.2.2). The two-way non-parametric multivariate analysis of variance (PerMANOVA) was used to test the differences in the soil bacterial communities across the rhizoboxes and between two plants using the ‘vegan’ package R × 64 (3.2.2) (Wang et al. 2018). Venn diagrams were created using 3 Venn diagrams (Microsoft, Redmond, WA, USA) by tracing the results calculated using the venneuler function from the ‘venneuler’ package R × 64 (3.2.2) (Wilkinson and Urbanek 2010).
To compare the membership and structure of communities in different samples, heatmaps were generated with the top 25 OTUs using the ‘heatmap’ package R × 64 (3.2.2) (Jami et al. 2013). The evolutionary distances between the bacterial communities were represented as an unweighted pair group method with arithmetic mean (UPGMA) clustering tree describing the dissimilarity between multiple samples using MEGA 7.0 (www.megasoftware.net). The generated Newick-formatted tree file was plotted using iTOL (itol.embl.de).
Canonical correlation analysis (CCA) and variation partitioning analysis (VPA) were performed to determine the extent to which the terminal metabolic pathways could explain the bacterial community composition using Canoco 5.0 (www.canoco5.com). For selecting the variables, those containing redundant information were reduced to a minimum number and only the variables that had significant impacts were maintained. The significance of the CCA model was tested using ANOVA. According to the CCA results, VPA was performed to determine the contribution of each individual variable or groups of variables to the total variations in the soil bacterial community compositions (Zhou et al. 2008).
All sequences from this study are available in the National Center for Biotechnology Information (NCBI) GenBank (www.ncbi.nlm.nih.gov) under the accession number SRP095149.
RESULTS
Plant and soil characteristics
The root biomasses (g cm–3) were comparable in the root compartments for S. alterniflora (11.59 ± 0.34) and P. australis (10.98 ± 1.60; independent t-test, p > 0.05). The rhizosphere effect did not have a significant influence on the SOC contents (%) and porewater SO42– concentrations (mM; both two-way ANOVA, Table 1). The DOC concentrations (mM, Table 1) significantly decreased from the rhizosphere (mean: 4.3) to the outer bulk soil (mean: 1.1; two-way ANOVA, Tukey; Table 1). The extractable Fe(III) concentrations (μmol Fe g–1, Table 1) also gradually decreased from the rhizosphere (mean: 146.9) to the outer bulk soil (mean: 83.4; two-way ANOVA, Tukey). By contrast, the extractable Fe(II) concentrations (μmol Fe g–1, Table 1) were significantly higher in the outer bulk soil (mean: 52.9), followed by the inner bulk soil (mean: 40.4) and then the rhizosphere (mean: 24.5; two-way ANOVA, Tukey). The total reduced sulfur (TRS) concentrations (μmol S g–1, Table 1) increased by ~4.0 times from the rhizosphere to the outer bulk soil (two-way ANOVA, Tukey). The dissolved CH4 concentrations (mM, Table 1) were significantly higher in the rhizosphere (mean: 27.4) and inner bulk soil (mean: 28.5) compared with the outer bulk soil (mean: 13.5, two-way ANOVA, Tukey). Plant species did not exert a significant influence on the aforementioned soil and porewater geochemistry, except for the DOC concentrations (two-way ANOVA, Table 1). The DOC concentrations were higher in the S. alterniflora rhizoboxes (mean: 3.1) compared with those in the P. australis boxes (mean: 2.3, two-way ANOVA).
Mean ± standard deviation (SD) of the environmental parameters (n = 6) across the three soil zones (rhizosphere and inner and outer bulk soil) of the tidal marsh plants (S. alterniflora and P. australis) in the Min River Estuary, East China Sea.
| Soil zones across the rhizoboxes | Factor | F | p | |||
|---|---|---|---|---|---|---|
| Rhizosphere | Inner bulk soil | Outer bulk soil | ||||
| SOC (%) | R | 0.600 | 0.555 | |||
| S. alterniflora | 1.56 ± 0.08 | 1.54 ± 0.05 | 1.48 ± 0.08 | P | 0.444 | 0.510 |
| P. australis | 1.50 ± 0.16 | 1.52 ± 0.09 | 1.49 ± 0.10 | I | 0.320 | 0.729 |
| DOC (mM) | R | 87.289 | <0.001 | |||
| S. alterniflora | 5.0 ± 0.7 | 2.9 ± 0.5 | 1.5 ± 0.3 | P | 15.202 | 0.001 |
| P. australis | 3.6 ± 0.9 | 2.7 ± 0.6 | 0.7 ± 0.2 | I | 3.134 | 0.058 |
| SO42–(mM) | R | 1.683 | 0.203 | |||
| S. alterniflora | 9.6 ± 1.0 | 8.9 ± 1.3 | 8.2 ± 1.0 | P | 0.276 | 0.603 |
| P. australis | 8.9 ± 1.2 | 8.7 ± 1.2 | 8.6 ± 0.7 | I | 0.853 | 0.436 |
| Fe(III) (μmol Fe g–1) | R | 46.884 | <0.001 | |||
| S. alterniflora | 154 ± 24 | 108 ± 9 | 80 ± 20 | P | 0.013 | 0.910 |
| P. australis | 140 ± 14 | 114 ± 12 | 87 ± 11 | I | 1.518 | 0.236 |
| Fe(II) (μmol Fe g–1) | R | 70.646 | <0.001 | |||
| S. alterniflora | 26.2 ± 4.0 | 42.7 ± 4.3 | 52.2 ± 8.4 | P | 1.214 | 0.279 |
| P. australis | 22.8 ± 7.3 | 38.1 ± 3.0 | 53.6 ± 6.2 | I | 0.868 | 0.430 |
| TRS (μmol S g–1) | R | 159.457 | <0.001 | |||
| S. alterniflora | 12.9 ± 2.2 | 31.2 ± 3.5 | 39.3 ± 3.9 | P | 0.202 | 0.657 |
| P. australis | 11.4 ± 1.9 | 29.6 ± 5.0 | 44.2 ± 6.3 | I | 2.492 | 0.100 |
| Dissolved CH4 (mM) | R | 6.373 | 0.005 | |||
| S. alterniflora | 22.3 ± 10.4 | 28.5 ± 14.8 | 18.3 ± 5.7 | P | 0.001 | 0.972 |
| P. australis | 32.4 ± 12.8 | 28.5 ± 15.5 | 8.6 ± 5.1 | I | 2.227 | 0.125 |
Factor: 'R' denotes rhizosphere effect, 'P' denotes plant species and 'I' denotes interaction among soil zones and plant species.
Bold letters denote a significant difference of p < 0.05.
SOC mineralization and anaerobic terminal metabolic pathways
The accumulation of CO2, CH4, Fe(II) and TRS provided evidence that total SOC mineralization and methanogenesis, as well as microbial Fe(III) and sulfate reduction, were occurring in both the rhizosphere and bulk soil (Fig. 1a to d). The methanogenesis rates (nmol C g–1 d–1) were several orders of magnitude lower compared with those of the SOC mineralization and microbial Fe(III) and sulfate reductions (μmol C g–1 d–1) across the rhizoboxes. The total SOC mineralization rates (μmol C g–1 d–1; Fig. 1a) significantly decreased from the rhizosphere (mean: 33.73), followed by the inner bulk soil (mean: 23.37) and then the outer bulk soil (mean: 18.81; two-way ANOVA, Tukey). The microbial Fe(III) reduction (Fig. 1d) pattern was similar to the total SOC mineralization with the following order: rhizosphere (mean: 13.66) > inner bulk soil (mean: 6.27) > outer bulk soil (mean: 2.30; two-way ANOVA, Tukey). The methanogenesis and sulfate reduction rates (Fig. 1b and c) in the rhizosphere (mean: methanogenesis = 160.35; sulfate reduction = 16.62) and inner bulk soil (mean: methanogenesis = 119.09; sulfate reduction = 15.59) were significantly higher when compared with those that of the outer bulk soil (mean: methanogenesis = 92.50; sulfate reduction = 11.25; two-way ANOVA, Tukey). The impact of the rhizosphere effect on rates of microbial Fe(III) reduction (an increase of 5–7 times) was much higher when compared with that on sulfate reduction (an increase of 1.4–1.5 times) or methanogenesis (an increase of 1.5–2.0 times). Plant species exert their influence on total SOC mineralization rates (two-way ANOVA; Fig. 1a), which were higher in the S. alterniflora rhizoboxes compared with those in the P. australis rhizoboxes (two-way ANOVA). Plant species had no effect on methanogenesis and Fe(III) and sulfate reduction rates (Fig. 1b and d).
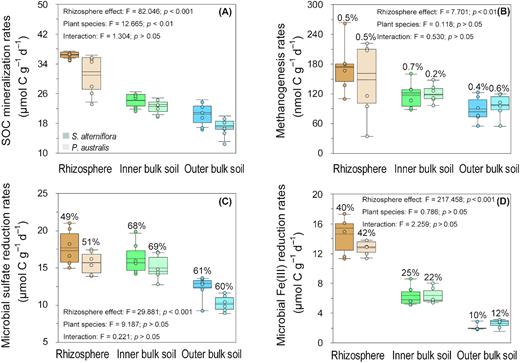
Rates of (A) SOC mineralization, (B) methanogenesis and (C) sulfate reduction and (D) microbial Fe(III) in the rhizosphere, inner bulk soil, and outer bulk soil across the rhizoboxes of S. alterniflora and P. australis in the Min River Estuary, East China Sea. The box-and-whisker plots show the median and interquartile range (IQR); the whiskers show the 1.5 × IQR of the lower and upper quartiles. The relative contributions of methanogenesis and microbial Fe(III) and sulfate reduction are provided at the top of the box-and-whisker plots. Two-way ANOVA analysis of the rhizosphere effect and that of plant species on SOC mineralization rates of each terminal metabolic pathway are provided. S. alterniflora: darker bar, P. australis: lighter bar. Rhizosphere: orange, inner bulk soil: green and outer bulk soil: blue.
The Fe(III) reduction contributions across the rhizoboxes followed this order: rhizosphere (mean: 41%) > inner bulk soil (mean: 24%) > outer bulk soil (mean: 11%). The sulfate reduction contribution was significantly higher in the inner (mean: 68%) and outer bulk soil (mean: 60%) when compared with rhizosphere (mean: 50%). The methanogenesis contribution was comparable (<1%) across the rhizoboxes. Plant species had no effect on the partition of terminal metabolic pathways.
Microbial abundance and enzymatic activity
The rhizosphere effect had a significant influence on the abundance of total bacteria (16S rRNA gene), iron-reducing bacteria (Geobacter), sulfate-reducing bacteria (dsrA) and methanogens (mcrA) as well as β-Glucosidase (βG) activities (two-way ANOVA, p < 0.05; Table 2). The β-Glucosidase (βG; nmol h–1 g–1; Table 2) activities followed the order: rhizosphere (mean: 1.92) > inner bulk soil (mean: 1.55) > outer bulk soil (mean: 1.29; Tukey). The 1,4-β-cellobiosidase (CBH; nmol h–1 g–1; Table 2) showed statistically similar activities across the rhizoboxes (two-way ANOVA). Plant species had no significant effect on the abundance of total bacteria, Geobacter, sulfate-reducing bacteria (dsrA) and methanogens (mcrA) as well as enzymatic activities; however, total bacteria (16S rRNA gene) was significantly higher in the rhizosphere of S. alterniflora than that of P. australis (Table 2).
Mean ± standard deviation (SD) of the environmental parameters (n = 6) across the three soil zones (rhizosphere and inner and outer bulk soil) of the tidal marsh plants (S. alterniflora and P. australis) in the Min River Estuary, East China Sea.
| Soil zones across the rhizoboxes | Factor | F | p | |||
|---|---|---|---|---|---|---|
| Rhizosphere | Inner bulk soil | Outer bulk soil | ||||
| Abundance (log10 copies g–1) | ||||||
| Bacteria (16S rRNA gene) | R | 17.617 | <0.001 | |||
| S. alterniflora | 8.85 ± 0.05 | 8.79 ± 0.05 | 8.65 ± 0.10 | P | 0.019 | 0.039 |
| P. australis | 8.78 ± 0.04 | 8.74 ± 0.11 | 8.57 ± 0.06 | I | 2.046 | 0.147 |
| Iron-reducing bacteria (Geobacter) | R | 364.865 | <0.001 | |||
| S. alterniflora | 6.69 ± 0.05 | 6.31 ± 0.05 | 5.76 ± 0.10 | P | 0.040 | 0.843 |
| P. australis | 6.68 ± 0.05 | 6.33 ± 0.05 | 5.78 ± 0.15 | I | 0.116 | 0.891 |
| Sulfate-reducing bacteria (dsrA) | R | 32.457 | <0.001 | |||
| S. alterniflora | 8.30 ± 0.06 | 8.27 ± 0.07 | 8.06 ± 0.08 | P | 0.471 | 0.498 |
| P. australis | 8.30 ± 0.02 | 8.24 ± 0.02 | 8.05 ± 0.15 | I | 0.134 | 0.875 |
| Methanogen (mcrA) | R | 239.407 | <0.001 | |||
| S. alterniflora | 5.14 ± 0.04 | 4.91 ± 0.11 | 4.44 ± 0.08 | P | 2.156 | 0.152 |
| P. australis | 5.04 ± 0.03 | 4.91 ± 0.10 | 4.43 ± 0.05 | I | 1.793 | 0.184 |
| Enzymatic activity (nmol h–1 g–1) | ||||||
| β-glucosidase (βG) | R | 7.711 | 0.002 | |||
| S. alterniflora | 1.90 ± 0.38 | 1.52 ± 0.28 | 1.33 ± 0.38 | P | 0.0001 | 0.987 |
| P. australis | 1.94 ± 0.39 | 1.56 ± 0.52 | 1.25 ± 0.37 | I | 0.076 | 0.927 |
| 1,4-β-cellobiosidase (CBH) | R | 1.471 | 0.246 | |||
| S. alterniflora | 0.34 ± 0.12 | 0.31 ± 0.06 | 0.22 ± 0.05 | P | 0.364 | 0.551 |
| P. australis | 0.27 ± 0.10 | 0.28 ± 0.08 | 0.26 ± 0.13 | I | 0.954 | 0.397 |
| Alpha diversity (bacteria) | ||||||
| Shannon index | R | 22.842 | <0.001 | |||
| S. alterniflora | 6.01 ± 0.07 | 6.59 ± 0.06 | 6.61 ± 0.04 | P | 25.025 | <0.001 |
| P. australis | 6.24 ± 0.09 | 6.76 ± 0.19 | 6.55 ± 0.10 | I | 17.121 | <0.001 |
| Chao-1 index | R | 62.312 | <0.001 | |||
| S. alterniflora | 2596 ± 143 | 3629 ± 108 | 3433 ± 143 | P | 31.295 | <0.001 |
| P. australis | 3049 ± 92 | 3961 ± 179 | 3354 ± 170 | I | 31.167 | <0.001 |
Factor: 'R' denotes rhizosphere effect, 'P' denotes plant species and 'I' denotes interaction among the soil zones and plant species.
Bold letters denote a significant difference of p < 0.05.
Bacteria diversity and community composition
Both the Shannon (range: 6.01–6.76) and Chao-1 (range: 2596–3961) indices showed that the bulk soil (particularly the inner bulk soil) had greater OTU diversity than that of the rhizosphere (two-way ANOVA, Tukey; Table 2). The Chao-1 and Shannon indices from the S. alterniflora rhizoboxes were relatively low compared with those of the P. australis boxes (two-way ANOVA; Table 2).
A total of 953 OTUs (20%) synchronously occurred in the rhizosphere, inner and outer bulk soil (Fig. 2a). A total of 818 (17.1%), 1054 (22.1%) and 1021 (21.4%) OTUs preferred the rhizosphere, inner bulk soil and outer bulk soil, respectively. The bacterial communities could be clearly separated across three different soil zones and between two plant species based on the NMDS of the OTUs (Fig. 2b). Combined with the results from PerMANOVA, they suggested that both rhizosphere effect and plant species have a significant influence on bacterial community compositions (Table 3). The cluster analysis results (assessed as UniFrac distances; Lozupone and Knight 2005; Fig. 2c) also confirmed that the rhizosphere and inner bulk soil samples independently clustered with the dissimilarity indices tested. Individual plant species have a less pronounced effect than the rhizosphere effect in structuring bacterial communities in the tidal marshes (Table 3).
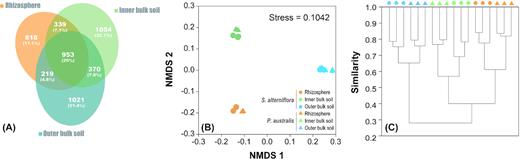
(A) Bacterial community structure and Venn diagram comparing the microbial structure similarities across the root zones (rhizosphere and inner and outer bulk soil) of the S. alterniflora and P. australis rhizoboxes in the Min River Estuary, East China Sea. The Venn diagram shows the shared phylotypes. (B) Nonmetric multidimensional scaling analysis and (C) cluster analysis were based on the Paired group (UPGMA) algorithm and the Bray-Curtis similarity index. The colors denote the three zones in the rhizoboxes, including the rhizosphere (orange), inner bulk soil (green) and outer bulk soil (blue). Circles: S. alterniflora; triangles: P. australis.
Summary of the permutation tests used to investigate the soil microbial community composition based on the OTUs across the three soil zones (rhizosphere and inner and outer bulk soil) of the tidal marsh plants (S. alterniflora and P. australis) in the Min River Estuary, East China Sea. Dissimilarity tests were performed by two-way PerMANOVA based on (Euclidean, Bray–Curtis and Horn) distance.
| Dissimilarity | Rhizosphere effect | Plant species | Interaction | ||||||
|---|---|---|---|---|---|---|---|---|---|
| df | F | p | df | F | p | df | F | p | |
| Euclidean | 2 | 37.133 | <0.001 | 1 | 16.332 | <0.001 | 2 | 9.9006 | <0.001 |
| Bray-Curtis | 2 | 38.126 | <0.001 | 1 | 13.856 | <0.001 | 2 | 7.2717 | <0.001 |
| Horn | 2 | 144.81 | <0.001 | 1 | 36.293 | <0.001 | 2 | 12.545 | <0.001 |
Bold letters denote a significant difference of p < 0.05.
The dominant phylum level of bacteria (≥2% of sequences analyzed in different clone libraries) in the rhizosphere and bulk soil included Proteobacteria, Chloroflexi, Acidobacteria, Nitrospirae and Latescibacteria (listed according to taxonomy; Fig. 3a). In terms of the relative abundance (% of OTUs), the five most abundant phyla recovered accounted for 72.9–83.9% of these sequences. All the soil zones were dominated by Proteobacteria, contributing to 35.2 ± 5.6% of the total OTUs. However, the relative abundances of the Proteobacteria were comparable across the rhizoboxes, while significantly changed between plant species (Fig. 3a). By contrast, the relative abundances of Chloroflexi, Acidobacteria, Nitrospirae and Latescibacteria differed across the rhizoboxes, which were comparable between plant species (Fig. 3a).
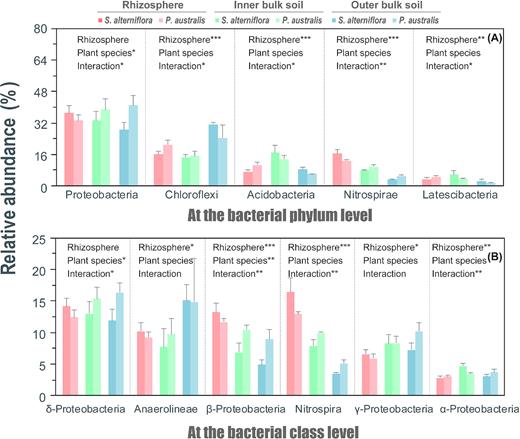
Taxonomic composition at the bacterial phylum level (A; at least one phylum relative abundance > 2%) and at the bacterial class level (B; at least one class relative abundance > 3%) across the root zones (rhizosphere and inner and outer bulk soil) of the S. alterniflora and P. australis rhizoboxes in the Min River Estuary, East China Sea. Two-way ANOVA analysis of the rhizosphere effect and plant species on each phylum or class are provided. Significant differences across the root zones or plant species are indicated by * when 0.01 < p < 0.05; ** when 0.001 < p < 0.01; and *** when p < 0.001 (two-way ANOVA).
The dominant class level of bacteria (≥3% of sequences analyzed in different clone libraries) in the rhizosphere and bulk soil included δ-Proteobacteria, Anaerolineae, β-Proteobacteria, Nitrospira, γ-Proteobacteria and α-Proteobacteria (listed according to taxonomy, Fig. 3b). The relative abundance of these six classes accounted for 39.3–68.4% of the total OTUs. Moreover, δ-proteobacteria had the highest abundance (11.8–16.3%) at the class-level (Fig. 3b). The relative abundances of the δ-proteobacteria were comparable across the rhizoboxes, while the other five classes showed significant differences across the rhizoboxes (Fig. 3b). Only δ-proteobacteria and β-proteobacteria significantly changed between plant species (Fig. 3b).
The genus-level species with relative abundances less than 1‰ were filtered out. From the filtered results, the top 25 dominant genera were constructed into a heatmap to depict the relative abundance of the OTUs that best represent the dissimilarities between the bacterial communities in the rhizosphere versus inner or outer bulk soil (Fig. 4). They belonged to eight phyla: Proteobacteria, Chloroflexi, Acidobacteria, Nitrospirae, Actinobacteria, Cyanobacteria, Spirochaetes and Ignavibacteriae. There were 17 dominant genera derived from the phylum Proteobacteria and 11 dominant genera belonged to the δ-Proteobacteria class. Several of the genera have been reported by previous researchers to have iron- or sulfate-reducing and denitrification abilities (the reference is provided in Table S1).
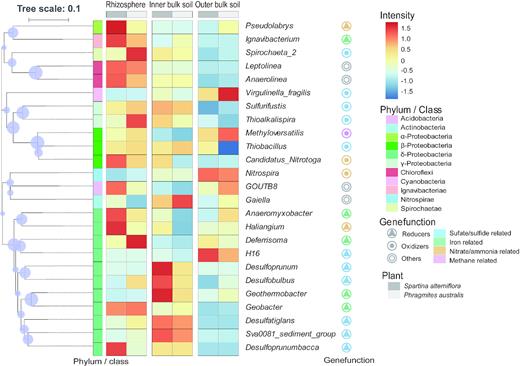
Heatmap showing the relative abundance of the bacterial OTUs of the top 25 genera across the root zones (rhizosphere and inner and outer bulk soil) of the S. alterniflora and P. australis rhizoboxes in the Min River Estuary, East China Sea. The colors correspond to the relative sequence abundance of the OTUs as indicated by the color legend.
Based on the CCA and VPA, only Fe(III) reduction (contribution = 24.7%, F = 4.7, p < 0.01; Fig. 5b) and sulfate reduction (contribution = 8.8%, F = 2.0, p < 0.05; Fig. 5b) significantly contributed to the bacterial community composition (Fig. 5a). Methanogenesis did not make a significant contribution to bacterial community composition.
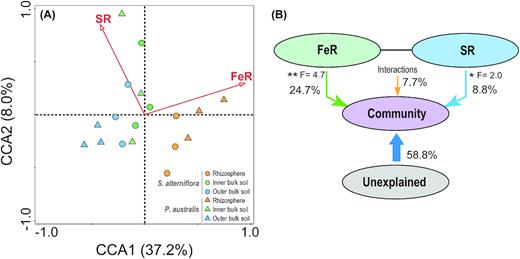
Canonical correspondence analyses (CCA) and variation partition analysis (VPA) based on the 16S rRNA gene amplicon sequences across the root zones (rhizosphere and inner and outer bulk soil) of the S. alterniflora and P. australis rhizoboxes in the Min River Estuary, East China Sea. S. alterniflora: circle; P. australis: triangle. Rhizosphere: orange; inner bulk soil: green; and outer bulk soil: blue.
DISCUSSION
Rhizosphere effect on SOC mineralization rates and pathways in the tidal marshes
Previous studies have reported that the rhizosphere effect promoted the potential of total SOC mineralization in tidal marshes (Kostka et al. 2002a; Kostka, Roychoudhury and Cappellen 2002b; Gribsholt, Kostka and Kristensen 2003; Wolf et al. 2007; Mueller, Jensen and Megonigal 2016; Bernal, Megonigal and Mozdzer 2017). In line with this, the total SOC mineralization rates in the rhizosphere increased by 77% to 82% in the rhizosphere of P. australis and S. alterniflora relative to outer bulk soil in the Min River Estuary (Fig. 1a). The rhizosphere effect efficiency (i.e., promotion of total SOC mineralization rates from bulk soil to the rhizosphere) in this study was comparable with that of mineral tidal marshes (Kostka et al. 2002a; Kostka, Roychoudhury and Cappellen 2002b; Gribsholt, Kostka and Kristensen 2003), but was much lower than (167% to 182%) that of organic tidal marshes (Mueller et al. 2015; Wolf et al. 2007). The SOC contents in those organic tidal marshes (> 40%) far outstripped the current study and other mineral tidal marshes (< 2%). The distinctive SOC contents may explain, at least partly, the rhizosphere effect site differences among the different sites.
Roots support SOC mineralization by supplying labile organic C to soils (Hines et al. 1999; Neubauer, Emerson and Megonigal 2008; Yarwood 2018), explaining the positive correlation between the total SOC mineralization rates and DOC concentrations in this study (Pearson, r = 0.856, p < 0.001). Because the sampling period was during the vigorous growth period of the tidal marsh plants, DOC would be enriched in organic acid and glucose as reported in previous studies (Hines et al. 1999; Derrien, Marol and Balesdent 2004; Tobias and Neubauer 2009). This could explain why DOC concentrations were also in relation to β-Glucosidase activities (Pearson, r = 0.870, p < 0.001), an extracellular enzyme targeted at labile C (Kögel-Knabner 2002). Furthermore, DOC concentrations were also in accordance with the total bacterial abundance (16S rRNA gene; Pearson, r = 0.547, p < 0.01). These combined results highlighted a possible mechanism for the rhizosphere effect on SOC mineralization: the living roots of the tidal marsh plants release labile C into the surrounding soils, leading to an increase in the total bacterial growth and β-Glucosidase enzymatic activity further facilitating the potential of total SOC mineralization in the rhizosphere.
Similar to the total SOC mineralization rates, the microbial Fe(III) and sulfate reduction rates and methanogenesis also increased from the bulk soil to rhizosphere (Fig. 1b to d). The rhizosphere effect had a more dominant influence on Fe(III) reduction (an increase of 5–7 times) compared with that of sulfate reduction (an increase of 1.4–1.5 times) or methanogenesis (an increase of 1.5–2.0 times). In accordance with the terminal metabolic rates, the Geobacter abundance also showed a greater increase (~8.5 times) compared with that of dsrA (1.7 times) and mcrA (4.5 times) towards the roots (Table 2). All three terminal metabolic rates were deeply influenced by DOC concentrations (Pearson, r > 0.709, p < 0.001). However, regarding Fe(III) reduction, the rates were also associated with changes in Fe(III) contents across the rhizoboxes (Fig. S2). The Fe(III) could be reallocated by the ROL of the tidal marsh plants (Mueller, Jensen and Megonigal 2016), since root-derived O2 could oxidize Fe2+ in the rhizosphere soils, precipitating a reddish Fe plaque on the root surface (Khan et al. 2016). This Fe plaque was enriched in bioavailable Fe(III) that was easily accessed by iron-reducing bacteria (Armstrong et al. 2000). In our previous study, we also found a logarithmically decreasing pattern against the distance from the roots in the tidal marsh soils because of ROL (Luo et al. 2018). Accordingly, the enhancement of microbial Fe(III) reduction rates appeared much stronger compared with those of sulfate reduction and methanogenesis when approaching the roots. The premise for this preference for Fe(III) reduction is that tidal marsh soils, particularly mineral tidal marshes, are anaerobic (owing to inundation) and enriched in Fe(III) minerals. In other ecosystems (e.g., upland soils), if the soil redox condition is relatively aerobic, the plants would not develop such strong ROL capabilities as those of marsh plants (Khan et al. 2016). This preference for Fe(III) reduction would thus be rather limited in upland soils but may be applicable to some Fe(III)-rich paddy soils.
To the best of our knowledge, few studies have quantified the partition of terminal metabolic pathways between the rhizosphere and bulk soil in tidal marshes. Microbial sulfate reduction has been widely recognized as the most common terminal metabolic pathway in coastal and marine ecosystems because of high porewater SO42– concentrations (Hines, Knollmeye and Tugel 1989; Kostka et al. 2002a; Hyun et al. 2007, 2009). The presence of plants can somehow increase the FeR% competitiveness (from 28% to 96%) in coastal wetlands, including mangroves (Kristensen et al. 2000; Kristensen and Alongi 2006), salt marshes (Gribsholt and Kristensen 2002; Kostka et al. 2002a; Luo et al. 2017) and freshwater marshes (Neubauer et al. 2005). For the first time, we have observed that the rhizosphere effect shifts the dominant terminal metabolic pathways from the predominantly sulfate reduction in bulk soil to the co-domination of Fe(III) and sulfate reduction in the rhizosphere. This result highlights that when studying C cycling in tidal marshes, it is necessary to consider the heterogeneity of SOC mineralization rates and pathways in millimeter-scale zones.
The rhizosphere effect also enhanced the methanogenesis rates from the bulk soil to the rhizosphere, with methanogenesis continually accounting for <1% of the total SOC mineralization across the rhizoboxes (Fig. 1b). There are two potential explanations for the low methanogenesis contribution: (i) methanogenesis suppression from the perspective of energy yield by both Fe(III) and sulfate reduction (Froelich et al. 1979) and (ii) newly yielded CH4 immediately aerobically and/or anaerobically being oxidized by both microbial Fe(III) and sulfate reduction (Küsel et al. 2008; Beal, House and Orphan 2009; Wang et al. 2018).
Bacterial community composition coinciding with terminal metabolic pathways
As expected, the rhizosphere effect increased the abundance of total bacteria, Geobacter, dsrA and mcrA in the rhizosphere relative to bulk soil, as higher DOC concentrations approached the roots (Table 2). However, it was surprising that the bacterial α-diversity showed a lower value in the rhizosphere compared with that in the bulk soil (Table 2). A similar result has also been reported in coastal mangrove sediments (Jiang et al. 2013). Li et al. (2019) suggested that the analysis technique may be responsible for the low diversity in the rhizosphere, because 16S rRNA gene sequence analysis would detect both active and inactive bacteria. That research further suggested that the rhizosphere effect does support high bacterial richness, when only considering active bacteria.
Proteobacteria was the largest phylum and the δ-Proteobacteria the largest class in the present study (Fig. 3a and b). Surprisingly, rhizosphere effects did not exert significant influence on both of these (Fig. 3a and b). When further examining bacteria at a genera level, we found that there was a large proportion (36–52%) of iron- and sulfate-reducing bacteria within the δ-Proteobacteria class (Fig. 4). Several important iron-reducing bacteria were identified, including Geobacter, Anaeromyxobacter and Ignavibacterium (Fig. 4 and Table S1). Geobacter is among the most abundant iron-reducing bacteria on Earth (Lovley, Holmes and Nevin 2004). Anaeromyxobacter are well-known iron-reducing bacteria in many paddy soil systems and are capable of acetate oxidation (Hori et al. 2010; Ahn et al. 2014; Yuan et al. 2016). Ignavibacteria has been isolated from iron-reducing enrichment cultures of hot-spring sediments from Yellowstone National Park (Fortney et al. 2018). There was also a clade of typical sulfate-reducing bacteria, e.g., Desulfoprunum, Desulfatiglans, Desulfobacca and Desulfobulbus. Sulfate-reducing bacteria have previously been found in mangrove (Yang, Tsai and Chang 2018) and estuarine marsh sediments (Jiang et al. 2009; Zeleke et al. 2013).
Based on the heatmap, the relative abundance of iron-reducing bacteria decreased from the rhizosphere to the bulk soil, while the sulfate-reducing bacteria showed a higher relative abundance in the bulk soil (particularly the inner bulk soil) compared with that of the rhizosphere (Fig. 4). Such transitions provided microbiological evidence for the shift in Fe(III) and sulfate reduction across the rhizoboxes. To further explore this point, we applied CCA and VPA analysis to confirm the relationship between the bacterial community compositions and partition in the terminal metabolic pathways. Results suggested that microbial Fe(III) and sulfate reduction could both explain a portion of the changes observed in the bacterial community compositions across the rhizoboxes (Fig. 5a). Microbial Fe(III) reduction (24.7%) had a greater influence on the bacterial community compositions than that of sulfate reduction (8.8%; Fig. 5b). These results prove the hypothesis that a shift in partition in the terminal metabolic pathways could partly explain bacterial community compositions in the tidal marsh soils.
Abundance and composition of bacterial communities between the S. alterniflora and P. australis rhizoboxes
Plant species can influence rhizosphere microbial communities in natural wetlands (Ravit et al. 2007; Prasse, Baldwin and Yarwood 2015). There have been a wide variety of published results assessing different microbial communities in S. alterniflora and P. australis in tidal marsh ecosystems (Ravit, Ehrenfeld and Haggblom 2003; Angeloni et al. 2006; Ravit et al. 2007; Nie et al. 2009; Prasse, Baldwin and Yarwood 2015; Yang et al. 2016). Most studies have suggested that plant species differ in their microbial abundance and biomass (Burke, Hamerlynck and Hahn 2002; Lu et al. 2006). In accordance with these studies, we also found that S. alterniflora soils have a higher abundance of total bacteria (16S rRNA gene) compared with that of the P. australis soils in our study (Table 2). The well-developed root system and greater root biomass of S. alterniflora relative to P. australis are used to provide the most reasonable explanation for the different abundances of total bacteria in undisturbed natural tidal marshes (Ravit, Ehrenfeld and Haggblom 2003; Ravit et al. 2007; Yang et al. 2016). However, probably because of the limited space in the root compartments, root biomass was comparable between the two plant species. Most of the environmental parameters did not show a significant difference between the two plant species, except DOC concentrations (Table 1). A previous study has suggested that the root exudation rates of S. alterniflora can be >12–104 μg C g–1 root h–1, higher than P. australis (9 μg C g–1 root h–1) during growth periods (Zhai et al. 2013). Thus, even with similar root biomass, the roots of S. alterniflora can release more labile C substrates in the rhizosphere than those of P. australis. Difference in root exudates can influence rhizosphere bacterial abundance in tidal wetlands (Ravit et al. 2007; Prasse, Baldwin and Yarwood 2015). Thus, it was not surprising that the abundance of total bacteria was significantly higher in the rhizosphere of S. alterniflora than that of P. australis (Table 2). Furthermore, higher abundance of total bacteria could explain the higher total SOC mineralization rates in the S. alterniflora rhizoboxes compared with those of P. australis (Fig. 1a).
It was beyond our expectation that bacteria in the P. australis rhizoboxes would be more diverse than those of the S. alterniflora (Table 2). However, a lower bacterial α diversity was also found in S. alterniflora stands than that in P. australis stands in other estuarine marsh sediments (Zeleke et al. 2013). A reasonable explanation is that the S. alterniflora may only favor the dominance of certain bacterial species. As root exudates differ among plant species, the bacterial diversity was also influenced by the types of organic compounds present in the rhizosphere (Wang, Chen and Li 2007). If this was the case, it could also explain the difference in the bacterial community compositions between two plant species (Fig. 2b and Table 3). Previous studies have reported that a greater abundance of Acidobacteria, δ-Proteobacteria and Bacteroidetes, which all have special heterotrophic metabolic capabilities, are found in the rhizosphere soils of S. alterniflora compared with those of P. australis (Tang et al. 2011; Rietl et al. 2016; Nie et al. 2019). Similarly, Proteobacteria at a phylum level, and δ- and β-Proteobacteria at the bacterial class level were identified, and had relatively lower abundances in the rhizosphere of P. australis compared with that of S. alterniflora (Fig. 3). By contrast, they showed a relatively higher abundance in the bulk soil sample from P. australis compared with that of S. alterniflora. Both δ- and β-Proteobacteria contain abundant anaerobic degraders and facultative anaerobes; this could explain why the plant species did not have a significant impact on the pathways of organic carbon mineralization.
CONCLUSIONS
In this study, we investigated the rhizosphere effect and the influence of plant species on the total SOC mineralization and each terminal metabolic pathway using in situ rhizoboxes in an estuarine tidal marsh. The results suggested that the rhizosphere effect significantly increased the SOC mineralization, Fe(III) reduction and sulfate reduction rates and also methanogenesis from the bulk soil to the rhizosphere. However, because of the ability of reallocation of Fe(III), we found that the rhizosphere effect showed a greater preference towards microbial Fe(III) reduction relative to the other two terminal metabolic pathways. For the first time, we have shown that the rhizosphere effect shifts the dominant terminal metabolic pathways from sulfate reduction in bulk soil to the co-dominance of microbial Fe(III) and sulfate reduction in the rhizosphere. The relative contribution of methanogenesis remained negligible (<1%) in both the rhizosphere and bulk soil. More importantly, the shift in the terminal metabolic pathways was associated with the bacterial community composition across the rhizoboxes. Plant species did not affect the partitioning of terminal metabolic pathways, but did influence the total SOC mineralization rates as well as the total bacterial abundance. Although the rhizosphere effect and that of plant species both influence the bacterial community, our study shows that plant species had a less pronounced impact on the bacterial community when compared with that of the rhizosphere effect.
ACKNOWLEDGEMENTS
This work was financially supported by the National Science Foundation of China (Grant No. 41501252), the Science Foundation of the Fujian Province (Grant No. 2016J05097), Key d Laboratory of Wet Subtropical Ecology and Geography process of the Ministry of Education (Grant No. 2017KFJJ02), Key Laboratory of Coastal Environmental Processes and Ecological Remediation, YICCAS (Grant No. 2018KFJJ10) and the Open Test Fund for valuable instruments and equipment from Fuzhou University (2018T013). We thank the Elsevier Web shop for its assistance with language editing during the preparation of this manuscript.
Authors' contributions: ML designed the experiment. YL and ML co-wrote the manuscript with substantial contributions from JH, RY, LX and CT. All authors conducted the research and analyzed the data. All authors edited the manuscript.
Conflict of interest. None declared.
